Ant Abundance along a Productivity Gradient: Addressing Two Conflicting Hypotheses
- PMID: 26176853
- PMCID: PMC4503676
- DOI: 10.1371/journal.pone.0131314
Ant Abundance along a Productivity Gradient: Addressing Two Conflicting Hypotheses
Abstract
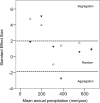
The number of individuals within a population or community and their body size can be associated with changes in resource supply. While these relationships may provide a key to better understand the role of abiotic vs. biotic constraints in animal communities, little is known about the way size and abundance of organisms change along resource gradients. Here, we studied this interplay in ants, addressing two hypotheses with opposite predictions regarding variation in population densities along resource gradients- the 'productivity hypothesis' and the 'productivity-based thinning hypothesis'. The hypotheses were tested in two functional groups of ground-dwelling ants that are directly primary consumers feeding on seeds: specialized seed-eaters and generalist species. We examined variations in colony density and foraging activity (a size measurement of the forager caste) in six ant assemblages along a steep productivity gradient in a semi-arid region, where precipitation and plant biomass vary 6-fold over a distance of 250km. An increase in the density or foraging activity of ant colonies along productivity gradients is also likely to affect competitive interactions among colonies, and consequently clinal changes in competition intensity were also examined. Ant foraging activity increased with productivity for both functional groups. However, colony density revealed opposing patterns: it increased with productivity for the specialized seed-eaters, but decreased for the generalist species. Competition intensity, evaluated by spatial partitioning of species at food baits and distribution of colonies, was uncorrelated with productivity in the specialized seed-eaters, but decreased with increasing productivity in the generalists. Our results provide support for two contrasting hypotheses regarding the effect of resource availability on the abundance of colonial organisms- the 'productivity hypothesis' for specialized seed-eaters and the 'productivity-based thinning hypothesis' for generalist species. These results also stress the importance of considering the role of functional groups in studies of community structure.
Conflict of interest statement
Figures


Similar articles
-
Spatial structure and nest demography reveal the influence of competition, parasitism and habitat quality on slavemaking ants and their hosts.BMC Ecol. 2011 Mar 28;11:9. doi: 10.1186/1472-6785-11-9. BMC Ecol. 2011. PMID: 21443778 Free PMC article.
-
Ant diversity in Neotropical savannas: Hierarchical processes acting at multiple spatial scales.J Anim Ecol. 2020 Feb;89(2):412-422. doi: 10.1111/1365-2656.13111. Epub 2019 Oct 19. J Anim Ecol. 2020. PMID: 31556096
-
Food resource exploitation and functional resilience in ant communities found in common Mediterranean habitats.Sci Total Environ. 2019 Sep 20;684:126-135. doi: 10.1016/j.scitotenv.2019.05.260. Epub 2019 May 22. Sci Total Environ. 2019. PMID: 31153062
-
Ant predation on herbivores through a multitrophic lens: how effects of ants on plant herbivore defense and natural enemies vary along temperature gradients.Curr Opin Insect Sci. 2016 Apr;14:73-80. doi: 10.1016/j.cois.2016.02.001. Epub 2016 Feb 8. Curr Opin Insect Sci. 2016. PMID: 27436650 Review.
-
Individual versus social complexity, with particular reference to ant colonies.Biol Rev Camb Philos Soc. 2001 May;76(2):211-37. doi: 10.1017/s1464793101005656. Biol Rev Camb Philos Soc. 2001. PMID: 11396847 Review.
Cited by
-
Top-down response to spatial variation in productivity and bottom-up response to temporal variation in productivity in a long-term study of desert ants.Biol Lett. 2022 Sep;18(9):20220314. doi: 10.1098/rsbl.2022.0314. Epub 2022 Sep 14. Biol Lett. 2022. PMID: 36102012 Free PMC article.
-
Functional richness shows spatial scale dependency in Pheidole ant assemblages from Neotropical savannas.Ecol Evol. 2019 Sep 27;9(20):11734-11741. doi: 10.1002/ece3.5672. eCollection 2019 Oct. Ecol Evol. 2019. PMID: 31695883 Free PMC article.
References
-
- Ricklefs RE, Schluter D. Species diversity in ecological communities: historical and geographical perspectives: University of Chicago press, Chicago; 1993.
-
- Brown JH. Macroecology: University of Chicago Press, Chicago; 1995.
-
- Buckley LB, Rodda GH, Jetz W. Thermal and energetic constraints on ectotherm abundance: a global test using lizards. Ecology. 2008; 89: 48–55. - PubMed
-
- Meehan TD, Jetz W, Brown JH. Energetic determinants of abundance in winter landbird communities. Ecol Lett. 2004; 7: 532–7.
Publication types
MeSH terms
LinkOut - more resources
Full Text Sources
Other Literature Sources

