. 2015 Jul 23;523(7561):431-436.
doi: 10.1038/nature14658. Epub 2015 Jul 15.

Antibody against early driver of neurodegeneration cis P-tau blocks brain injury and tauopathy

Affiliations

Antibody against early driver of neurodegeneration cis P-tau blocks brain injury and tauopathy

Asami Kondo et al. Nature. .

Abstract

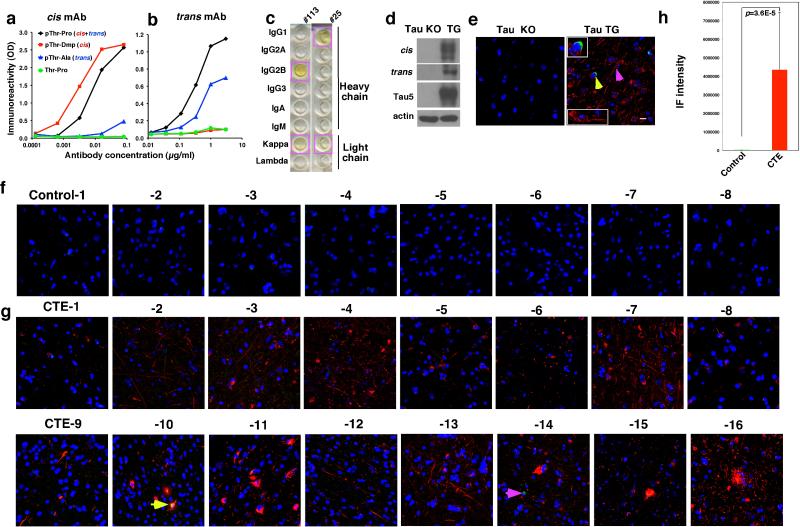
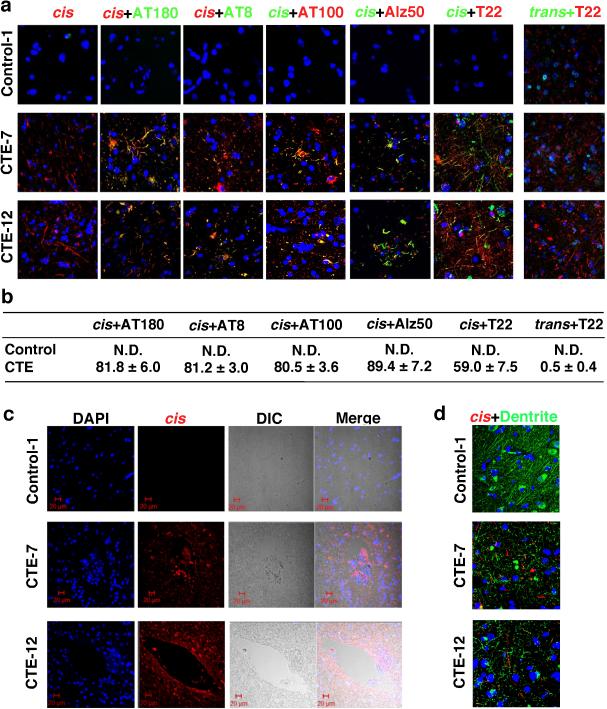
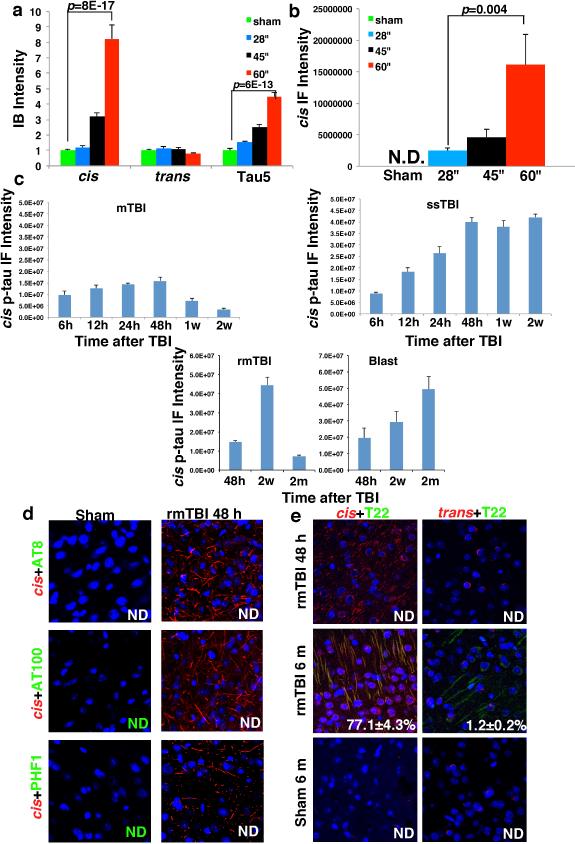
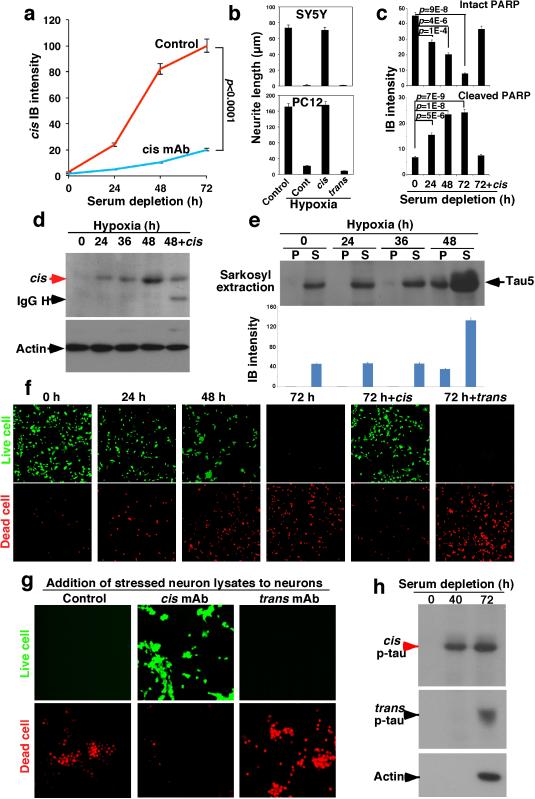
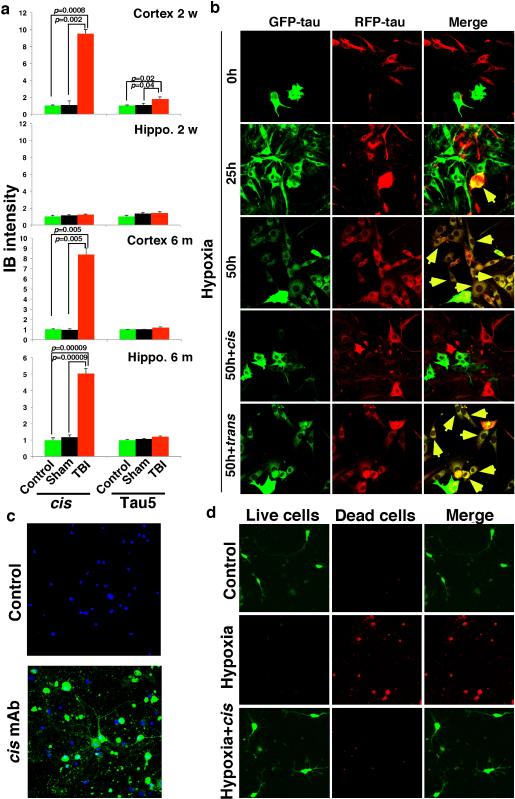
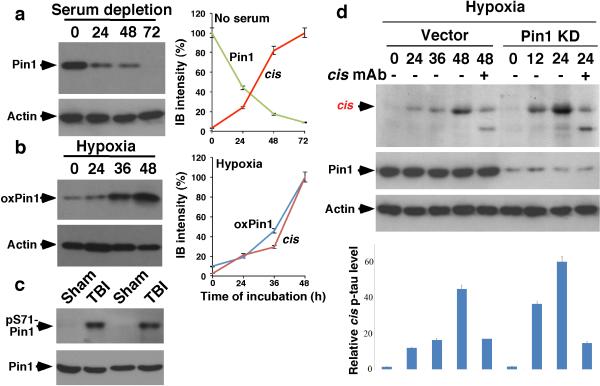
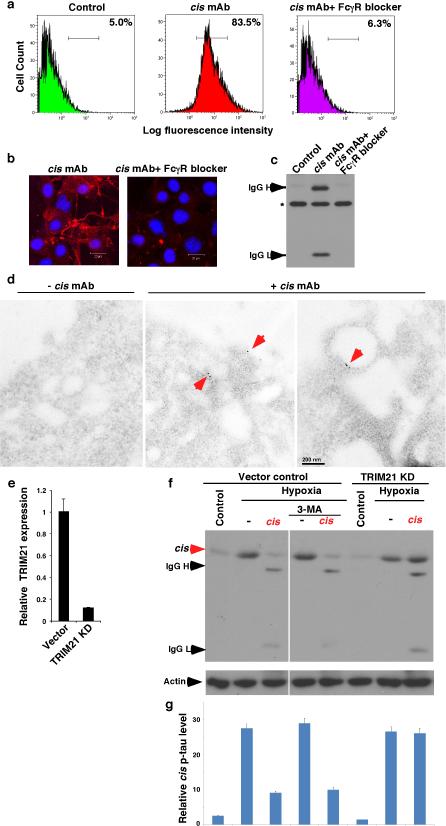
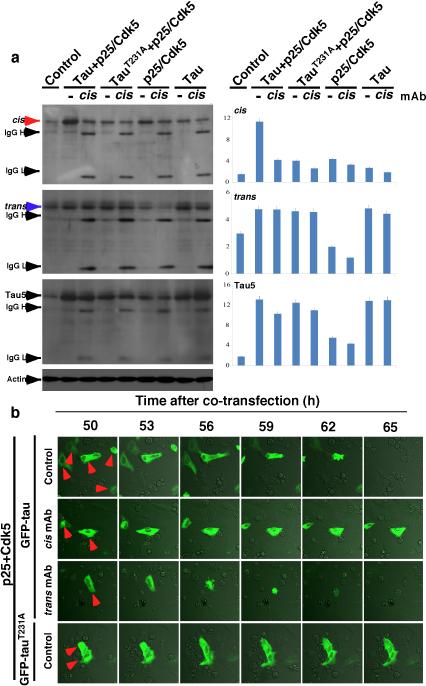
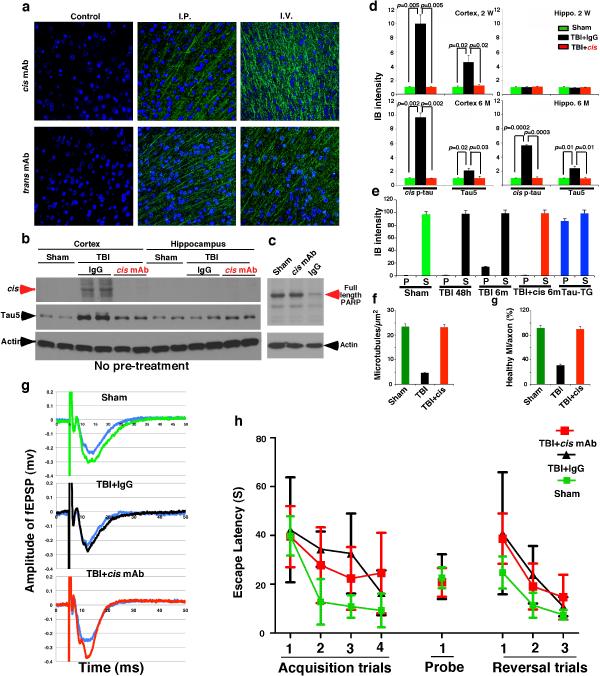
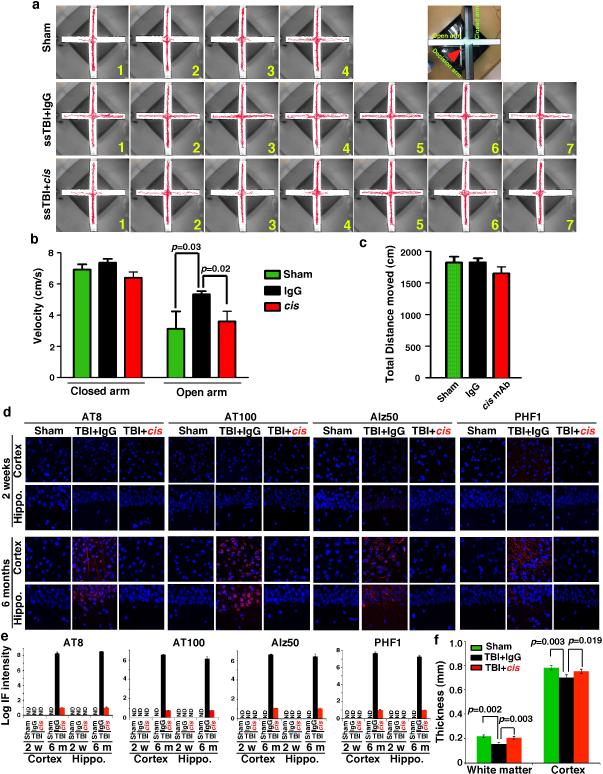
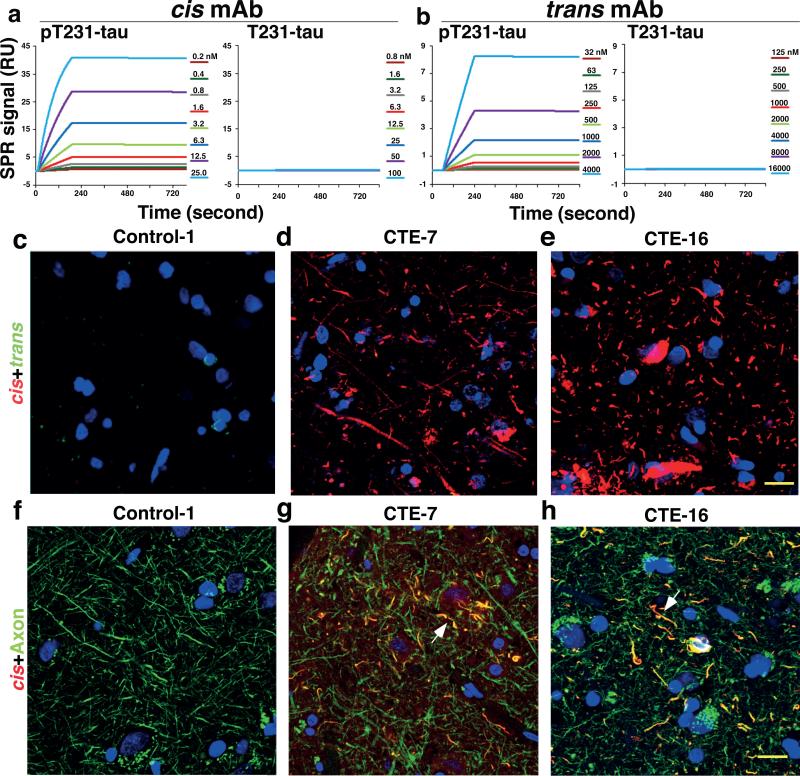
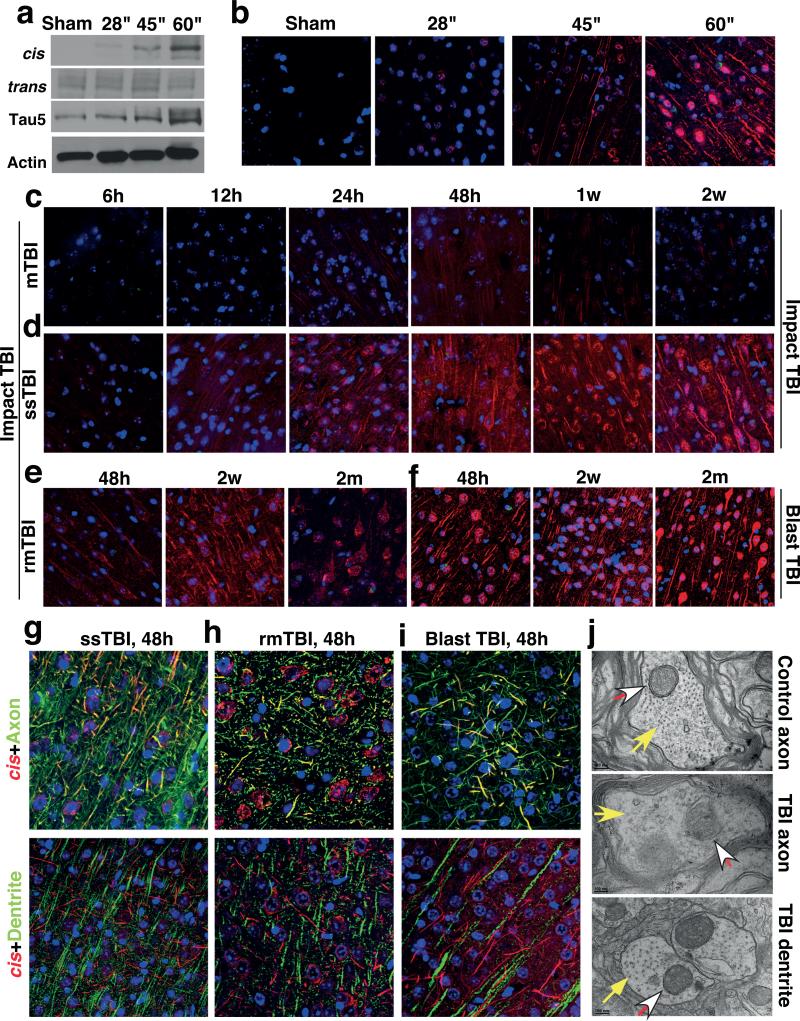
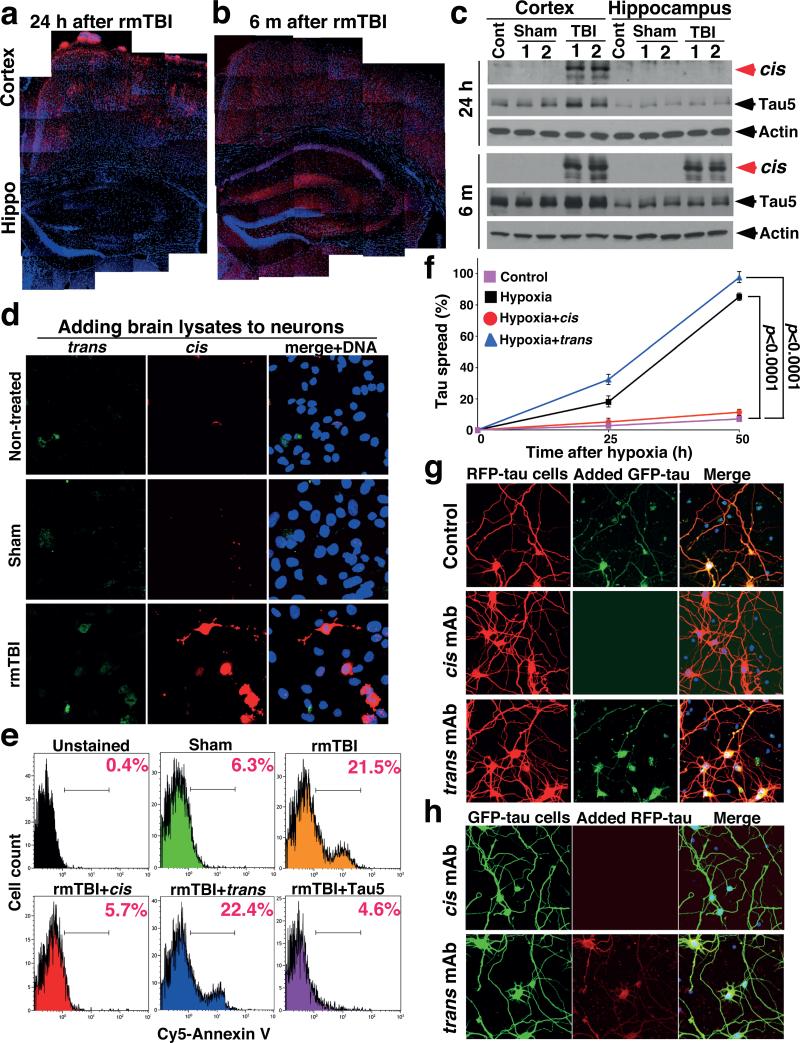
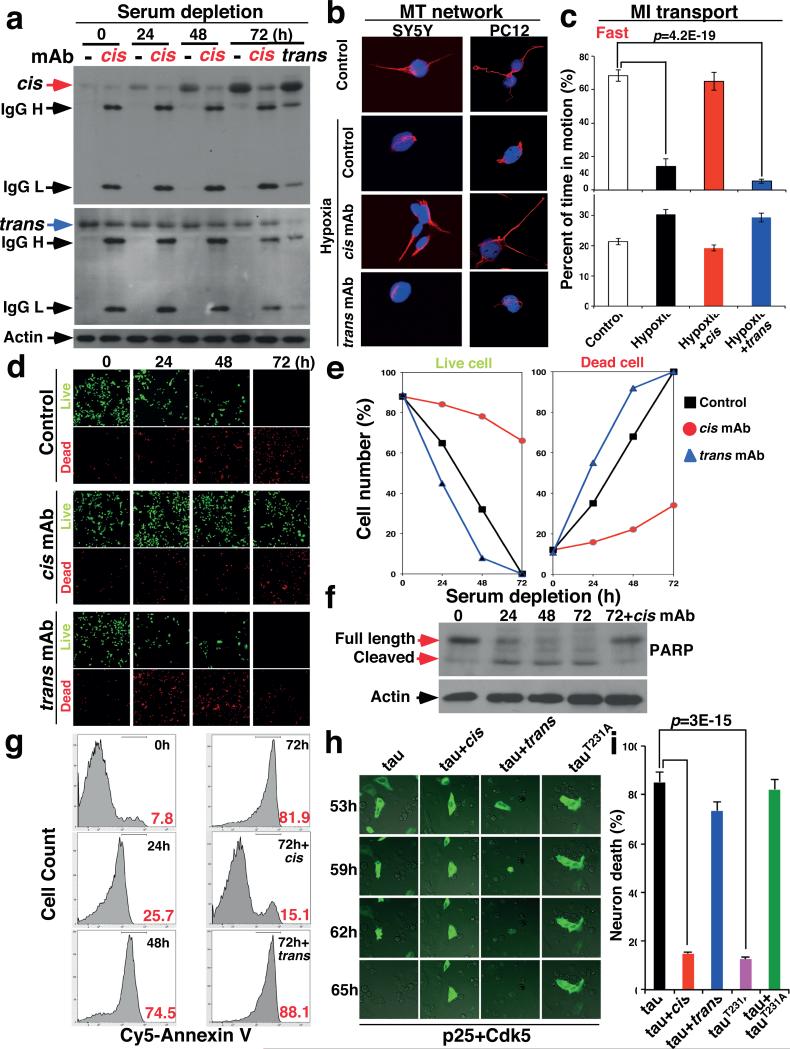
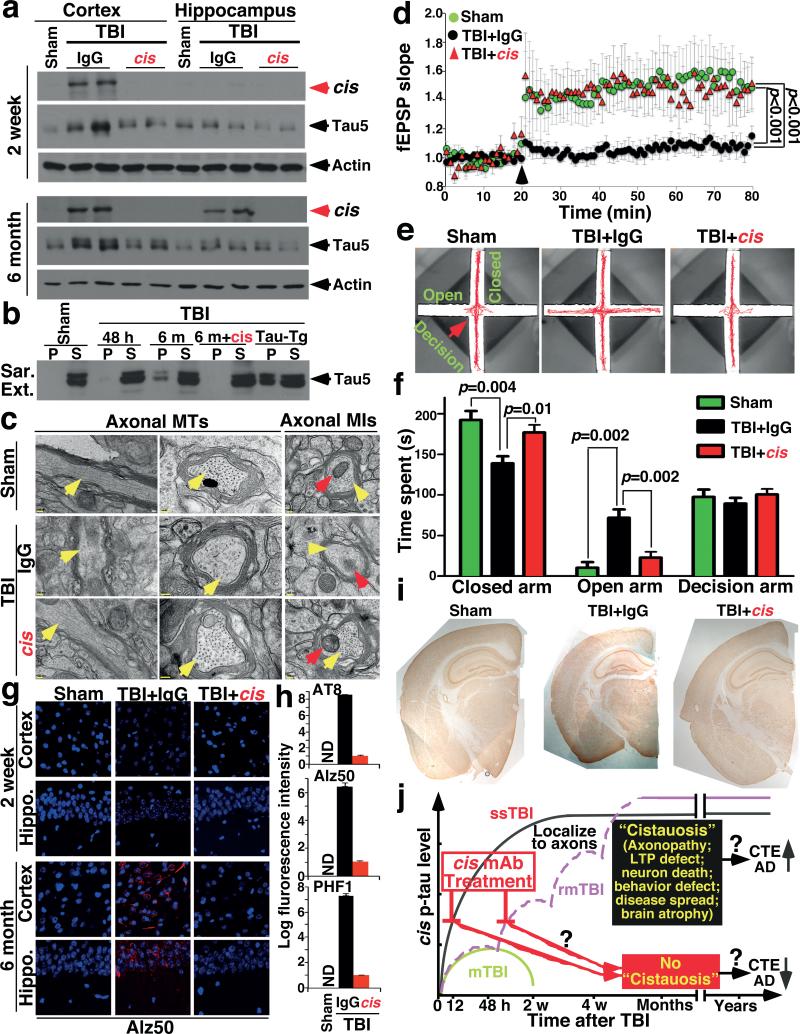
Traumatic brain injury (TBI), characterized by acute neurological dysfunction, is one of the best known environmental risk factors for chronic traumatic encephalopathy and Alzheimer's disease, the defining pathologic features of which include tauopathy made of phosphorylated tau protein (P-tau). However, tauopathy has not been detected in the early stages after TBI, and how TBI leads to tauopathy is unknown. Here we find robust cis P-tau pathology after TBI in humans and mice. After TBI in mice and stress in vitro, neurons acutely produce cis P-tau, which disrupts axonal microtubule networks and mitochondrial transport, spreads to other neurons, and leads to apoptosis. This process, which we term 'cistauosis', appears long before other tauopathy. Treating TBI mice with cis antibody blocks cistauosis, prevents tauopathy development and spread, and restores many TBI-related structural and functional sequelae. Thus, cis P-tau is a major early driver of disease after TBI and leads to tauopathy in chronic traumatic encephalopathy and Alzheimer's disease. The cis antibody may be further developed to detect and treat TBI, and prevent progressive neurodegeneration after injury.


Figures

Extended Data Figure 1
Extended Data Figure 1. Characterization of cis and trans p-tau mAbs and robust cis p-tau in human CTE brains
a, b, Characterization of the specificity of cis and trans p-tau mAbs by ELISA. cis (a) and trans (b) antibodies at various concentrations were incubated with cis (pT231-Dmp), trans (pT231-Ala), cis+trans (pT231-Pro) or T231-Pro tau peptides, followed by detecting the binding by ELISA. Representative examples of ELISA are shown from 3 independent experiments. pT231-Pro, CKKVAVVRpT(Pro)PKSPSSAK; pT231-Pip, CKKVAVVRpT(homoproline)PKSPSSAK; pT231-Ala, KVAVVRpT(Alanine)PKSPS; pT231-Dmp (KVAVVRpT(5,5-dimethyl-L-proline)PKSPS). c, Determination of the isotypes of cis and trans p-tau mAbs. Isotypes of cis and trans mAb heavy and light chains were determined by ELISA assay using a commercially available assay kit. d, e, Characterization of the specificity of cis and trans p-tau mAbs by IB and IF. Brain lysates (d) or sections (e) prepared from tau-deficient (KO) or wild-type tau-overexpressing (TG) mice were subjected to IB or IF with cis and/or trans antibody. The cis and trans signals were readily detected in TG, but not at all in KO mouse brains, with cis in the soma and neurites (pink arrow), but trans only in the soma (yellow arrow) (insets). Similar results were observed in at least three different animals. cis, red; trans, green; DNA, blue. f-h. Robust cis p-tau in human CTE brains. 16 CTE brain tissues and 8 healthy controls were subjected to IF, with one representative image from each case being shown) (f, g). Yellow arrow points to a neuron expressing both cis (red) and trans (green) p-tau, while pink one to a neuron expressing only trans in the soma. Fluorescence immunostaining intensity of cis p-tau was quantified using Volocity 6.3 from Perkin Elmer (h). The results are expressed as means ± s.d. and p values determined using the Student's t test.
Extended Data Figure 2
Extended Data Figure 2. Colocalization of cis p-tau with other tau epitopes and its concentration near blood vessels in CTE brains
a, b, Colocalization of cis p-tau with other tau epitopes in CTE brains. CTE brain tissues and healthy controls were stained with cis mAb and AT180, AT8, AT100, Alz50 or T22 antibodies, or trans mAb and T22 antibodies, with two examples being shown (a), and then quantified their colocalization using Coloc 2, with the results being expressed in a percentage (mean ± s.d.) (b). N.D., not detectable. c, CTE brain tissues and healthy controls were stained with cis mAb, with two examples being shown. cis is more prominent near blood vessels, which corresponds to the typical perivascular distribution of p-tau in CTE. d, CTE brain tissues and healthy controls were stained with cis mAb (red) and the dendritic marker MAP2 (green), along with DNA dye (blue). Colors in the text correspond to their fluorescence labels. n=4.
Extended Data Figure 3
Extended Data Figure 3. TBI induces cis p-tau in a severity- and time-dependent manner long before other known tauopathy epitopes
a-c, Severity- and time-dependent induction of cis p-tau after TBI. Quantification results of Fig. 2a-f. d, Robust cis p-tau signals were detected in neurons 48 hr after rmTBI without any other tangle-related tau epitopes. 48 h after rmTBI, brain sections were stained with cis mAb (red) and AT8, AT100 or PHF1 (green). e, Robust cis p-tau signals were detected in neurons 48 hr after rmTBI without tau oligomerization, which appears and colocalizes with cis p-tau at 6 month after TBI. 48 h or 6 m after rmTBI or sham treatment, brain sections were immunostained with T22 (green) and cis or trans mAb (red). The results in 48 hr sham mice were similar to those at 6 m (data not shown). The colocalization of red and green signals was quantified using Coloc-2, with the results being shown in percentages. ND, not detectable. n=3-4. The results are expressed as means ± s.d. and p values determined using the Student's t test.
Extended Data Figure 4
Extended Data Figure 4. Stressed neurons robustly produces cis p-tau, cis p-tau is released from stressed neurons and neurotoxic, but are effectively blocked by cis, but trans, mAb
a-c, Quantification results of Fig. 4a, b and f, respectively. The results are expressed as means ± s.d. and p values determined using the two-way ANOVA test (a) and Student's t test (c). d, Hypoxia induces cis p-tau, which is blocked by cis mAb. SY5Y neurons expressing a control vector were cultured in the hypoxia chamber in the absence or presence of cis or trans mAb for the times indicated, followed by IB for cis p-tau. e, Hypoxia induces cis p-tau before tau aggregation. SY5Y neurons were subjected to hypoxia for the times indicated, followed by sarkosyl extraction before IB with Tau5 mAb and quantification. f, Hypoxia induces cell death, which are blocked by cis, but trans, mAb. SY5Y neurons were cultured in the hypoxia chamber in the absence or presence of cis or trans mAb for the times indicated, followed by live and dead cell assay using the LIVE/DEAD® Viability/Cytotoxicity Kit. g, Stressed neuron lysates are neurotoxic, which is neutralized by cis, but not trans, mAb. Cell lysates were prepared from stressed SY5Y neurons and then added to growing SY5Y neurons directly (Control) or after immunodepletion with cis or trans mAb to remove cis or trans p-tau, respectively for 3 days, followed by live and dead cell assay. h, cis p-tau is released from stressed neurons. SY5Y neurons were cultured in the absence of serum for the times indicated and culture media were collected and centrifuged, followed by analyzing the supernatants for cis and trans p-tau with actin as a indicator of cell lysis.
Extended Data Figure 5
Extended Data Figure 5. cis p-tau spreads after rmTBI or neuronal stress, and hypoxia induces cell death in primary neurons, which is blocked by cis mAb
a, cis p-tau spreads in the brain after rmTBI. Quantification results of Fig. 3c. b, cis p-tau spreads after neuronal stress. GFP-tau or RFP-tau SY5Y neurons were co-cultured and subjected to hypoxia or control treatment in the presence or absence of cis or trans mAb for different times, followed by assaying cells expressing both GFP-tau and RFP-tau (arrows) to determine tau spreading among cells. The results are expressed as means ± s.d. and p values determined using the Student's t test. c, cis mAb enters primary neurons. Primary neurons were established from mouse embryos and differentiated in vitro and cis mAb was added to culture media, followed by immunostaining with secondary antibodies. d, Hypoxia induces cell death in primary neurons, which is effectively blocked by cis mAb. Primary neurons were cultured in the hypoxia chamber in the absence or presence of cis mAb for 48 h, followed by live (green) and dead (red) cell assay using the LIVE/DEAD® Viability/Cytotoxicity Kit.
Extended Data Figure 6
Extended Data Figure 6. Pin1 inhibition by multiple mechanisms contributes to cis p-tau induction after neuron stress and TBI
a, Pin1 was downregulated and correlated with cis p-tau induction after serum starvation. Cells were subjected to serum starvation for times indicated, followed by IB, with the right panel showing the correlation of Pin1 down regulation with cis p-tau induction from Figure 4a. b, Pin1 was oxidized and correlated with cis p-tau induction after hypoxia. SY5Y cells were subjected to hypoxia for times indicated, followed by IB for C113 oxidized Pin1, with the right panel showing the correlation of Pin1 oxidization with cis p-tau induction from Extended Data Figure 6d. c, Pin1 is inhibited in TBI mouse brains. Mouse brains 48 hr after ssTBI were subjected to IB and quantification for Pin1 and S71 phosphorylated Pin1. d, Pin1 knockdown potentiates the ability of hypoxia to induce cis p-tau. Pin1 KD or vector control SY5Y cells were subjected to hypoxia treatment for the times indicated in the presence or absence of cis mAb, followed by IB and quantification for cis p-tau levels.
Extended Data Figure 7
Extended Data Figure 7. Inhibition of FcγR binding blocks cis mAb from entering neurons and TRIM21 KD fully prevented cis antibody from ablating cis p-tau in neurons
a-d, Inhibition of FcγR binding potently blocks cis mAb from entering neurons. cis mAb was added to neurons in the absence or presence of a human FcγR-binding inhibitor, followed by detecting the binding of cis mAb to the cell surface by FACS (a), entry of cis mAb into cells by IF (b), IB (c) and electron microscopy after immunogold labeling (d). The FcR binding inhibitor fully blocked cis mAb from binding to the cell surface and entering neurons. Electron microscopy showed that cis mAb bounds to the cell surface and endocytic vesicles (red arrows). e, f, TRIM21 knockdown fully prevented cis antibody from ablating cis p-tau in neurons. TRIM21 was stably knocked down in SY5Y neuronal cells using a validated TRIM21 shRNA lentiviral vector and confirmed by real-time RT-PCR analysis of TRIM21 mRNA expression (e). TRIM21 knockdown or vector control SY5Y cells were subjected to hypoxia treatment in the presence or absence of cis mAb and/or 3-Methyladenine, an autophagy inhibitor, followed by IB, followed by quantifying cis p-tau levels normalized actin levels (lower panel) (f).
Extended Data Figure 8
Extended Data Figure 8. cis pT231-tau is both necessary and sufficient for p-tau to induce neuronal cell death in vitro
a, SY5Y cells were co-transfected with non-tagged indicated constructs in the absence and presence of cis mAb followed by IB with quantification on the right panel. b, SY5Y cells were co-transfected with GFP-tau, or GFP-tauT231A and p25/Ckd5 in the absence and presence of cis or trans mAb followed by live-cell confocal video (see videos 5, 6). Red arrows point to GFP-tau or -mutant expressing cells.
Extended Data Figure 9
Extended Data Figure 9. cis mAb effectively blocks cis p-tau induction and spread, tau aggregation, and restores neuronal ultrastructures, apoptosis and defective LTP after TBI
a, Peripherally administrated cis and trans mAbs enter neurons in brains. 250 μg of biotinylated cis or trans mAb was injected i.p. or i.v. into B6 mice, followed by detecting the biotinylated cis mAb in brains 3 days later. b, c, cis mAb effectively blocks cis pT231-tau induction and apoptosis. ssTBI mice were randomly and blindly treated with cis mAb or IgG isotype control, i.c.v. 20 μg per mouse 15 min after injury, and then i.p. 200 μg every 4 days for 3 times, followed by subjecting brains to IB for cis p-tau (b) and PARP cleavage (c), with sham as controls. d-f, cis mAb effectively blocks cis pT231-tau induction and spread, tau aggregation and restores neuronal ultrastructures. ssTBI mice in (c) received additional i.p. 200 μg per mouse 3 day prior to injury. d, Quantification of IB in Fig. 5a. e, Quantification of IB in Fig. 5b. f, Quantification of EM images in Fig. 5c. n=3. The results are expressed as means ± s.d. and p values determined using the Student's t test. g, cis mAb treatment of ssTBI mice rescues defective long-term potentiation in the cortex. fEPSPs were recorded in the layer II/III by stimulating the vertical pathway (the layer V to II/III) in the cortex. Robust LTP was induced by 5 Hz theta-burst in the cortical slices of sham mice (n=15 slices, 9 mice), but was deficient in the cortex of IgG-treated TBI mice (n=9 slices, 5 mice). However, LTP magnitude was restored to the control level in cis mAb-treated TBI animals (n=9 slices, 5 mice). The representative recordings were presented. h, No significant effects of cis pT231 tau mAb treatment on Morris Water Maze performance. 8 weeks after ssTBI, mice underwent Morris Water Maze (MWM) testing consisting of 4 acquisition trials (hidden platform) daily for 4 days (4 runs/trial), a probe trial, followed by a 3 reversal trials (hidden platform) daily for 3 days. Compared to sham mice, injured mice demonstrated increased latency to find the hidden platform in acquisition and reversal trials (p<0.001). There was no difference in injured cis mAb mice compared to injured IgG treated mice in acquisition trials (p=0.5) or reversal trial (p=0.9). For probe trials, injured mice performed similarly to sham mice (p=0.7) and injured cis mAb treated mice performed similarly to injured IgG treated mice (p=0.2). n=4-7. The results are expressed as means ± s.e.m. and p values determined using the ANOVA test.
Extended Data Figure 10
Extended Data Figure 10. cis mAb treatment effectively restores risk-taking behavior and prevents tauopathy development and spread as well as brain atrophy after TBI
a-c, cis mAb treatment effectively restores risk-taking behavior 2 months after ssTBI. Video-tracking data of each of all mice shows that ssTBI mice treated with cis mAb (n=7) spent similar and very little time in the open arm compared to sham mice (n=4), but much less time than TBI mice treated with IgG2b (n=7) (a). cis mAb-treated ssTBI mice had similar performance to sham in traveling velocity, but IgG2b-treated ssTBI mice traveled a greater velocity in the open arm (b). All three groups traveled similar total distance (c). Results are expressed as mean ± S.E.M. and p values determined using the Student's t test. d-f, cis mAb treatment effectively prevents tauopathy development and spread as well as brain atrophy 6 months after ssTBI. ssTBI mice were treated with cis mAb or IgG control for 2 weeks or 6 months, with sham mice as controls, followed by IF with various tauopathy epitopes (d), with immunostaining fluorescence intensity in the cortex and hippocampus being quantified (e), or to NeuN immunostaining for determining the thickness of the cortex and white matter at 6 months after TBI (f). n=4.
Figure 1
Figure 1. Robust cis, but not trans, p-tau at diffuse axons in human CTE brains
a, b, cis (a) or trans (b) mAb were immobilized on a sensor chip CM5 for surface plasmon resonance and their binding to pT231- or T231-tau peptide at different concentrations were recorded by SRP sensorgrams. c-h, The frontal cortex of neuropathologically verified human CTE brains and normal controls were subjected to double IF with cis (red) or trans (green) mAbs (c-e), N=16 for CTE and 8 for controls, or with cis pT231 (red) and the axonal marker tau (green), along with DNA dye (blue) (f-h), N=4. Two typical cis p-tau immunostaining patterns are presented, with all cases being shown in Extended Data Fig 1f. Arrows, colocalization; Bars, 20 μm.
Figure 2
Figure 2. While mTBI has moderate and transient effect, rmTBI, ssTBI or blast TBI leads to robust and persistent cis p-tau induction notably in diffuse axons starting at 12-24 hr
a, b, Mice were subjected to single TBI by 54 g weight drop from varying heights, followed by IB (a) and IF (b) to detect cis and trans p-tau 48 h later. cis, red; trans, green; DNA, blue. c-e, Mice were subjected to single mTBI (c), ssTBI (d) or rmTBI (e), followed by IF to detect cis and trans p-tau at different times after last injury. N=4. f, Mice were subjected to blast-induced TBI, followed by IF to detect cis and trans p-tau at different times. N=3. g-i, ssTBI (g), rmTBI (h) and blast TBI (i) brain sections at 48 hr after last injury were subjected to double IF with cis pT231 (red) and axon marker neurofilament SMI312 (green) or dendrite marker MAP2 (green), along with DNA dye (blue). N=4; Arrows, colocalization; Bars, 20 μm. j, ssTBI or sham mice were subjected to EM analysis 48 h after injury to examine the structure of MTs (filled arrows) and MI (open arrows) at axons and dendrites.
Figure 3
Figure 3. cis p-tau spreads in the brain after rmTBI, and spreads and causes neurotoxicity after neuronal stress in vitro, which are fully blocked by cis, but not trans, mAb
a-c, 24 hr or 6 months after rmTBI, mouse brains were subjected to IF (a, b) and IB (c) to detect cis p-tau in different brain regions. N=4. d, e, Mouse brain lysates prepared from 6 month after rmTBI or sham controls were added to culture media of SY5Y neurons for 17 h directly or after immunodepletion with cis or trans mAb, followed by IF with cis and trans mAbs or Annexin V FACS. N=3. f, SY5Y neurons stably expressing GFP-tau or RFP-tau were co-cultured and then treated with hypoxia or control in the presence or absence of cis or trans mAb for different times, followed by assaying cells expressing both GFP-tau and RFP-tau (mean ± S.D.). p values, two-way ANOVA test. g, h, Primary mouse neurons were transfected with GFP-tau or RFP-tau, and then subjected to hypoxia treatment in the absence or presence of cis or trans mAb for 36 hours. Resulting filtered soluble media from GFP-expressing neurons were added to RFP-expressing neurons (g) or vice versa (h), followed by detecting entry of added tau.
Figure 4
Figure 4. Stressed neurons robustly produce cis p-tau leading to cistauosis, which is blocked by cis mAb, but enhanced by trans mAb
a, SY5Y cells were cultured without serum for different times in the absence and presence of cis or trans mAb, followed by IB for cis and trans p-tau. b, SY5Y and differentiated PC12 cells were treated with hypoxia in the absence and presence of cis or trans mAb for 48h, followed by staining for MTs. c, Differentiated PC12 cells were treated with hypoxia in the absence and presence of cis or trans mAb for 48 h, followed by live-cell microscopy to capture fast and slow transport of MI along neurites. d-g, SY5Y cells were cultured without serum for different times in the absence and presence of cis or trans mAb, followed by live/dead cell assay (d, e) and apoptosis assays using PARP cleavage (f) and Annexin V (g). h, i, SY5Y cells were co-transfected with GFP-tau or -tauT231A and p25/Cdk5, followed by live-cell imaging to observe cell death of GFP-tau expressing cells over 65 h (h), with quantification being shown (i) (mean ± S.D.). p values, ANOVA test.
Figure 5
Figure 5. Treating ssTBI mice with cis mAb blocks early cistauosis, prevents tauopathy development and spread, and improves histopathological and functional outcomes
a, b, ssTBI mice were treated with cis mAb or control IgG for times indicated, along sham mice as controls, followed by IB to detect cis p-tau (a), and sarcosyl extraction to detect tau aggregation (b). N=4. c, d, After 2 week treatment, ssTBI mice were subjected to EM for axonal structures of MTs (yellow arrows) and MIs (red arrows) (c) or cortical fSPSP recording (d) (mean ± S.E.M.). Black arrow, theta-burst application; n=15 slices from 9 sham; n=9 slices from 5 IgG or cis mAb mice . p values, one-way ANOVA with Bonferroni posthoc test. e, f, after 2 month treatment, ssTBI mice were subjected to the elevated plus maze (e) and time spent in three arms was measured (f) (mean ± S.E.M.). n=4 for sham; n=7 for IgG or cis mAb. p values, Student's t test. g, h, After 2 week or 6 month treatment, ssTBI mice were subjected to IF with tauopathy mAbs (g), with quantification in the hippocampus being shown (h) (means ± s.d.). n=4. i, After 6 month treatment, ssTBI mice were immunostained with NeuN before determining brain thickness. n=4. j, Unlike single mTBI, rmTBI or ssTBI causes robust and persistent cis p-tau induction within 12-24 hr post-injury, which induces cistauosis, long before commonly known tauopathy and brain atrophy, hallmarks of CTE and AD. cis mAb not only blocks early cistauosis, but also prevents long-term neurodegeneration after TBI.

Comment in

Similar articles

Cited by

References

    1. Faul M, Xu L, Wald MM, Coronado VG. Traumatic brain injury in the United States: emergency department visits, hospitalizations, and deaths, 2002–2006. Centers for Disease Control and Prevention [online]; 2010. http://www.cdc.gov/traumaticbraininjury/tbi_ed.html.
    1. Centers for Disease Control and Prevention CDC grand rounds: reducing severe traumatic brain injury in the United States. MMWR Morb Mortal Wkly Rep. 2013;62:549–552. http://www.cdc.gov/mmwr/preview/mmwrhtml/mm6227a6222.htm. - PMC - PubMed
    1. Tanielian T, et al. Invisible Wounds of War: Psychological and Cognitive Injuries, Their Consequences, and Services to Assist Recovery. RAND Corporation; Santa Monica, CA: 2008. 2008, http://www.rand.org/pubs/monographs/MG720.
    1. Omalu BI, et al. Chronic traumatic encephalopathy in a National Football League player. Neurosurgery. 2005;57:128–134. - PubMed
    1. Goldstein LE, et al. Chronic traumatic encephalopathy in blast-exposed military veterans and a blast neurotrauma mouse model. Sci Transl Med. 2012;4:134ra160. - PMC - PubMed

Publication types

MeSH terms