. 2015 Jul 30;523(7562):588-91.
doi: 10.1038/nature14659. Epub 2015 Jul 15.

Sparse whole-genome sequencing identifies two loci for major depressive disorder

Collaborators

Sparse whole-genome sequencing identifies two loci for major depressive disorder

CONVERGE consortium. Nature. .

Erratum in

Abstract

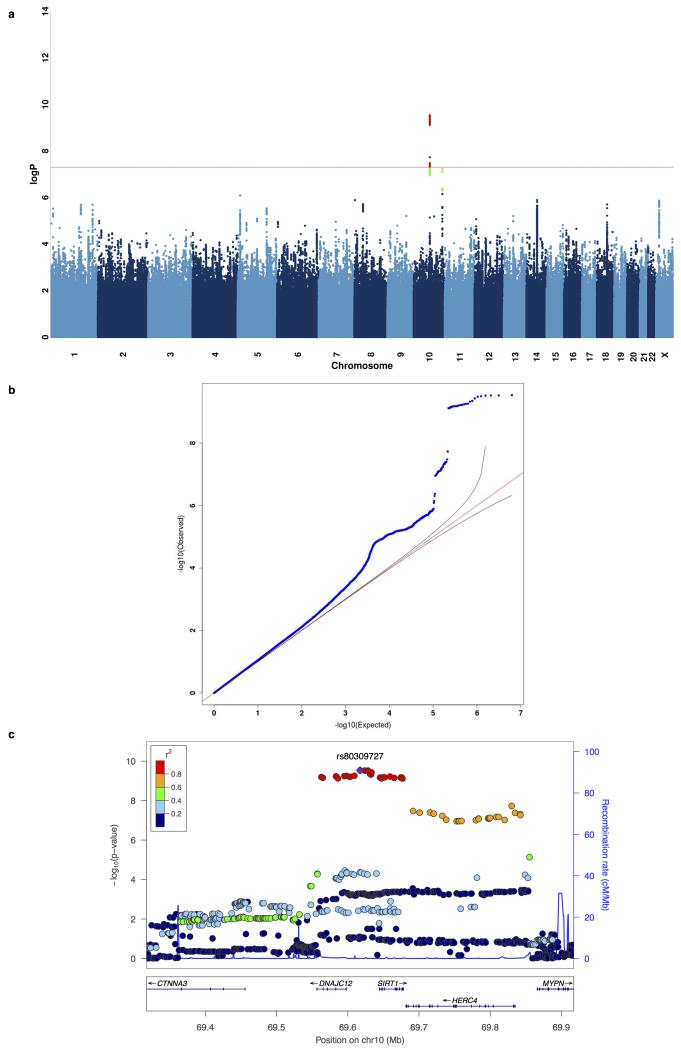
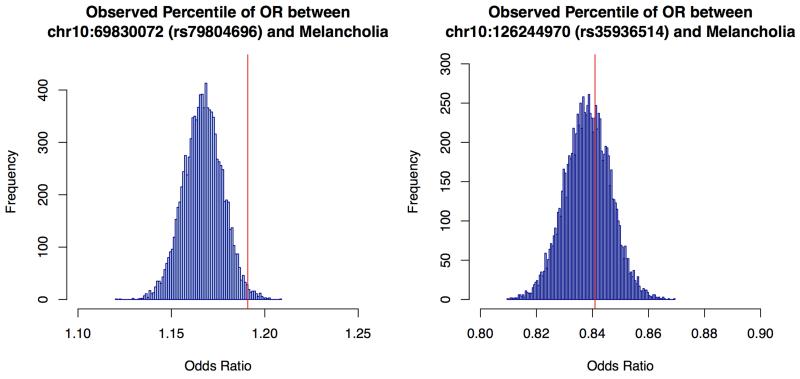
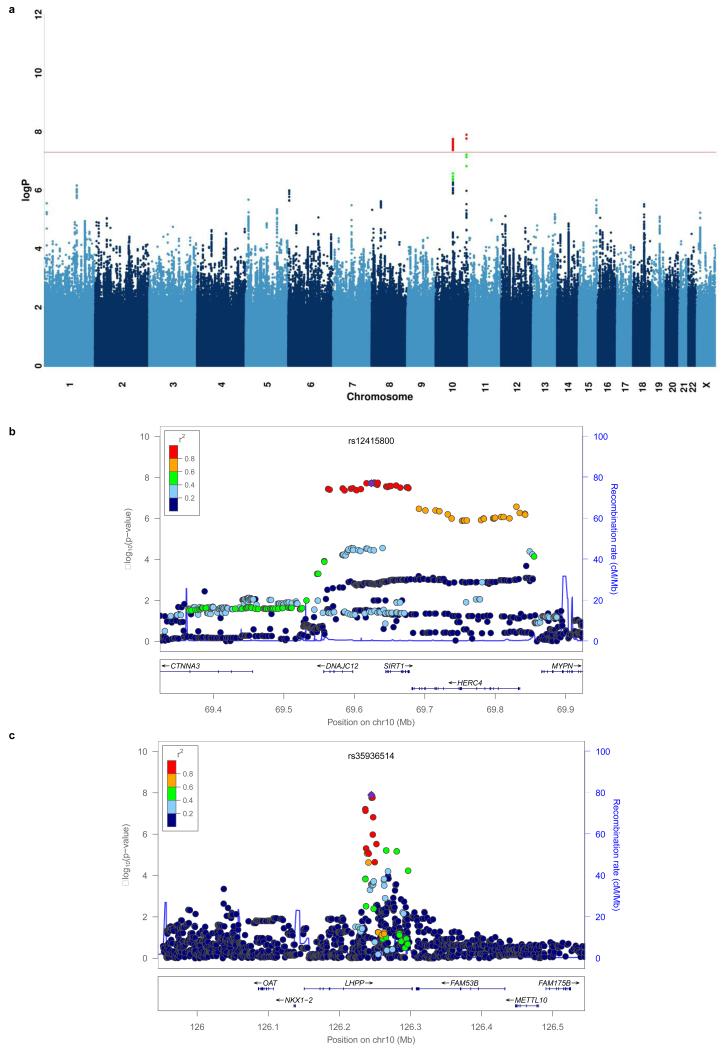
Major depressive disorder (MDD), one of the most frequently encountered forms of mental illness and a leading cause of disability worldwide, poses a major challenge to genetic analysis. To date, no robustly replicated genetic loci have been identified, despite analysis of more than 9,000 cases. Here, using low-coverage whole-genome sequencing of 5,303 Chinese women with recurrent MDD selected to reduce phenotypic heterogeneity, and 5,337 controls screened to exclude MDD, we identified, and subsequently replicated in an independent sample, two loci contributing to risk of MDD on chromosome 10: one near the SIRT1 gene (P = 2.53 × 10(-10)), the other in an intron of the LHPP gene (P = 6.45 × 10(-12)). Analysis of 4,509 cases with a severe subtype of MDD, melancholia, yielded an increased genetic signal at the SIRT1 locus. We attribute our success to the recruitment of relatively homogeneous cases with severe illness.


Figures

<b>Extended Data Figure 1</b>:
Extended Data Figure 1:
Quantile quantile plots for major depressive disorder. Quantile-quantile plot of GWAS for MDD using the Mixed-Linear-Model with exclusion of chromosome marker is on (MLMe) method implemented in FastLMM on 10,640 samples (5,303 cases, 5,337 controls), genomic inflation factor lambda (λ) = 1.070, rescaled for an equivalent study of 1,000 cases and 1,000 controls (λ1000) = 1.013.
<b>Extended Data Figure 2</b>:
Extended Data Figure 2:
Forest plots of estimated SNP effects in CONVERGE and PGCMDD1 studies. This figure presents the association odds ratios (OR) at 12 SNPs in CONVERGE and the best available proxy SNPs in PGC MDD (pairwise R2 >0.6, 500kb window; the proxy SNP is marked by “*”). We present the alternative allele frequency (freq), odds ratio (or) with respect to the alternative allele, standard error of odds ratio (se) and P values of association (pval) for the following analyses (study): primary association analysis with a linear-mixed model using imputed allele dosages in 10,640 samples in CONVERGE (pri); validation analysis with logistic regression model with PCs as covariates using genotypes from Sequenom on 9,921 samples in CONVERGE (sqnm); association with MDD with a logistic regression model in replication cohort of 6,417 samples using genotypes from Sequenom (repli); joint association analysis with MDD with a logistic regression model using imputed allele dosages in CONVERGE and genotypes from Sequenom in replication cohort (17,057 samples in total, joint).
<b>Extended Data Figure 3</b>:
Extended Data Figure 3:
Manhattan and quantile quantile plots for melancholia. (a) Manhattan plot of GWAS for melancholia using the Mixed-Linear-Model with exclusion of chromosome marker is on (MLMe) method implemented in FastLMM on 9,846 samples (4,509 cases, 5,337 controls). (b) Quantile-quantile plot of GWAS for melancholia, genomic inflation factor lambda (λ) = 1.069, rescaled for an equivalent study of 1,000 cases and 1,000 controls (λ1000) = 1.014. (c) Regional association plot on GWAS hit on chromosome 10 focusing on top SNP rs80309727 at 5′ of SIRT1 gene, generated with LocusZoom.
<b>Extended Data Figure 4</b>:
Extended Data Figure 4:
Empirical estimation of the odds ratio increases due to the removal of cases not falling under the diagnostic class of melancholia from an association analysis with major depression. The figures show the empirical distributions of the odds ratios for association with each of two SNPs (rs79804696, rs35936514), after removing a random set of 796 samples, equal to the number of cases of MDD not diagnosed as being melancholic. The horizontal axis is the odds ratio for each analysis, and the vertical axis the frequency of occurrence of the odds ratio in 10,000 analyses. The vertical red line is the observed odds ratio after removing cases of MDD not diagnosed as melancholic.
Figure 1
Figure 1
Two loci associated with MDD in the CONVERGE sample (a) Manhattan plot of genome wide association for MDD, (b) association at the SIRT1 region on chromosome 10 at 69.6 Mb and (c) the LHPP gene on chromosome 10 at position 126.2 Mb. The −log10 P-values of imputed SNPs associated with MDD are shown on the left y axis. The recombination rates (NCBI Build GRCh37), (light-blue lines), are shown on the right y axis. Position in megabases (Mb) is on the x axis. Linkage disequilibrium of each SNP with top SNP, shown in large purple diamond, is indicated by its colour. The plots were drawn using LocusZoom.

Comment in

References

    1. Kessler RC, Bromet EJ. The epidemiology of depression across cultures. Annual review of public health. 2013;34:119–138. - PMC - PubMed
    1. Flint J, Kendler KS. The genetics of major depression. Neuron. 2014;81:484–503. - PMC - PubMed
    1. Major Depressive Disorder Working Group of the Psychiatric, G. C. et al. A mega-analysis of genome-wide association studies for major depressive disorder. Mol Psychiatry. 2013;18:497–511. - PMC - PubMed
    1. Foley DL, et al. Genetic and environmental risk factors for depression assessed by subject-rated symptom check list versus structured clinical interview. Psychol Med. 2001;31:1413–1423. - PubMed
    1. Kendler KS, et al. Clinical indices of familial depression in the Swedish Twin Registry. Acta Psychiatrica Scandinavica. 2007;115:214–220. - PubMed

Publication types

Substances