Effects of Climate Change on Exposure to Coastal Flooding in Latin America and the Caribbean
- PMID: 26177285
- PMCID: PMC4503776
- DOI: 10.1371/journal.pone.0133409
Effects of Climate Change on Exposure to Coastal Flooding in Latin America and the Caribbean
Abstract
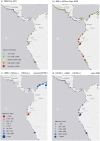
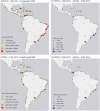
This study considers and compares several of the most important factors contributing to coastal flooding in Latin American and the Caribbean (LAC) while accounting for the variations of these factors with location and time. The study assesses the populations, the land areas and the built capital exposed at present and at the middle and end of the 21st century for a set of scenarios that include both climatic and non-climatic drivers. Climatic drivers include global mean sea level, natural modes of climate variability such as El Niño, natural subsidence, and extreme sea levels resulting from the combination of projected local sea-level rise, storm surges and wave setup. Population is the only human-related driver accounted for in the future. Without adaptation, more than 4 million inhabitants will be exposed to flooding from relative sea-level rise by the end of the century, assuming the 8.5 W m-2 trajectory of the Representative Concentration Pathways (RCPs), or RCP8.5. However, the contributions from El Niño events substantially raise the threat in several Pacific-coast countries of the region and sooner than previously anticipated. At the tropical Pacific coastlines, the exposure by the mid-century for an event similar to El Niño 1998 would be comparable to that of the RCP4.5 relative sea-level rise by the end of the century. Furthermore, more than 7.5 million inhabitants, 42,600 km2 and built capital valued at 334 billion USD are currently situated at elevations below the 100-year extreme sea level. With sea levels rising and the population increasing, it is estimated that more than 9 million inhabitants will be exposed by the end of the century for either of the RCPs considered. The spatial distribution of exposure and the comparison of scenarios and timeframes can serve as a guide in future adaptation and risk reduction policies in the region.
Conflict of interest statement
Figures


References
-
- Kelman I, Gaillard JC, Mercer J. Climate Change’s Role in Disaster Risk Reduction’s Future: Beyond Vulnerability and Resilience. International Journal of Disaster Risk Science. 2015, Volume 6, Issue 1, pp 21–27 10.1007/s13753-015-0038-5 - DOI
-
- Gitay H, Bettencourt S, Kull D, Reid R, McCall K, Simpson A. et al. Main report Vol. 1 of Building resilience: integrating climate and disaster risk into development—the World Bank Group experience. Washington DC; World Bank; 2013.
-
- UNFPA, United Nations Fund for Population Activities. Linkages Between Population Dynamics, Urbanization Processes and Disaster Risks: A Regional Vision of Latin America. UN-HABITAT, ISDR, UNFPA, New York: 2012.
-
- Jongman B, Ward PJ, Aerts JCJH. Global exposure to river and coastal flooding: Long term trends and changes. Global Environmental Change. 2012, 22: 823–835 10.1016/j.gloenvcha.2012.07.004 - DOI
-
- Nicholls RJ. Coastal flooding and wetland loss in the 21st century: changes under the SRES climate and socio-economic scenarios. Global Environmental Change. 2004, 14, 69–86. 10.1016/j.gloenvcha.2003.10.007 - DOI
MeSH terms
LinkOut - more resources
Full Text Sources
Other Literature Sources
Medical

