

CD26 Expression on T Helper Populations and sCD26 Serum Levels in Patients with Rheumatoid Arthritis
- PMID: 26177310
- PMCID: PMC4503416
- DOI: 10.1371/journal.pone.0131992
CD26 Expression on T Helper Populations and sCD26 Serum Levels in Patients with Rheumatoid Arthritis
Erratum in
-
Correction: CD26 Expression on T Helper Populations and sCD26 Serum Levels in Patients with Rheumatoid Arthritis.PLoS One. 2015 Sep 28;10(9):e0139535. doi: 10.1371/journal.pone.0139535. eCollection 2015. PLoS One. 2015. PMID: 26413798 Free PMC article. No abstract available.
Abstract
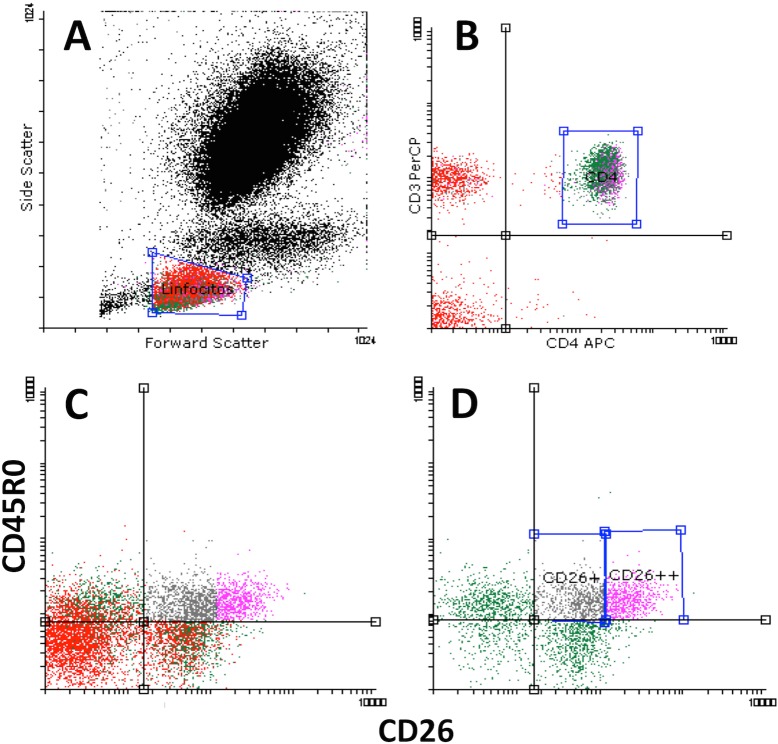
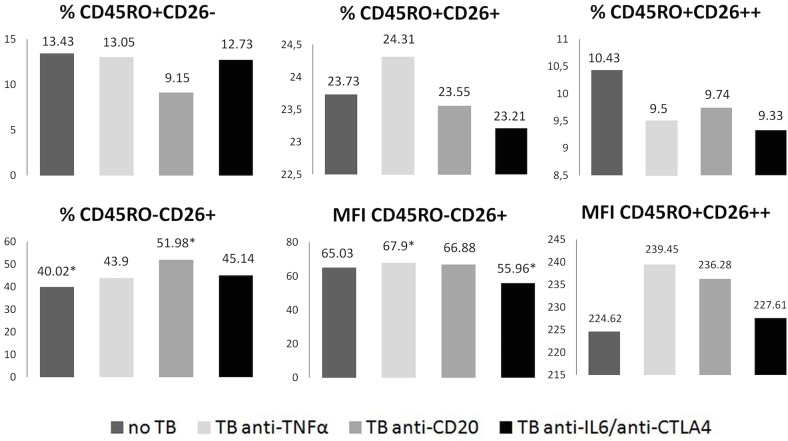
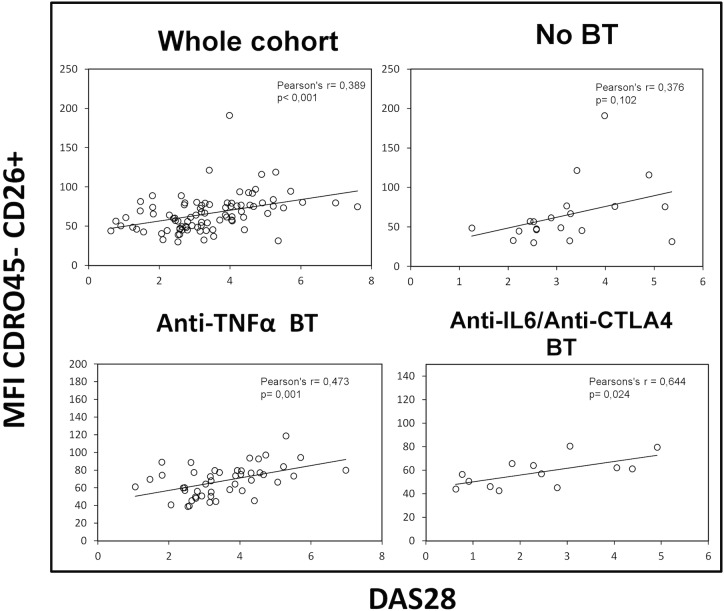
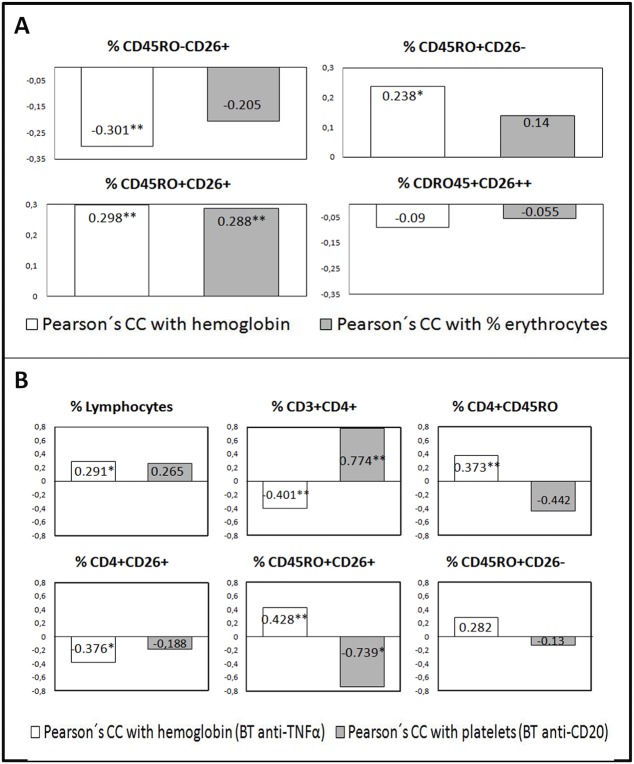
We studied dipeptidyl peptidase IV (DPP-IV, CD26) expression in different T helper cells and serum soluble DPP-IV/sCD26 levels in rheumatoid arthritis (RA) patients, correlated these with disease activity score (DAS), and examined how they were affected by different therapies, conventional or biological (anti-TNF, anti-CD20 and anti-IL6R or Ig-CTLA4). The percentage of CD4+CD45R0+CD26- cells was greatly reduced in patients (up to 50%) when compared with healthy subjects. Three other subsets of CD4 cells, including a CD26high Th1-associated population, changed variably with therapies. Data from these subsets (frequency and staining density) significantly correlated with DAS28 or DAS28 components but different in each group of patients undergoing the different therapies. Th17 and Th22 subsets were implicated in RA as independent CCR4+ and CCR4- populations each, with distinct CD26 expression, and were targeted with varying efficiency by each therapy. Serum DPP-IV activity rather than sCD26 levels was lower in RA patients compared to healthy donors. DPP-IV and sCD26 serum levels were found related to specific T cell subsets but not to disease activity. We conclude that, according to their CD26 expression, different cell subsets could serve to monitor RA course, and an uncharacterized T helper CD26- subset, not targeted by therapies, should be monitored for early diagnosis.
Conflict of interest statement
Figures
Similar articles
-
Distinctive CD26 Expression on CD4 T-Cell Subsets.Biomolecules. 2021 Oct 2;11(10):1446. doi: 10.3390/biom11101446. Biomolecules. 2021. PMID: 34680079 Free PMC article.
-
CD26/dipeptidyl peptidase IV: a comparative study of healthy persons and kidney transplant recipients before and early after transplantation.Clin Biochem. 2013 Oct;46(15):1383-8. doi: 10.1016/j.clinbiochem.2013.04.006. Epub 2013 Apr 19. Clin Biochem. 2013. PMID: 23608353
-
In active chronic rheumatoid arthritis, dipeptidyl peptidase IV density is increased on monocytes and CD4(+) T lymphocytes.Scand J Immunol. 2007 Oct;66(4):451-7. doi: 10.1111/j.1365-3083.2007.01966.x. Scand J Immunol. 2007. PMID: 17850590
-
On the origin of serum CD26 and its altered concentration in cancer patients.Cancer Immunol Immunother. 2009 Nov;58(11):1723-47. doi: 10.1007/s00262-009-0728-1. Epub 2009 Jun 26. Cancer Immunol Immunother. 2009. PMID: 19557413 Free PMC article. Review.
-
Soluble CD26: From Suggested Biomarker for Cancer Diagnosis to Plausible Marker for Dynamic Monitoring of Immunotherapy.Cancers (Basel). 2024 Jun 30;16(13):2427. doi: 10.3390/cancers16132427. Cancers (Basel). 2024. PMID: 39001488 Free PMC article. Review.
Cited by
-
Evaluation of Blood Soluble CD26 as a Complementary Biomarker for Colorectal Cancer Screening Programs.Cancers (Basel). 2022 Sep 20;14(19):4563. doi: 10.3390/cancers14194563. Cancers (Basel). 2022. PMID: 36230486 Free PMC article.
-
Decreased circulating dipeptidyl peptidase-4 enzyme activity is prognostic for severe outcomes in COVID-19 inpatients.Biomark Med. 2022 Apr;16(5):317-330. doi: 10.2217/bmm-2021-0717. Epub 2022 Feb 23. Biomark Med. 2022. PMID: 35195023 Free PMC article.
-
CD26-Related Serum Biomarkers: sCD26 Protein, DPP4 Activity, and Anti-CD26 Isotype Levels in a Colorectal Cancer-Screening Context.Dis Markers. 2020 Jan 21;2020:4347936. doi: 10.1155/2020/4347936. eCollection 2020. Dis Markers. 2020. PMID: 32051696 Free PMC article.
-
DPP4-inhibition reduces pro-inflammatory cytokine production by alpha-beta and gamma-delta T cells in vitro and in the biliary atresia mouse model.Sci Rep. 2025 Aug 18;15(1):30226. doi: 10.1038/s41598-025-16097-z. Sci Rep. 2025. PMID: 40825831 Free PMC article.
-
The Serine Protease CD26/DPP4 in Non-Transformed and Malignant T Cells.Cancers (Basel). 2021 Nov 26;13(23):5947. doi: 10.3390/cancers13235947. Cancers (Basel). 2021. PMID: 34885056 Free PMC article. Review.
References
-
- Gerlag DM, Raza K, van Baarsen LG, Brouwer E, Buckley CD, Burmester GR, et al. EULAR recommendations for terminology and research in individuals at risk of rheumatoid arthritis: report from the Study Group for Risk Factors for Rheumatoid Arthritis. Ann Rheum Dis 2012;71:638–41. 10.1136/annrheumdis-2011-200990 - DOI - PMC - PubMed
-
- Hagihara M, Ohhashi M, Nagatsu T. Activities of dipeptidyl peptidase II and dipeptidyl peptidase IV in mice with lupus erythematosus-like syndrome and in patients with lupus erythematosus and rheumatoid arthritis. Clin Chem 1987;33:1463–5. - PubMed
-
- Gotoh H, Hagihara M, Nagatsu T, Iwata H, Miura T. Activities of dipeptidyl peptidase ii and dipeptidyl peptidase iv in synovial fluid from patients with rheumatoid arthritis and osteoarthritis. Clin Chem 1989;35: 1016–8. - PubMed
Publication types
MeSH terms
Substances
LinkOut - more resources
Full Text Sources
Other Literature Sources
Medical
Research Materials
Miscellaneous
