. 2015 Jul 15;10(7):e0132767.
doi: 10.1371/journal.pone.0132767. eCollection 2015.

miR-34 and p53: New Insights into a Complex Functional Relationship

Affiliations

miR-34 and p53: New Insights into a Complex Functional Relationship

Francisco Navarro et al. PLoS One. .

Abstract

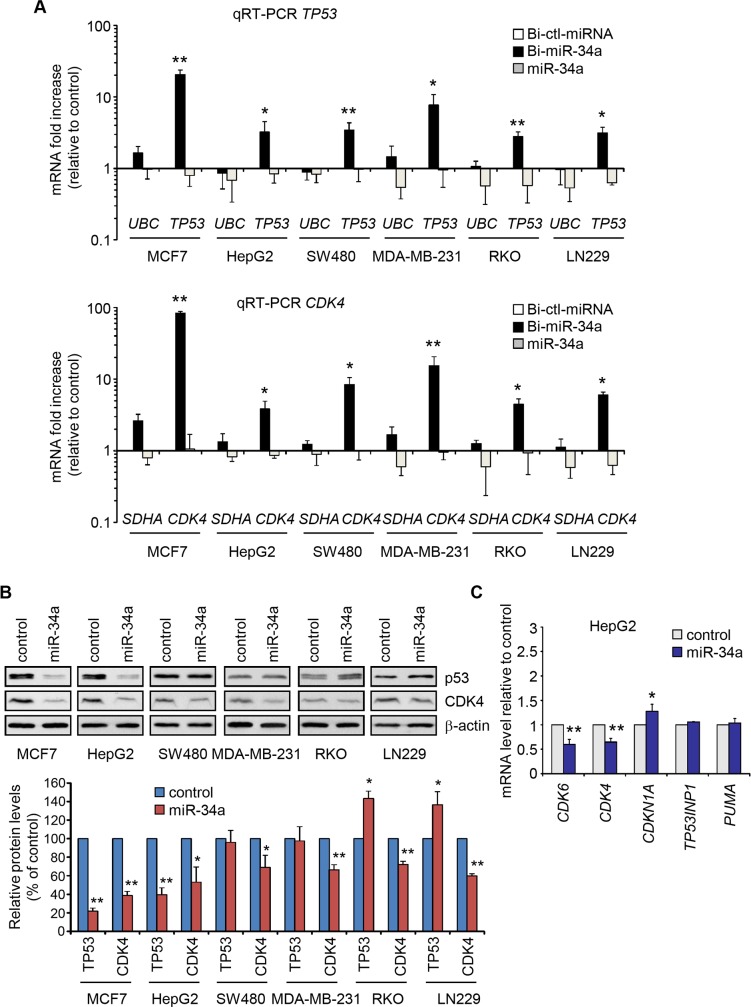
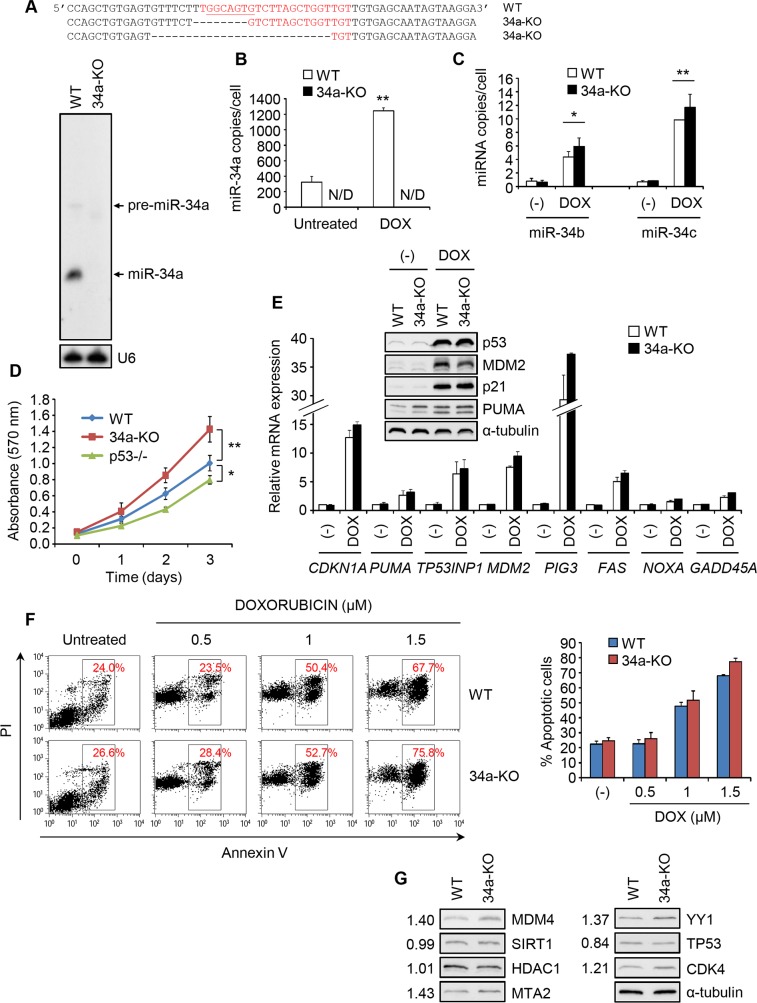
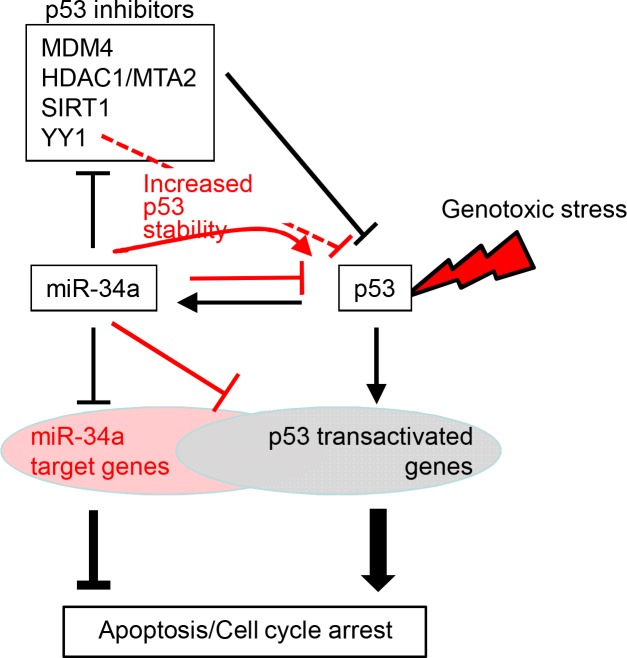
miR-34, a tumor suppressor miRNA family transcriptionally activated by p53, is considered a critical mediator of p53 function. However, knockout of the mouse miR-34 family has little or no effect on the p53 response. The relative contribution of different miR-34 family members to p53 function or how much p53 relies on miR-34 in human cells is unclear. Here we show that miR-34a has a complex effect on the p53 response in human cells. In HCT116 cells miR-34a overexpression enhances p53 transcriptional activity, but the closely related family members, miR-34b and miR-34c, even when over-expressed, have little effect. Both TP53 itself and MDM4, a strong p53 transactivation inhibitor, are direct targets of miR-34a. The genes regulated by miR-34a also include four other post-translational inhibitors of p53. miR-34a overexpression leads to variable effects on p53 levels in p53-sufficient human cancer cell lines. In HCT116, miR-34a overexpression increases p53 protein levels and stability. About a quarter of all mRNAs that participate in the human p53 network bind to biotinylated miR-34a, suggesting that many are direct miR-34a targets. However, only about a fifth of the mRNAs that bind to miR-34a also bind to miR-34b or miR-34c. Two human cell lines knocked out for miR-34a have unimpaired p53-mediated responses to genotoxic stress, like mouse cells. The complex positive and negative effects of miR-34 on the p53 network suggest that rather than simply promoting the p53 response, miR-34a might act at a systems level to stabilize the robustness of the p53 response to genotoxic stress.


Conflict of interest statement

Competing Interests: The authors have declared that no competing interests exist.

Figures

Fig 1
Fig 1. Overexpression of miR-34a, but not miR-34b/c, enhances p53 transcription in HCT116 cells.
(A) qRT-PCR analysis of mRNA levels of p53 transcriptional targets, normalized to GAPDH, in miR-34a or cel-miR-67 (control) overexpressing WT and TP53 -/- HCT116 cells. (B) Immunoblot showing protein levels of some p53 transcriptional targets. (C) Effect of miR-34 OE on Firefly luciferase reporters driven by the promoters of the p53 targets PUMA, CDKN1A and BAX or a tandem repeat of 13 p53 binding consensus sites (pG13-luc). Normalized Firefly luciferase activity, relative to Renilla luciferase activity, after miR-34 transfection is plotted as fold change relative to control miRNA-transfected sample. Alignment of the miR-34 family with the seed sequence highlighted in red is shown at top. (D) qRT-PCR analysis of p53 transcriptional target mRNAs after transfecting control or miR-34 mimics into HCT116 cells. Bar graphs show mean +/- SD of at least three independent experiments (*, p<0.05; **, p<0.01, relative to control miRNA-transfected cells, 2-tailed Student’s t-test).
Fig 2
Fig 2. Genome-wide transcriptome analysis of miR-34 OE HCT116 cells.
(A) Overlap of genes down-regulated ≥ 1.5 fold in miR-34 OE HCT116 cells compared to control-transfected cells. (B-D) Top enriched biological processes (p<0.05) of all down-regulated genes in miR-34 overexpressing HCT116 cells, as determined using the DAVID tool. A complete list of significantly enriched biological processes is provided in S2 Table.
Fig 3
Fig 3. Overexpression of miR-34a-resistant SIRT1 or MDM4 does not inhibit miR-34a-mediated p53 transcriptional activation.
(A-C) Overexpression of miR-34a resistant SIRT1 (lacking its 3’UTR, immunoblot (B)) does not reduce the miR-34a-mediated increase in the activity of a luciferase reporter driven by a promoter containing 13 p53 consensus binding sites (pG13-luc) (A) or the miR-34a-mediated increase in mRNA of the p53 transcriptional targets CDKN1A, PUMA and TP53INP1, as measured by qRT-PCR (C). (D-F) Same analysis as in (A-C) performed after co-transfecting an HA-tagged MDM4 gene with no 3’UTR and containing synonymous mutations of the miR-34a CDS MREs. All graphs show the mean +/- STDEV of at least three independent experiments (*, p<0.05; **, p<0.01, relative to control miRNA-transfected cells, by 2-tailed Student’s t-test).
Fig 4
Fig 4. TP53 is a direct miR-34a target.
(A) TP53 mRNA is enriched in Bi-miR-34a PDs in HCT116 cells. mRNA levels were determined by qRT-PCR and plotted as fold change relative to mRNAs pulled down with the Bi-control miRNA (Bi-ctl-miRNA). The housekeeping genes UBC and SDHA were used as negative controls. An additional control was PD of unbiotinylated miR-34a. (B) miR-34a does not affect the activity of a luciferase reporter containing the full length 3’UTR of TP53. A reporter containing the 3’UTR of MYB was used as positive control. Luciferase activity is relative to cells transfected with the control miRNA. (C) Pairing of miR-34a to predicted TP53 MREs. The miR-34a seed region is highlighted in blue, while mutations (mt) introduced in the MREs are highlighted in red. Black dashes indicate Watson-Crick base pairing and red dashes G:U base pairing. The numbers in parentheses indicate the position of the MRE in the mRNA. (D) miR-34a recognition of predicted wild-type (wt) or mutant (mt) TP53 miR-34a MREs cloned into the 3’UTR of Renilla luciferase were assessed in dual luciferase reporter assays in cells transfected with miR-34a relative to cells transfected with control miRNA. (E,F) The function of predicted TP53 miR-34a MREs (wt or mt) in their native location in full length TP53 mRNA was assessed in TP53 -/- HCT116 cells cotransfected with control miRNA or miR-34a mimics and wt or mt p53 cDNA. p53 protein was analyzed by p53 vs β-actin immunoblot 48 hr later. A representative blot is shown in (E) and densitometry of p53 relative to β-actin signal in 3 independent experiments in cells transfected with miR-34a relative to cells transfected with control miRNA is shown in (F). (G) miR-34a over-expression in p53-proficient HCT116 cells increases p53 protein. WT HCT116 cells were transfected with control or miR-34a mimics and protein levels were analyzed by immunoblot 48 hr post-transfection. CDK6 and β-actin immunoblots are shown as controls. (H) qRT-PCR analysis of CDK6, TP53 and CDKN1A mRNA in samples from (G). Levels are normalized to expression in control (ctl) miRNA-transfected cells. (I) miR-34a overexpression in HCT116 cells increases p53 protein stability. Pulse-chase analysis of p53 protein in HCT116 cells transfected with control or miR-34a mimics. DOX-treated HCT116 cells are a positive control. All graphs show the mean +/- STDEV of at least three independent experiments (*, p<0.05; **, p<0.01, relative to control miRNA-transfected cells, 2-tailed Student’s t-test). Immunoblots are representative of at least 3 independent experiments.
Fig 5
Fig 5. miR-34a overexpression differentially affects p53 levels in p53-sufficient cancer cell lines.
(A) qRT-PCR analysis of the enrichment of TP53 (top) and CDK4 (bottom) mRNAs in Bi-miR-34a PDs in tumor cell lines of different origin. PD mRNA levels were plotted as fold change relative to mRNAs pulled down with the control Bi-miRNA (Bi-ctl-miRNA). The housekeeping genes UBC and SDHA served as negative controls. (B) Immunoblot of p53 and CDK4 in cells transfected with control or miR-34a mimics relative to β-actin (top). Protein levels were quantified by densitometry and the relative ratio of protein/β-actin was normalized to the value in cells transfected with control miRNA (bottom). (C) qRT-PCR analysis of p53 transcriptional target CDKN1A, TP53INP1 and PUMA mRNAs after transfecting control or miR-34a mimics in HepG2 cells. mRNA levels of the miR-34a targets CDK4 and CDK6 are shown as controls. All experiments were performed at least 3 times and the graphs show mean +/- STDEV of replicate experiments (*, p<0.05; **, p<0.01, relative to control miRNA-transfected cells, 2-tailed Student’s t-test).
Fig 6
Fig 6. miR-34a-KO HCT116 cells have a normal p53 response to genotoxic stress.
(A) Sequence of the miR-34a region in chromosome 1 in miR-34a-KO HCT116 cells compared to wild-type (WT) cells. The mature miR-34a sequence is in red, with the seed sequence underlined. The bottom panel shows the Northern blot for miR-34a in WT and 34a-KO HCT116 cells. U6 is a loading control. (B) miR-34a levels by qRT-PCR in WT or 34a-KO cells, untreated or DOX-treated for 16 hr. N/D, non-detectable. (C) Induction of miR-34b and miR-34c in WT and 34a-KO HCT116 cells after DOX treatment. Cells were treated with DOX as in (B). miR-34b/c levels were analyzed by qRT-PCR. (D) Proliferation of WT, p53-KO and 34a-KO cells by MTT cell proliferation assay. (E) qRT-PCR analysis of mRNA levels of p53 transcriptional targets in WT or 34a-KO HCT116 cells treated or not with DOX for 16 hr, relative to the untreated WT sample. The inset shows a representative immunoblot for p53 and some p53 transcriptional targets. α-tubulin is a loading control. (F) Apoptosis, assessed by annexin V/PI staining, in untreated or DOX-treated (48 hr) WT or 34a-KO HCT116 cells (DOX fluorescence in the PI channel increases “PI staining” in non-apoptotic cells). Representative dot plots are at left and the mean +/- STDEV of 3 independent experiments is at right. (G) Immunoblot of miR-34a target proteins in WT and 34a-KO HCT116 cells. The numbers on the left indicate the average signal intensity, normalized to the loading control, in 34a-KO/WT cells from 3 independent experiments. All experiments were performed at least 3 times and the graphs show the mean +/- STDEV from replicate experiments (*, p<0.05; **, p<0.01, relative to WT cells, 2-tailed Student’s t-test).
Fig 7
Fig 7. Unimpaired p53 response in miR-34a-KO MCF7 cells.
(A) Sequence of the miR-34a region in chromosome 1 in miR-34a-KO MCF7 cells compared to WT cells. The mature miR-34a sequence is in red, with the seed sequence underlined. The bottom panel shows the Northern blot for miR-34a in WT and 34a-KO MCF7 cells. U6 is a loading control. (B) qRT-PCR analysis of mRNA levels of p53 transcriptional targets in WT or 34a-KO MCF7 cells treated or not with DOX for 16 hr. The data are plotted as the fold change normalized to the untreated WT sample. (C) Immunoblot of miR-34a target proteins in WT and 34a-KO MCF7 cells. The numbers on the left indicate the average relative signal intensity, normalized to the loading control, in 34a-KO/WT cells from three independent experiments. (D) Apoptosis, assessed by annexin V/PI staining, in untreated or DOX-treated (48 hr) WT or 34a-KO MCF7 cells. (E) Cell cycle analysis of untreated or DOX-treated (48 hr) WT or 34a-KO MCF7 cells. All experiments were performed at least 3 times and the graphs show the mean +/- STDEV of replicate experiments (*, p<0.05; **, p<0.01, relative to WT cells, 2-tailed Student’s t-test).
Fig 8
Fig 8. Model of miR-34a and p53 interactions.
Competing negative and positive feedback loops determine the net effect of miR-34a on p53 function. Highlighted in red are the new layers of regulation revealed by our data. Activation of p53 by cellular stress leads to transcription of miR-34 miRNAs, which in turn can enhance p53 function by: (1) miR-34a-mediated inhibition of multiple negative regulators of p53 to further increase p53 transcriptional activity; and (2) miR-34a-mediated increase of p53 protein stability (miR-34a feed-forward loops); or inhibit p53 function by: (3) direct miR-34a-mediated inhibition of TP53; and (4) direct miR-34 inhibition of many p53-activated genes (negative feedback loops). The mechanism by which miR-34a increases p53 half-life is not known, but its suppression of YY1, whose gene product is known to enhance p53-MDM2 interactions may contribute. The net effect of miR-34a on the p53 response will depend on the relative importance of these pathways, which will be determined by differences in gene expression in each cell.

Similar articles

Cited by

References

    1. Vousden KH, Prives C. Blinded by the Light: The Growing Complexity of p53. Cell. 2009;137(3):413–31. 10.1016/j.cell.2009.04.037 - DOI - PubMed
    1. Freeman JA, Espinosa JM. The impact of post-transcriptional regulation in the p53 network. Brief Funct Genomics. 2013;12(1):46–57. 10.1093/bfgp/els058 - DOI - PMC - PubMed
    1. Hermeking H. MicroRNAs in the p53 network: micromanagement of tumour suppression. Nat Rev Cancer. 2012;12(9):613–26. 10.1038/nrc3318 - DOI - PubMed
    1. Bommer GT, Gerin I, Feng Y, Kaczorowski AJ, Kuick R, Love RE, et al. p53-mediated activation of miRNA34 candidate tumor-suppressor genes. Curr Biol. 2007;17(15):1298–307. . - PubMed
    1. Bouhallier F, Allioli N, Lavial F, Chalmel F, Perrard MH, Durand P, et al. Role of miR-34c microRNA in the late steps of spermatogenesis. Rna. 2010;16(4):720–31. 10.1261/rna.1963810 - DOI - PMC - PubMed

Publication types