

Conditional Self-Entropy and Conditional Joint Transfer Entropy in Heart Period Variability during Graded Postural Challenge
- PMID: 26177517
- PMCID: PMC4503559
- DOI: 10.1371/journal.pone.0132851
Conditional Self-Entropy and Conditional Joint Transfer Entropy in Heart Period Variability during Graded Postural Challenge
Abstract
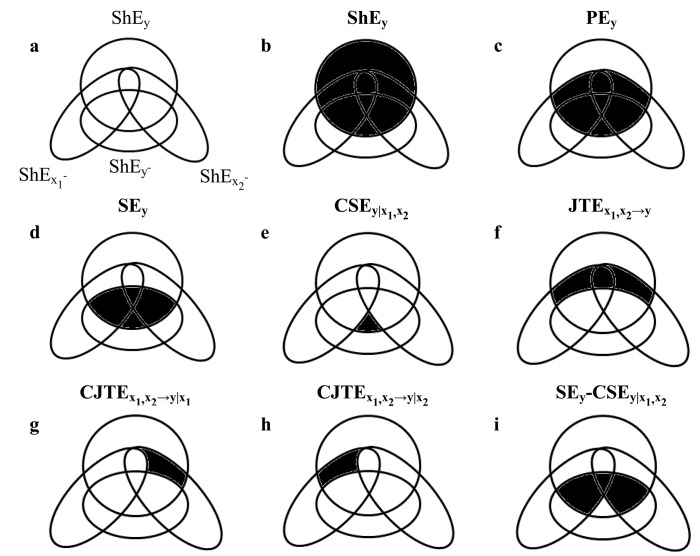
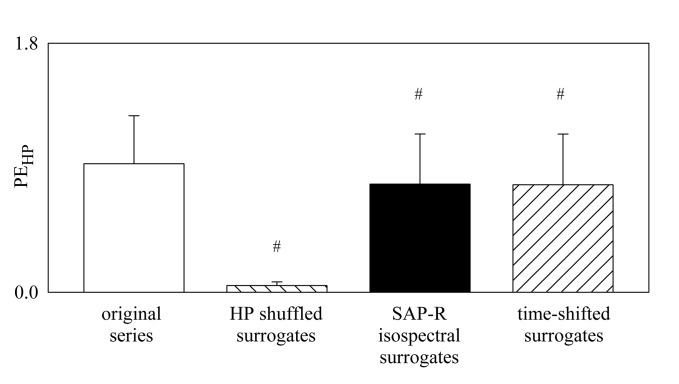
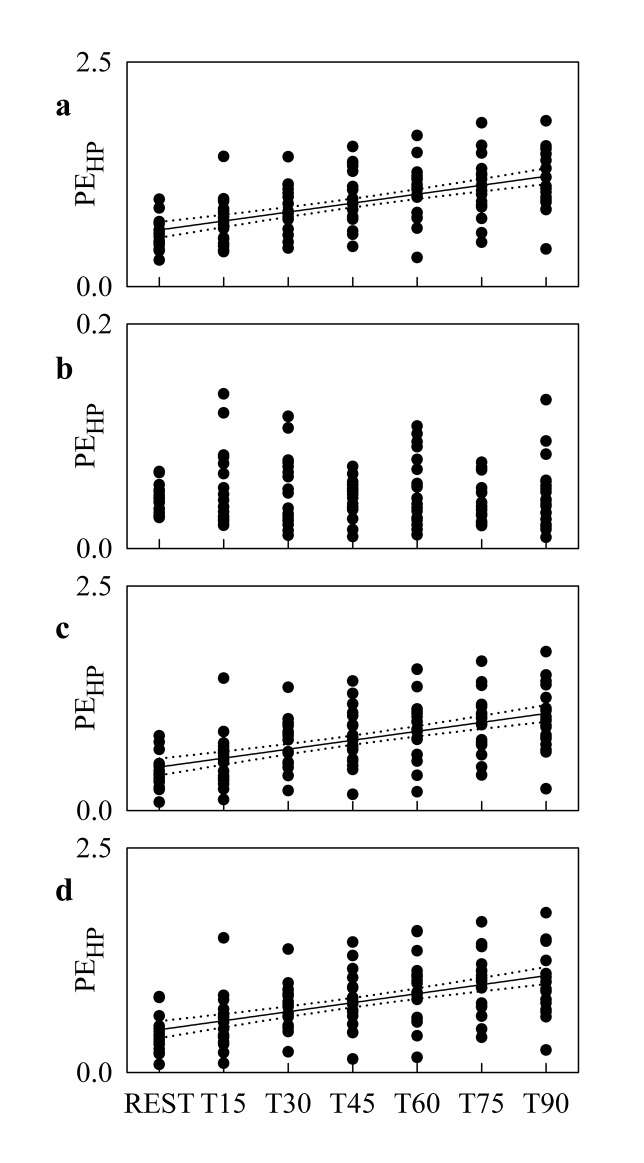
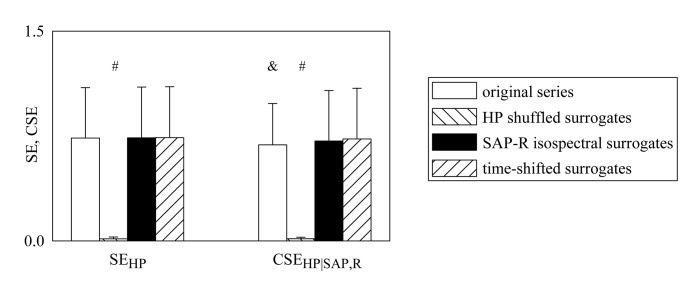
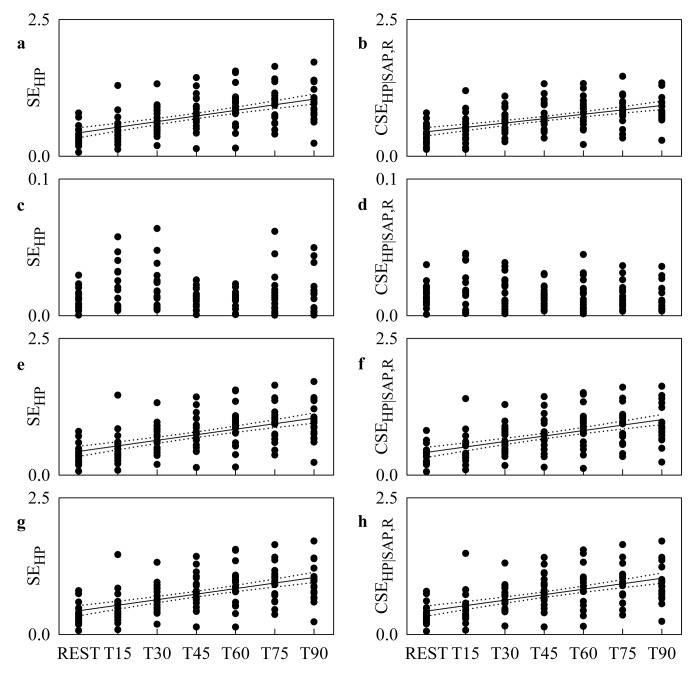
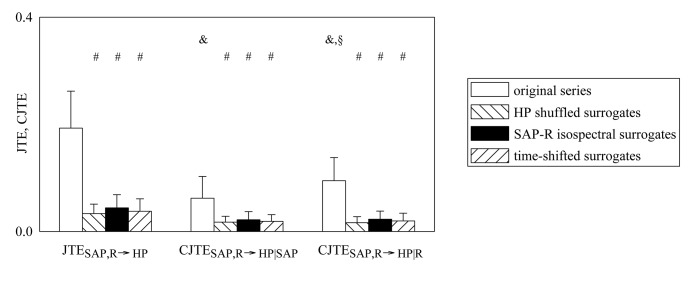
Self-entropy (SE) and transfer entropy (TE) are widely utilized in biomedical signal processing to assess the information stored into a system and transferred from a source to a destination respectively. The study proposes a more specific definition of the SE, namely the conditional SE (CSE), and a more flexible definition of the TE based on joint TE (JTE), namely the conditional JTE (CJTE), for the analysis of information dynamics in multivariate time series. In a protocol evoking a gradual sympathetic activation and vagal withdrawal proportional to the magnitude of the orthostatic stimulus, such as the graded head-up tilt, we extracted the beat-to-beat spontaneous variability of heart period (HP), systolic arterial pressure (SAP) and respiratory activity (R) in 19 healthy subjects and we computed SE of HP, CSE of HP given SAP and R, JTE from SAP and R to HP, CJTE from SAP and R to HP given SAP and CJTE from SAP and R to HP given R. CSE of HP given SAP and R was significantly smaller than SE of HP and increased progressively with the amplitude of the stimulus, thus suggesting that dynamics internal to HP and unrelated to SAP and R, possibly linked to sympathetic activation evoked by head-up tilt, might play a role during the orthostatic challenge. While JTE from SAP and R to HP was independent of tilt table angle, CJTE from SAP and R to HP given R and from SAP and R to HP given SAP showed opposite trends with tilt table inclination, thus suggesting that the importance of the cardiac baroreflex increases and the relevance of the cardiopulmonary pathway decreases during head-up tilt. The study demonstrates the high specificity of CSE and the high flexibility of CJTE over real data and proves that they are particularly helpful in disentangling physiological mechanisms and in assessing their different contributions to the overall cardiovascular regulation.
Conflict of interest statement
Figures

Similar articles
-
Quantifying Net Synergy/Redundancy of Spontaneous Variability Regulation via Predictability and Transfer Entropy Decomposition Frameworks.IEEE Trans Biomed Eng. 2017 Nov;64(11):2628-2638. doi: 10.1109/TBME.2017.2654509. IEEE Trans Biomed Eng. 2017. PMID: 28103546
-
Disentangling cardiovascular control mechanisms during head-down tilt via joint transfer entropy and self-entropy decompositions.Front Physiol. 2015 Oct 27;6:301. doi: 10.3389/fphys.2015.00301. eCollection 2015. Front Physiol. 2015. PMID: 26578973 Free PMC article.
-
Cerebrovascular and cardiovascular variability interactions investigated through conditional joint transfer entropy in subjects prone to postural syncope.Physiol Meas. 2017 May;38(5):976-991. doi: 10.1088/1361-6579/aa638c. Epub 2017 Feb 28. Physiol Meas. 2017. PMID: 28245206
-
Characterization of cardiorespiratory coupling via a variability-based multi-method approach: Application to postural orthostatic tachycardia syndrome.Chaos. 2024 Dec 1;34(12):122102. doi: 10.1063/5.0237304. Chaos. 2024. PMID: 39661969 Review.
-
[Tilt test and orthostatic intolerance: abnormalities in the neural sympathetic response to gravitational stimulus].Ital Heart J Suppl. 2001 May;2(5):484-90. Ital Heart J Suppl. 2001. PMID: 11388331 Review. Italian.
Cited by
-
Kernel-Based Independence Tests for Causal Structure Learning on Functional Data.Entropy (Basel). 2023 Nov 28;25(12):1597. doi: 10.3390/e25121597. Entropy (Basel). 2023. PMID: 38136477 Free PMC article.
-
A Transfer Entropy Approach for the Assessment of the Impact of Inspiratory Muscle Training on the Cardiorespiratory Coupling of Amateur Cyclists.Front Physiol. 2020 Feb 25;11:134. doi: 10.3389/fphys.2020.00134. eCollection 2020. Front Physiol. 2020. PMID: 32158402 Free PMC article.
-
Association between autonomic control indexes and mortality in subjects admitted to intensive care unit.Sci Rep. 2018 Feb 22;8(1):3486. doi: 10.1038/s41598-018-21888-8. Sci Rep. 2018. PMID: 29472594 Free PMC article. Clinical Trial.
-
Information-Theoretic Analysis of Cardio-Respiratory Interactions in Heart Failure Patients: Effects of Arrhythmias and Cardiac Resynchronization Therapy.Entropy (Basel). 2023 Jul 17;25(7):1072. doi: 10.3390/e25071072. Entropy (Basel). 2023. PMID: 37510019 Free PMC article.
-
Predictability decomposition detects the impairment of brain-heart dynamical networks during sleep disorders and their recovery with treatment.Philos Trans A Math Phys Eng Sci. 2016 May 13;374(2067):20150177. doi: 10.1098/rsta.2015.0177. Philos Trans A Math Phys Eng Sci. 2016. PMID: 27044993 Free PMC article.
References
-
- Schreiber T. Measuring information transfer. Phys Rev Lett 2000; 85: 461–464. - PubMed
-
- Vejmelka M, Palus M. Inferring the directionality of coupling with conditional mutual information. Phys Rev E 2008; 77: 026214. - PubMed
-
- Lizier JT, Atay FM, Jost J. Information storage, loop motifs, and clustered structure in complex networks. Phys Rev E 2012; 86, 026110. - PubMed
-
- Barnett L, Barrett AB, Seth AK. Granger causality and transfer entropy are equivalent for Gaussian variables. Phys Rev Lett 2009; 103, 238701 - PubMed
Publication types
MeSH terms
LinkOut - more resources
Full Text Sources
Other Literature Sources
Medical
Research Materials
Miscellaneous
