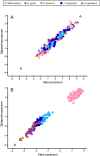
Neurocranium versus Face: A Morphometric Approach with Classical Anthropometric Variables for Characterizing Patterns of Cranial Integration in Extant Hominoids and Extinct Hominins
- PMID: 26177535
- PMCID: PMC4503590
- DOI: 10.1371/journal.pone.0131055
Neurocranium versus Face: A Morphometric Approach with Classical Anthropometric Variables for Characterizing Patterns of Cranial Integration in Extant Hominoids and Extinct Hominins
Abstract
The relative importance of the two main cranial complexes, the neurocranium and the splanchnocranium, has been examined in the five species of extant hominoids and in a huge sample of extinct hominins using six standard craniometric variables that measure the length, width and height of each cranial module. Factor analysis and two-block partial least squares were used for establishing the major patterns of developmental and evolutionary integration between both cranial modules. The results obtained show that all extant hominoids (including the anatomically modern humans) share a conserved pattern of developmental integration, a result that agrees with previous studies. The pattern of evolutionary integration between both cranial modules in australopiths runs in parallel to developmental integration. In contrast, the pattern of evolutionary and developmental integration of the species of the genus Homo is the opposite, which is probably the consequence of distinctive selective regimes for both hominin groups.
Conflict of interest statement
Figures


Similar articles
-
Sexual dimorphic features within extant great ape faciodental skeletal anatomy and testing the single species hypothesis.Z Morphol Anthropol. 1997;81(3):253-88. Z Morphol Anthropol. 1997. PMID: 9428188
-
Developments in cranial morphometrics.Folia Primatol (Basel). 1989;53(1-4):101-24. doi: 10.1159/000156411. Folia Primatol (Basel). 1989. PMID: 2606392
-
Quantifying mental foramen position in extant hominoids and Australopithecus: implications for its use in studies of human evolution.Anat Rec (Hoboken). 2010 Aug;293(8):1337-49. doi: 10.1002/ar.21171. Anat Rec (Hoboken). 2010. PMID: 20564583
-
Evolution of hominin cranial ontogeny.Prog Brain Res. 2012;195:273-92. doi: 10.1016/B978-0-444-53860-4.00013-1. Prog Brain Res. 2012. PMID: 22230632 Review.
-
Craniofacial variation and developmental divergence in primate and human evolution.Novartis Found Symp. 2007;284:262-73; discussion 273-9. doi: 10.1002/9780470319390.ch17. Novartis Found Symp. 2007. PMID: 17710858 Review.
Cited by
-
A 3D analysis of growth trajectory and integration during early human prenatal facial growth.Sci Rep. 2021 Mar 25;11(1):6867. doi: 10.1038/s41598-021-85543-5. Sci Rep. 2021. PMID: 33767268 Free PMC article.
-
Heterochronies and allometries in the evolution of the hominid cranium: a morphometric approach using classical anthropometric variables.PeerJ. 2022 Aug 25;10:e13991. doi: 10.7717/peerj.13991. eCollection 2022. PeerJ. 2022. PMID: 36042865 Free PMC article.
-
Normal human craniofacial growth and development from 0 to 4 years.Sci Rep. 2023 Jun 14;13(1):9641. doi: 10.1038/s41598-023-36646-8. Sci Rep. 2023. PMID: 37316540 Free PMC article.
-
Characterizing ecomorphological patterns in hyenids: a multivariate approach using postcanine dentition.PeerJ. 2019 Jan 11;6:e6238. doi: 10.7717/peerj.6238. eCollection 2019. PeerJ. 2019. PMID: 30648005 Free PMC article.
-
Sexual dimorphism in shape and size of the neurocranium.Int J Legal Med. 2022 Nov;136(6):1851-1863. doi: 10.1007/s00414-022-02876-0. Epub 2022 Aug 9. Int J Legal Med. 2022. PMID: 35945460
References
-
- Olson EC, Miller RL. Morphological Integration. Chicago: University of Chicago Press; 1958.
-
- Mitteroecker P, Bookstein FL. The conceptual and statistical relationship between modularity and morphological integration. Syst Biol. 2007;56: 818–836. - PubMed
-
- Klingenberg CP. Morphological integration and developmental modularity. Annu Rev Ecol Evol Syst. 2008;39: 115–132.
-
- Rolian C, Willmore KE. 50 years of morphological integration: patterns and processes of integration in biological anthropology. Evol Biol. 2009;36: 1–4.
-
- Cheverud JM. Phenotypic, genetic, and environmental morphological integration in the cranium. Evolution. 1982;36: 499–516. - PubMed
Publication types
MeSH terms
LinkOut - more resources
Full Text Sources
Other Literature Sources

