. 2015 Jul 15;10(7):e0133187.
doi: 10.1371/journal.pone.0133187. eCollection 2015.

Dynamics of T-Junction Solution Switching Aimed at Patch Clamp Experiments

Affiliations

Dynamics of T-Junction Solution Switching Aimed at Patch Clamp Experiments

Jerónimo A Auzmendi et al. PLoS One. .

Abstract

Solutions exchange systems are responsible for the timing of drug application on patch clamp experiments. There are two basic strategies for generating a solution exchange. When slow exchanges are bearable, it is easier to perform the exchange inside the tubing system upstream of the exit port. On the other hand, fast, reproducible, exchanges are usually performed downstream of the exit port. As both strategies are combinable, increasing the performance of upstream exchanges is desirable. We designed a simple method for manufacturing T-junctions (300 μm I.D.) and we measured the time profile of exchange of two saline solutions using a patch pipette with an open tip. Three factors were found to determine the timing of the solution switching: pressure, travelled distance and off-center distance. A linear relationship between the time delay and the travelled distance was found for each tested pressure, showing its dependence to the fluid velocity, which increased with pressure. The exchange time was found to increase quadratically with the delay, although a sizeable variability remains unexplained by this relationship. The delay and exchange times increased as the recording pipette moved away from the center of the stream. Those increases became dramatic as the pipette was moved close to the stream borders. Mass transport along the travelled distance between the slow fluid at the border and the fast fluid at the center seems to contribute to the time course of the solution exchange. This effect would be present in all tubing based devices. Present results might be of fundamental importance for the adequate design of serial compound exchangers which would be instrumental in the discovery of drugs that modulate the action of the physiological agonists of ion channels with the purpose of fine tuning their physiology.


Conflict of interest statement

Competing Interests: The authors have declared that no competing interests exist.

Figures

Fig 1
Fig 1. T-junction manufacture and operation.
(A) Silicone tubing and punch. A 0.5 mm interval ruler is apparent on the bottom. (B) A hole is drilled perpendicular to the central hole. (C) After inserting a polyethylene tubing the T-junction is completed. (D) General device. I. N2 tank. II. Filter III. Pressurized reservoir of solution. IV. 3-way solenoid pinch valves. V. A 24 V custom made valve driver. VI. Merger system of two T-junctions staked in XYZ translator. VII. Open tip recording pipette. VIII. Patch clamp amplifier. IX. A multifunction data acquisition connected to PC. (E) Schematic representation of experimental configuration. (F) Image of experimental configuration. The image was taken using a web camera coupled to the setup microscope. (G) Operation of the solution switching. A pulse of test solution (violet) was inserted into the control solution (pink).
Fig 2
Fig 2. Time course of the solution exchange at two propelling pressures for a constant travelled distance of 20 mm at the optimal position.
(A) Complete exchange. From top to bottom: pinch valve voltage command; measured response at 0.4 bar; idem at 0.1 bar. The current was measured while holding the pipette at -100 mV. Dashed line indicates ton and t90. (B) Detail of the forward exchange. Measured current (black) and fitted equation (red) at 0.4 bar; idem at 0.1 bar; fitted equation. Red circles indicate the t10 and t90. Delay time and exchange time (ET) are defined as t10-ton and t90-t10, respectively.
Fig 3
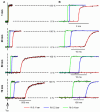
Fig 3. Time course of the forward exchange at different distances (horizontal panels) and pressures (line color) at the optimal position.
Experimental data is indicated on black; fits to the equation (same as in Fig 2) are indicated on color. (A) The delay between the time of valve activation (arrow, ton) and the exchange increased with both distance and pressure. (B) Expanded time scales showed that the fit covered the data in all cases. The correlation coefficients for 1 mm were the following: 0.986, 0.980 and 0.974 for 0.1, 0.2 and 0.4 bar respectively. For 20 mm, they were: 0.984; 0.988 and 0.987 while for 51 mm: 0.985, 0.975 and 0.982. Finally for 70 mm were: 0.983, 0.982 and 0.980.
Fig 4
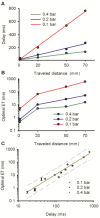
Fig 4. Analysis of the data at the optimal point.
(A) Linear plot showing that the delay time increased linearly with the traveled distance at each propelled pressure. (B) Semi-log plot showing the relationship between the exchange time (t10-90) and the distance for each propelled pressure. (C) Log-log plot showing a power relationship that describes the exchange time as a function of the delay time for all distances and propelled pressures. Dashed line indicates the 95% prediction interval of a linear regression on the logarithms.
Fig 5
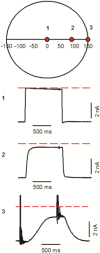
Fig 5. The effect of the off-center distance.
The upper diagram is a schematic representation of a cross section of the stream. Three different recording positions are shown (red circle 1 is limit zone, red circle 2 is optimal position and red circle 3 is a suboptimal position). 1; 2; and 3 are the records of each position and dashed red line indicates the maximum response at all positions.
Fig 6
Fig 6. Time course of the solution exchange slowed down away from the optimal position.
Exchanges were measured at 0, 15 and 30 μm away from the optimal position for 0.1 or 0.4 bar and for distances of 1, 20, 51, or 70 mm. The small line above each scale bar indicates the scale bar of the previous distance.
Fig 7
Fig 7. Symmetry and variability of the forward exchange.
(A) Symmetric change in the exchange at increasing off-center distances. Left and right from the optimal point were plotted in red or black respectively at 1 mm of travelled distance and 0.4 bar. (B) Trace to trace variability at the optimal point (black) and 10 micrometers off-center (violet). (C) Recording stability. At the optimal point two traces that differ 30 minutes were compared. Traces were generated using T-junction at 51 mm and 0.1 bar.
Fig 8
Fig 8. Sagittal section of the time course of the solution exchange.
The vertical yellow bar represents 350 μm; ticks indicate the position of each recorded trace used to interpolate the data. The yellow horizontal traces indicate the command voltage applied to the valve, (notice that the time increases from right to left. In this way the plot gives the right impression that the center goes faster than the borders). Red arrows indicate the ton. The diffusive nature of the profile is clearly increasing with distance and lowering pressure.

Similar articles

References

    1. Hille B. Ion channels of excitable membranes. Edition 3. Hille B, editor2001. i-xviii, 1–814 p.
    1. Voets T, Droogmans G, Wissenbach U, Janssens A, Flockerzi V, Nilius B. The principle of temperature-dependent gating in cold- and heat-sensitive TRP channels. Nature. 2004;430(7001):748–54. Epub 2004/08/13. 10.1038/nature02732 . - DOI - PubMed
    1. Hattori M, Gouaux E. Molecular mechanism of ATP binding and ion channel activation in P2X receptors. Nature. 2012;485(7397):207–U91. 10.1038/nature11010 . - DOI - PMC - PubMed
    1. Newell JG, McDevitt RA, Czajkowski C. MUTATION OF A GABAA RECEPTOR BINDING SITE RESIDUE PRODUCES A CONSTITUTIVELY OPEN CHANNEL . Society for Neuroscience Abstract Viewer and Itinerary Planner. 2002;2002:Abstract No. 40.3-Abstract No. .3. .
    1. Bowie D. External anions and cations distinguish between AMPA and kainate receptor gating mechanisms. Journal of Physiology-London. 2002;539(3):725–33. 10.1013/jphysiol.2001.013407 . - DOI - PMC - PubMed

Publication types