

The 3'-Jα Region of the TCRα Locus Bears Gene Regulatory Activity in Thymic and Peripheral T Cells
- PMID: 26177549
- PMCID: PMC4503570
- DOI: 10.1371/journal.pone.0132856
The 3'-Jα Region of the TCRα Locus Bears Gene Regulatory Activity in Thymic and Peripheral T Cells
Abstract
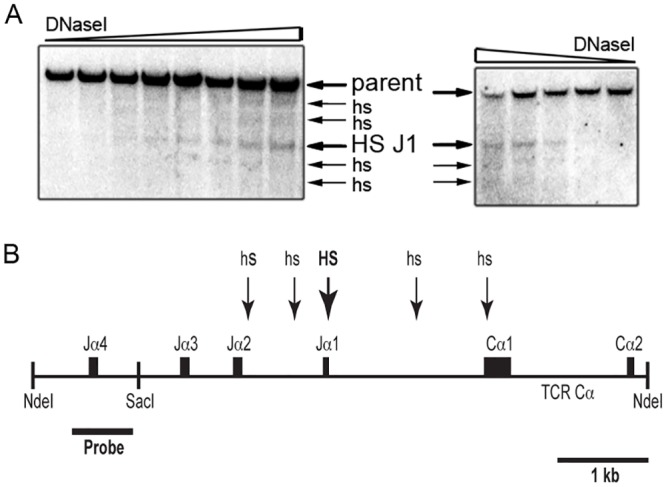
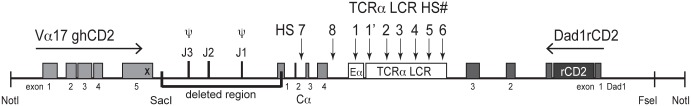
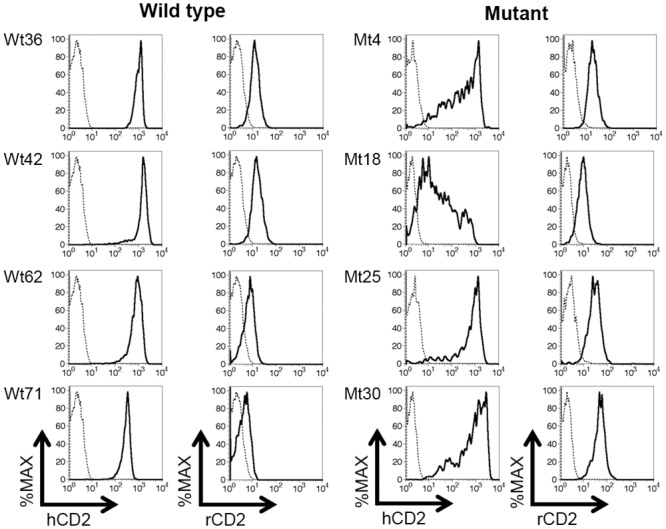
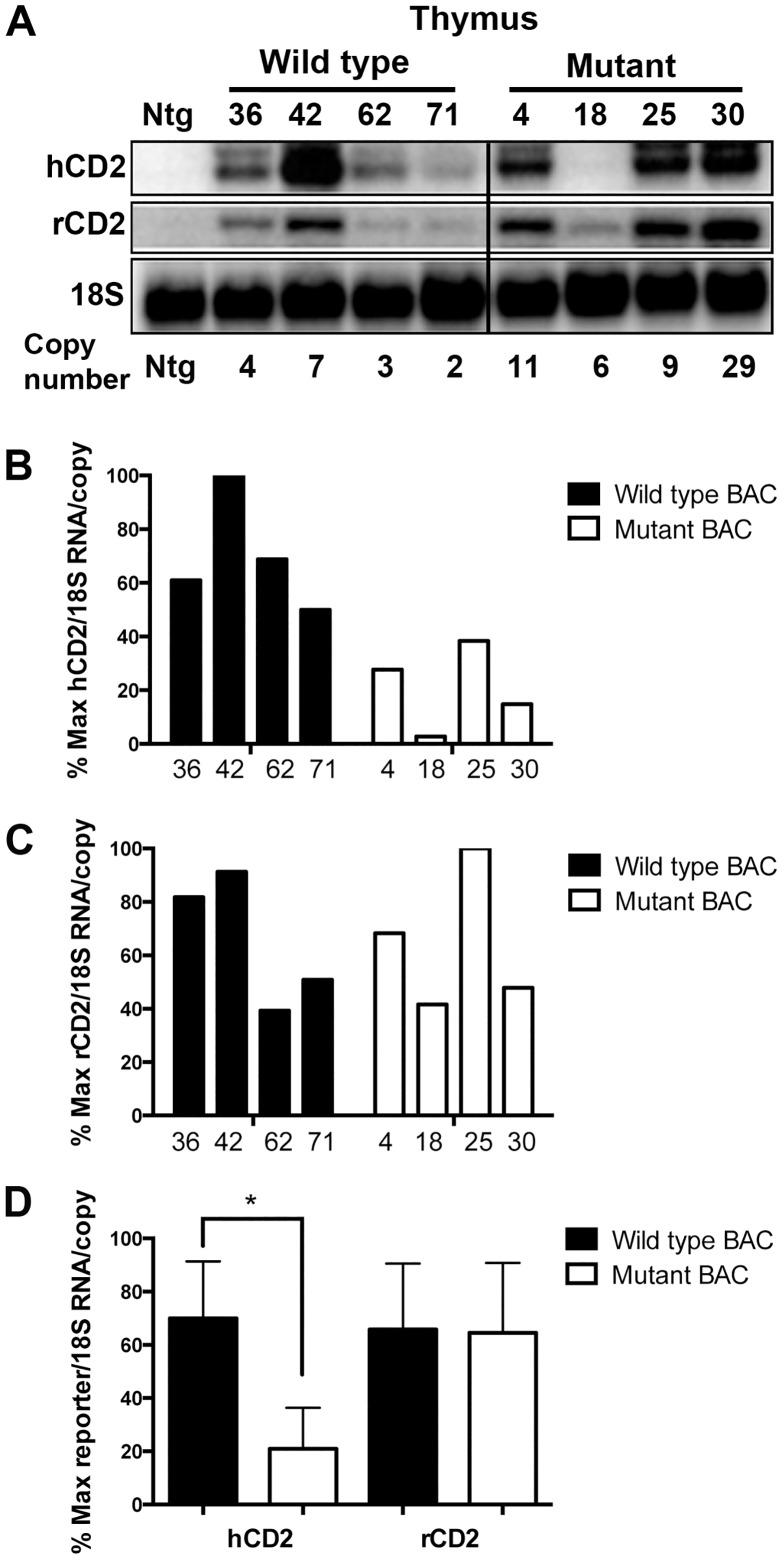
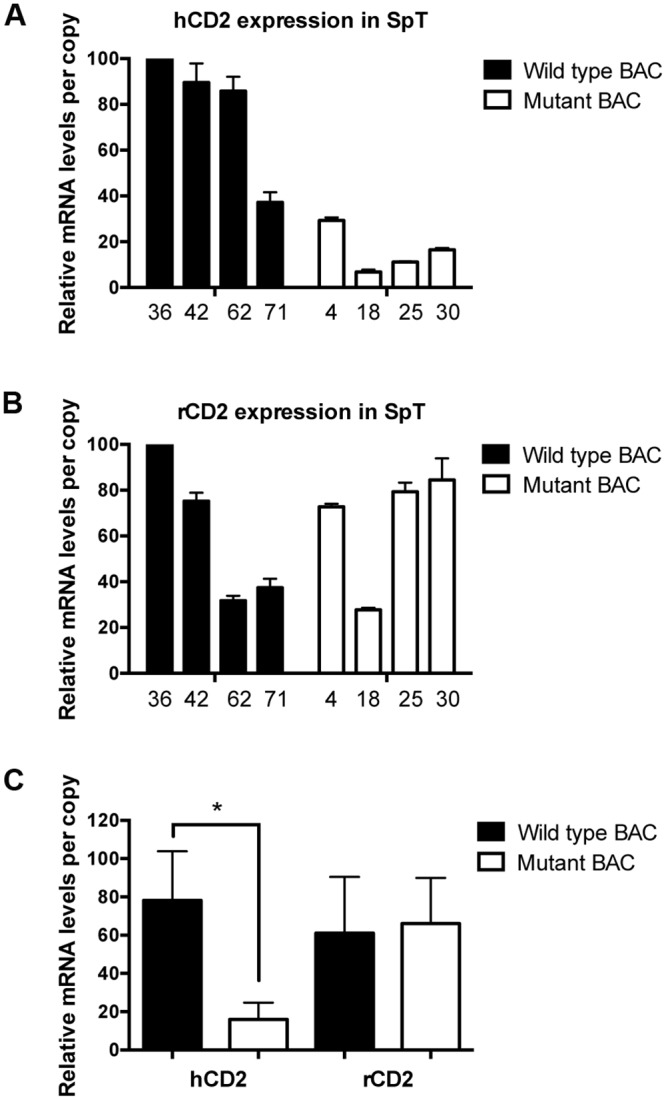
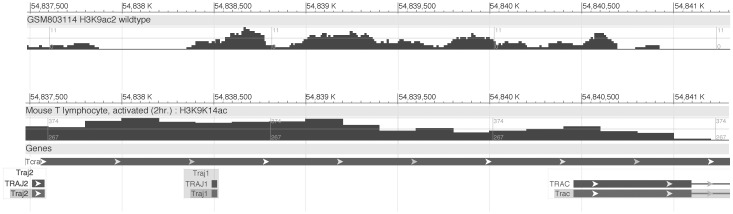
Much progress has been made in understanding the important cis-mediated controls on mouse TCRα gene function, including identification of the Eα enhancer and TCRα locus control region (LCR). Nevertheless, previous data have suggested that other cis-regulatory elements may reside in the locus outside of the Eα/LCR. Based on prior findings, we hypothesized the existence of gene regulatory elements in a 3.9-kb region 5' of the Cα exons. Using DNase hypersensitivity assays and TCRα BAC reporter transgenes in mice, we detected gene regulatory activity within this 3.9-kb region. This region is active in both thymic and peripheral T cells, and selectively affects upstream, but not downstream, gene expression. Together, these data indicate the existence of a novel cis-acting regulatory complex that contributes to TCRα transgene expression in vivo. The active chromatin sites we discovered within this region would remain in the locus after TCRα gene rearrangement, and thus may contribute to endogenous TCRα gene activity, particularly in peripheral T cells, where the Eα element has been found to be inactive.
Conflict of interest statement
Figures
Similar articles
-
The TCRalpha locus control region specifies thymic, but not peripheral, patterns of TCRalpha gene expression.J Immunol. 2005 Nov 15;175(10):6659-67. doi: 10.4049/jimmunol.175.10.6659. J Immunol. 2005. PMID: 16272321
-
Ectopic T cell receptor-α locus control region activity in B cells is suppressed by direct linkage to two flanking genes at once.PLoS One. 2010 Nov 22;5(11):e15527. doi: 10.1371/journal.pone.0015527. PLoS One. 2010. PMID: 21124935 Free PMC article.
-
CTCF-independent, but not CTCF-dependent, elements significantly contribute to TCR-alpha locus control region activity.J Immunol. 2007 Jul 15;179(2):1088-95. doi: 10.4049/jimmunol.179.2.1088. J Immunol. 2007. PMID: 17617601
-
Turning T-cell receptor beta recombination on and off: more questions than answers.Immunol Rev. 2006 Feb;209:129-41. doi: 10.1111/j.0105-2896.2006.00342.x. Immunol Rev. 2006. PMID: 16448539 Review.
-
Enforcing order within a complex locus: current perspectives on the control of V(D)J recombination at the murine T-cell receptor alpha/delta locus.Immunol Rev. 2004 Aug;200:224-32. doi: 10.1111/j.0105-2896.2004.00155.x. Immunol Rev. 2004. PMID: 15242408 Review.
Cited by
-
A pooled CRISPR screen identifies the Tα2 enhancer element as a driver of TRA expression in a subset of mature human T lymphocytes.Front Immunol. 2025 Mar 14;16:1536003. doi: 10.3389/fimmu.2025.1536003. eCollection 2025. Front Immunol. 2025. PMID: 40160815 Free PMC article.
References
-
- Krangel MS, Carabana J, Abbarategui I, Schlimgen R, Hawwari A. Enforcing order within a complex locus: current perspectives on the control of V(D)J recombination at the murine T-cell receptor alpha/delta locus. Immunol. Rev. 2004;200:224–32. . - PubMed
-
- Diaz P, Cado D, Winoto A. A locus control region in the T cell receptor alpha/delta locus. Immunity. 1994;1(3):207–17. - PubMed
-
- Harrow F, Ortiz BD. The TCRalpha locus control region specifies thymic, but not peripheral, patterns of TCRalpha gene expression. J. Immunol. 2005;175(10):6659–67. . - PubMed
Publication types
MeSH terms
Substances
Grants and funding
LinkOut - more resources
Full Text Sources
Other Literature Sources
