. 2015 Oct;172(19):4726-40.
doi: 10.1111/bph.13247. Epub 2015 Aug 13.

Eicosapentaenoic acid prevents TCDD-induced oxidative stress and inflammatory response by modulating MAP kinases and redox-sensitive transcription factors

Affiliations

Eicosapentaenoic acid prevents TCDD-induced oxidative stress and inflammatory response by modulating MAP kinases and redox-sensitive transcription factors

Kalaiselvi Palanisamy et al. Br J Pharmacol. 2015 Oct.

Abstract

Background and purpose: Oxidative stress and subsequent activation of inflammatory responses is a widely accepted consequence of exposure to environmental toxins. TCDD (2,3,7,8-tetrachlorodibenzo-p-dioxin), a well-known environmental toxin, exerts its toxicity through many signalling mechanisms, with liver being the principal organ affected. However, an effective antidote to TCDD-induced toxicity is unknown. The present study evaluated the effect of eicosapentaenoic acid (EPA), an n3 fatty acid, on TCDD-induced toxicity.

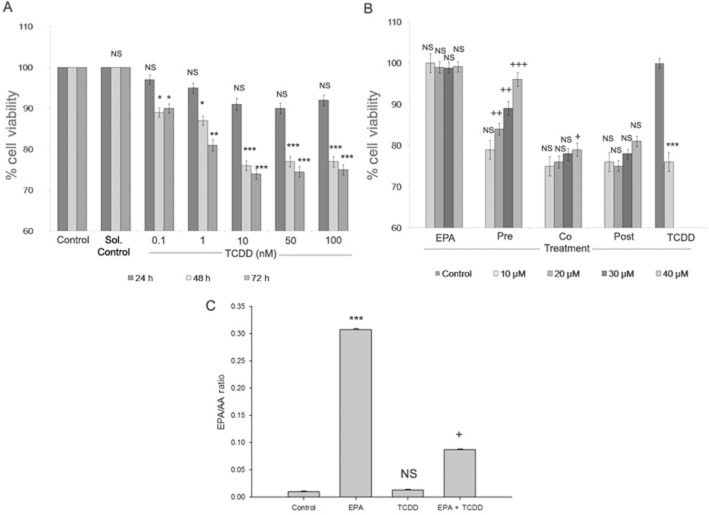
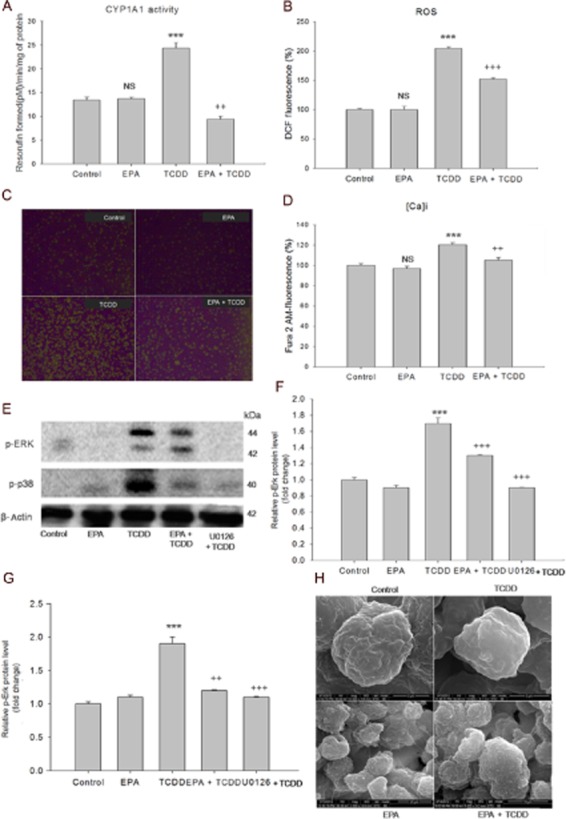
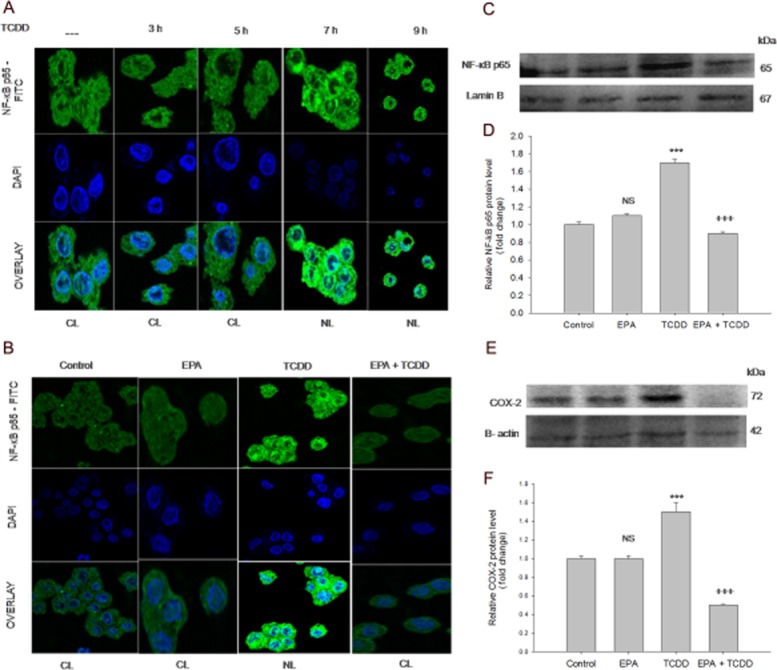
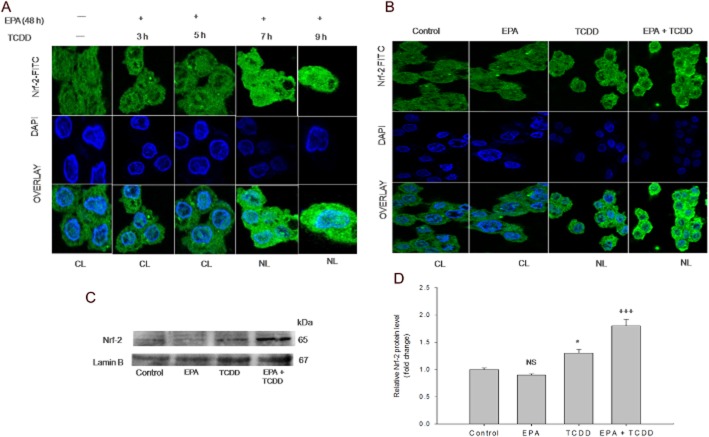
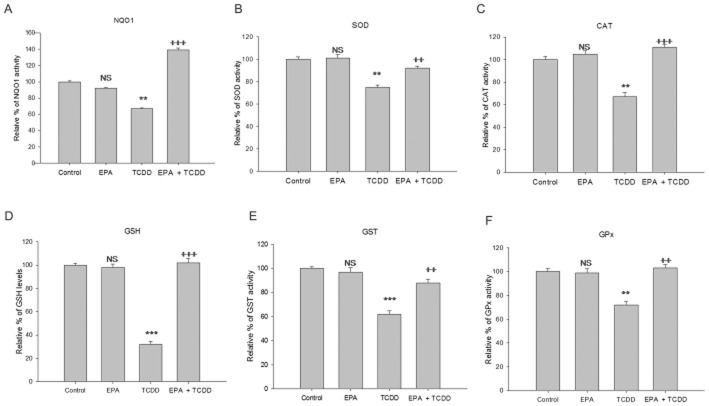
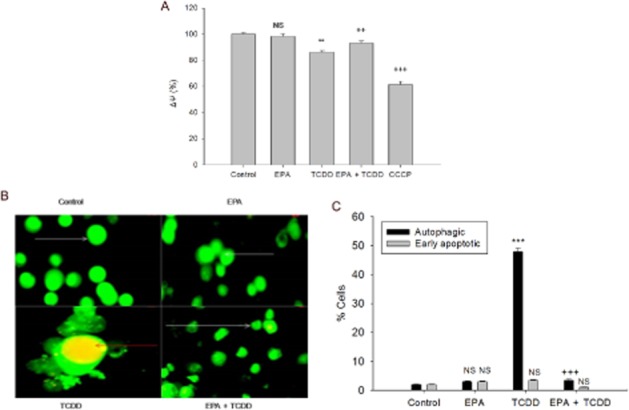
Experimental approach: In cultures of HepG2 cells, the EPA/AA ratio was determined using gas chromatography, oxidative stress and inflammatory responses through reactive oxygen species (ROS) levels, antioxidant status, [Ca(2+) ]i , nuclear migration of two redox-sensitive transcription factors, NF-κB p65 and Nrf-2, expression of MAP kinase (p-Erk, p-p38), NF-κB p65, COX-2 and Nrf-2. Cellular changes in ΔΨm, acidic vesicular organelle formation, cell cycle analysis and scanning electron microscopy analysis were performed.

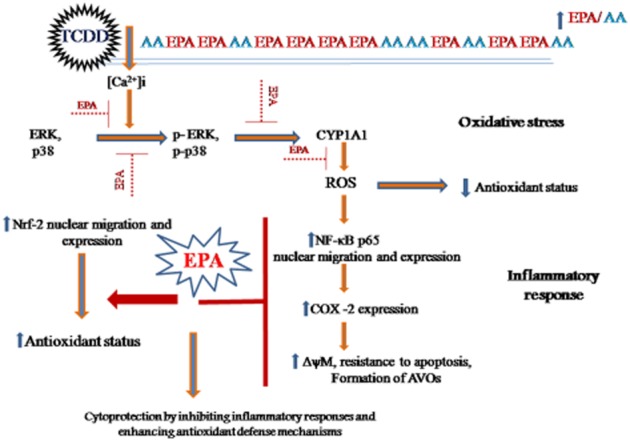
Key results: EPA offered significant cytoprotection by increasing EPA/AA ratios in cell membranes, inhibiting ROS generation, enhancing antioxidant status and modulating nuclear translocation of redox-sensitive transcription factors (NF-κB p65 and Nrf-2) and expression of NF-κB p65, COX-2 and Nrf-2. Furthermore, TCDD-induced upstream events of MAPK phosphorylation, the increase in [Ca(2+) ]i levels and cell surface changes in microvilli were significantly inhibited by EPA. EPA treatment maintained ΔΨm and prevented formation of acidic vesicular organelles.

Conclusion and implications: The present study demonstrates for the first time some underlying molecular mechanisms of cytoprotection exerted by EPA against TCDD-induced oxidative stress and inflammatory responses.


Figures

Figure 1
Figure 1
Effect of EPA on TCDD-induced cytotoxicity in HepG2 cells. (A) TCDD-induced cytotoxicity: HepG2 cells were treated with TCDD (0.1, 1, 10, 50 and 100 nM) for different exposure time (24, 48 and 72 h). Cell viability was determined by MTT assay and the results are expressed as percentage of cell viability. Results shown are mean ± SE (n = 9), which are three independent experiment performed in triplicate. ***P < 0.001; **P < 0.01; *P < 0.05, significantly different from control. NS, non-significantly different from control. (B) EPA protects against TCDD-induced toxicity: Cells were treated with 10 nM TCDD and different doses of EPA (10, 20, 30, 40 μM). Pre-treatment (EPA 48 h followed by TCDD 48 h), co-treatment (EPA + TCDD – 48 h) and post-treatment (TCDD 48 h followed by EPA 48 h) of EPA was performed to analyse the cytoprotective effect of EPA against TCDD-induced cytotoxicity. Cell viability was determined by MTT assay and the results are expressed as percentage of cell viability. Results shown are means ± SE (n = 9), which are three independent experiment performed in triplicate. ***P < 0.001, significantly different from control. NS, non-significantly different from control. +++P < 0.001; ++P < 0.01; +P < 0.05, significantly different from TCDD treated group. (C) EPA modulates the EPA/AA ratio: The ratio of EPA/AA during EPA and TCDD treatment was calculated and the results represented are means ± SE (n = 3;, three independent experiments). ***P < 0.001, significantly different from control. NS, non-significantly different from control. +P < 0.05, significantly different from the TCDD-treated group (one-way anova followed by Tukey's multiple comparison test).
Figure 2
Figure 2
EPA inhibits TCDD-induced oxidative stress, regulates [Ca2+]i levels and prevents MAPK activation. (A) EPA inhibits CYP1A1 activity: HepG2 cells were treated with TCDD for 48 h in the presence/absence of EPA for 48 h. Conversion of 7-ethoxy resorufin to resorufin by CYP1A1 was measured fluorimetrically. The results are expressed as picomol resorufin formed min-1 (mg protein)-1. (B) EPA inhibits TCDD-induced ROS generation: HepG2 cells were treated with TCDD treatment for 6 in the presence/absence of 40 μM EPA for 48 h. The fluorescence intensity is expressed as percentage of relative DCF fluorescence. The results shown are means ± SE (n = 9; three independent experiments performed in triplicate). ***P < 0.001, significantly different from control. NS, non-significantly different from control. ++P < 0.01; +++P < 0.001, significantly different from the TCDD-treated group (one-way anova followed by Tukey's multiple comparison test). (C) Effect of EPA and TCDD on DCF fluorescence: Control cells and cells treated with EPA show low DCF fluorescence. Cells with TCDD show high fluorescence compared with control cells. Pre-treatment with EPA followed by TCDD shows low DCF fluorescence. Magnification: 100×. (D) EPA maintains TCDD-induced intracellular [Ca2+]i levels. HepG2 cells were treated with TCDD for 45 min in the presence/absence of EPA for 48 h. The results were expressed as percentage of relative fluorescence of Fura 2-AM. The results shown are means ± SE (n = 9; three independent experiments performed in triplicate). ***P < 0.001, significantly different from control. NS, non-significantly different from control. ++P < 0.01, significantly different from the TCDD-treated group. (E) EPA prevents TCDD-induced MAP kinases. HepG2 cells were treated with TCDD for 1 h in the presence and absence of EPA treatment for 48 h. For positive control, cells were treated with MAPK inhibitor U0126 for 1 h prior to TCDD treatment. After the treatment period, proteins were extracted and subjected to Western blot analysis. Densitometric analysis was performed using ImageJ software. (F) and (G) show densitometric analysis on the effect of EPA on TCDD-induced MAP kinases. The results shown are means ± SE of three independent experiments. ***P < 0.001, significantly different from control. NS, non-significantly different from control. +++P < 0.001; ++P < 0.01, significantly different from the TCDD-treated group; Student's t-test. (H) EPA prevents TCDD-induced loss of microvilli. SEM analysis: HepG2 cells were treated with TCDD for 48 h in the presence or absence of EPA for 48 h. Control and EPA treatment shows normal cell morphology with microvilli (15 000×) and (2000×) respectively. TCDD – Cells show complete loss of microvilli with the appearance of dome or sac-like structures (10 000×). EPA pre-treatment followed by TCDD treatment restored the normal cell surface morphology with the appearance of microvilli (5000×).
Figure 3
Figure 3
EPA mediates anti-inflammatory effects: prevents expression and nuclear localization of NF-κB p65, and COX-2 expression. (A) TCDD induces NF-κB p65 nuclear localization: The cells were treated with TCDD for different time points (10 nM TCDD for 3, 5, 7 and 9 h). NF-κB p65 nuclear localization was visualized using mouse monoclonal NF-κB p65 primary antibody followed by addition of FITC-conjugated secondary antibody. The nuclei were visualized using DAPI. Control, TCDD 3 h, TCDD 5 h show NF-κB p65 sequestration in the cytoplasm. TCDD 7 h and TCDD 9 h show NF-κB p65 nuclear localization (visualized as turquoise blue colour). CL, cytoplasmic localization; NL, nuclear localization. (B) EPA prevents TCDD-induced NF-κB p65 nuclear localization: The cells were treated with TCDD for 7 h in the presence/absence of EPA for 48 h. Control and EPA treated cells showed NF-κB p65 sequestration in the cytoplasm (indicate unstressed conditions). Cells exposed to TCDD for 7 h shows NF-κB p65 nuclear localization, visualized as turquoise blue colour. Pre-treatment with EPA followed by TCDD treatment shows cytoplasmic retention of NF-κB p65. CL, cytoplasmic localization; NL, nuclear localization. (C) EPA down regulates NF-κB p65 expression: Cells were treated with TCDD for 12 h in the presence/absence of EPA for 48 h. (D) Densitometric analysis of NF-κB p65 expression: The results shown are means ± SE of three independent experiments. ***P < 0.001, significantly different from control. NS, non-significantly different from control. +++P < 0.001, significantly different from the TCDD-treated group; Student's t-test. (E). EPA down-regulates COX-2 expression: Cells were treated with TCDD for 15 h in the presence/absence of EPA for 48 h. (F) Densitometric analysis of COX-2 expression: The results shown are means ± SE of three independent experiments. ***P < 0.001, significantly different from control. NS, non-significantly different from control. +++P < 0.001, significantly different from the TCDD-treated group; Student's t-test.
Figure 4
Figure 4
EPA mediates nuclear migration and up-regulation of Nrf-2 against TCDD-induced oxidative stress. (A) EPA mediates Nrf-2 migration in response to TCDD-induced oxidative stress: The cells were pre-treated with EPA followed by TCDD treatment at different time points [48 h (EPA) + 3 h (TCDD); 48 h (EPA) + 5 h (TCDD); 48 h (EPA) + 7 h (TCDD); 48 h (EPA) + 9 h (TCDD)]. Nrf-2 nuclear localization was visualized using mouse monoclonal Nrf-2 primary antibody followed by addition of FITC-conjugated secondary antibody. The nuclei were visualized using DAPI. Control and cells treated with 48 h (EPA) + 3 h (TCDD); 48 h (EPA) + 5 h (TCDD) show cytoplasmic sequestration of Nrf-2. Cells treated with 48 h (EPA) + 7 h (TCDD); 48 h (EPA) + 9 h (TCDD) show nuclear localization of Nrf-2, visualized as turquoise blue colour. CL, cytoplasmic localization; NL, nuclear localization. (B) Effect of EPA and TCDD on Nrf-2 nuclear migration: The cells were treated with TCDD for 7 h in the presence and absence of EPA for 48 h. Nrf-2 nuclear localization was visualized using mouse monoclonal Nrf-2 primary antibody followed by addition of FITC-conjugated secondary antibody. The nuclei were visualized using DAPI. Control and EPA-alone-treated cells showed retention of Nrf-2 in the cytoplasm. Cells exposed to TCDD for 7 h show partial Nrf-2 nuclear localization. Pre-treatment with EPA followed by TCDD treatment shows nuclear localization of Nrf-2 which was visualized as turquoise blue colour. CL, cytoplasmic localization; NL, nuclear localization. (C) EPA up-regulates Nrf-2 expression: Cells were treated with TCDD for 48 h in the presence/absence of EPA for 48 h. (D) Densitometric analysis of Nrf-2 expression: The results shown are means ± SE of three independent experiments. Significant up-regulation (*P < 0.05) of Nrf-2 expression was observed in TCDD treatment compared with the control cells. Pre-treatment with EPA followed by TCDD showed a further increase (+++P < 0.001) compared with the TCDD-treated cells. NS, non-significantly different from control; Student's t-test.
Figure 5
Figure 5
EPA enhances antioxidant status. HepG2 cells were treated with TCDD for 48 h in the presence/absence of EPA treatment for 48 h. NQO1 activity was determined using fluorimetric measurement of resorufin consumption. NQO1 activity 1 U = pmol of resorufin consumption min-1 (mg protein)-1. SOD 1 U = the amount of enzyme required to give 50% inhibition of pyrogallol auto-oxidation. Catalase 1 U = the amount of enzyme that consumes 1 nmol H2O2 per minute. GST 1 U = the amount of enzyme that conjugates 1 μmol CDNB per minute. GPx 1 U = the amount of enzyme that converts 1 μmol GSH to GSSG in the presence of H2O2 per minute. GSH is expressed as μmol GSH (mg protein)-1. The results were expressed relative percentage of antioxidant enzyme activity compared with the control. The results shown are mean of ± SD (n = 9; the results of three independent experiments carried out in triplicate). ***P < 0.001, **P < 0.05, significantly different from control. NS, non-significantly different from control. +++P < 0.001; ++P < 0.01, is significantly different from the TCDD-treated group; one-way anova followed by Tukey's multiple comparison test.
Figure 6
Figure 6
EPA attenuates TCDD-induced cellular damage. (A) Mitochondrial membrane potential (ΔψM): The cells were treated with TCDD for 48 h in the presence or absence of EPA for 48 h. The cells that were treated with 50 μM CCCP for 15 min were used as positive control. The results were expressed as percentage of relative of DiOC6 (3) fluorescence. ***P < 0.001; **P < 0.01, significantly different from control. NS, non-significantly different from control. ++P < 0.01, significantly different from the TCDD-treated group. (B) EPA prevents TCDD-induced AVO formation: Cells were treated with TCDD for 48 h in the presence or absence of EPA pre-treatment for 48 h. Control cells and cells treated with EPA show normal cell morphology with green florescence (white arrows). Cells treated with TCDD with orange-red spots indicate AVOs (red arrows). Cells pre-treated with EPA followed by TCDD treatment with normal cellular morphology with green florescence. Magnification: 100×. (C) Percentage of cells with apoptosis and autophagy. For each treatment group, 200 cells were scored for differential uptake of the stain and the results were calculated in percentage and represented as means ± SE, from three independent experiments. ***P < 0.001, significantly different from control. NS, non-significantly different from control. +++P < 0.001, significantly different from the TCDD-treated group; one-way anova followed by Tukey's multiple comparison test.
Figure 7
Figure 7
Schematic representation of EPA-mediated cytoprotection against TCDD-induced toxicity.

Similar articles

Cited by

References

    1. Aebi H. Catalase. In: Bergmeyer H, editor. Methods of Enzymatic Analysis. New York: Academic Press; 1974. pp. 673–684.
    1. Alexander SPH, Benson HE, Faccenda E, Pawson AJ, Sharman JL, Spedding M, et al. The Concise Guide to PHARMACOLOGY 2013/14: Enzymes. Br J Pharmacol. 2013;170:1797–1867. - PMC - PubMed
    1. Azad MB, Chen Y, Gibson SB. Regulation of autophagy by reactive oxygen species (ROS): implications for cancer progression and treatment. Antioxid Redox Signal. 2009;11:777–790. - PubMed
    1. Balogun E, Hoque M, Gong P, Killeen E, Green CJ, Foresti JA, et al. Curcumin activates the haem oxygenase-1 gene via regulation of Nrf-2 and the antioxidant response element. Biochem J. 2003;371:887–895. - PMC - PubMed
    1. Bellezza I, Mierla AL, Minelli A. Nrf-2 and NF-κB and their concerted modulation in cancer pathogenesis and progression. Cancers. 2010;2:483–497. - PMC - PubMed

MeSH terms