

Comparison of 20 nm silver nanoparticles synthesized with and without a gold core: Structure, dissolution in cell culture media, and biological impact on macrophages
- PMID: 26178265
- PMCID: PMC4506304
- DOI: 10.1116/1.4926547
Comparison of 20 nm silver nanoparticles synthesized with and without a gold core: Structure, dissolution in cell culture media, and biological impact on macrophages
Abstract
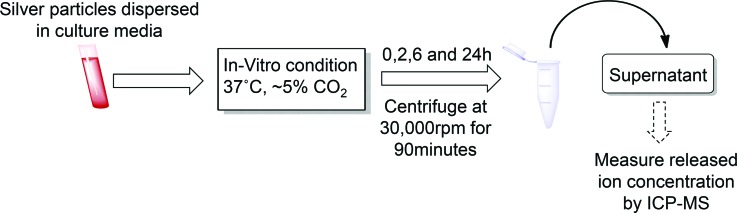
Widespread use of silver nanoparticles raises questions of environmental and biological impact. Many synthesis approaches are used to produce pure silver and silver-shell gold-core particles optimized for specific applications. Since both nanoparticles and silver dissolved from the particles may impact the biological response, it is important to understand the physicochemical characteristics along with the biological impact of nanoparticles produced by different processes. The authors have examined the structure, dissolution, and impact of particle exposure to macrophage cells of two 20 nm silver particles synthesized in different ways, which have different internal structures. The structures were examined by electron microscopy and dissolution measured in Rosewell Park Memorial Institute media with 10% fetal bovine serum. Cytotoxicity and oxidative stress were used to measure biological impact on RAW 264.7 macrophage cells. The particles were polycrystalline, but 20 nm particles grown on gold seed particles had smaller crystallite size with many high-energy grain boundaries and defects, and an apparent higher solubility than 20 nm pure silver particles. Greater oxidative stress and cytotoxicity were observed for 20 nm particles containing the Au core than for 20 nm pure silver particles. A simple dissolution model described the time variation of particle size and dissolved silver for particle loadings larger than 9 μg/ml for the 24-h period characteristic of many in-vitro studies.
Figures


Similar articles
-
Unique cellular interaction of silver nanoparticles: size-dependent generation of reactive oxygen species.J Phys Chem B. 2008 Oct 30;112(43):13608-19. doi: 10.1021/jp712087m. Epub 2008 Oct 3. J Phys Chem B. 2008. PMID: 18831567
-
ISD3: a particokinetic model for predicting the combined effects of particle sedimentation, diffusion and dissolution on cellular dosimetry for in vitro systems.Part Fibre Toxicol. 2018 Jan 25;15(1):6. doi: 10.1186/s12989-018-0243-7. Part Fibre Toxicol. 2018. PMID: 29368623 Free PMC article.
-
All that is silver is not toxic: silver ion and particle kinetics reveals the role of silver ion aging and dosimetry on the toxicity of silver nanoparticles.Part Fibre Toxicol. 2018 Dec 5;15(1):47. doi: 10.1186/s12989-018-0283-z. Part Fibre Toxicol. 2018. PMID: 30518385 Free PMC article.
-
A review of the in vivo and in vitro toxicity of silver and gold particulates: particle attributes and biological mechanisms responsible for the observed toxicity.Crit Rev Toxicol. 2010 Apr;40(4):328-46. doi: 10.3109/10408440903453074. Crit Rev Toxicol. 2010. PMID: 20128631 Review.
-
Silver Nanoparticle-Mediated Cellular Responses in Various Cell Lines: An in Vitro Model.Int J Mol Sci. 2016 Sep 22;17(10):1603. doi: 10.3390/ijms17101603. Int J Mol Sci. 2016. PMID: 27669221 Free PMC article. Review.
Cited by
-
Cardiac Ischemia Reperfusion Injury Following Instillation of 20 nm Citrate-capped Nanosilver.J Nanomed Nanotechnol. 2015 Nov;6(Suppl 6):006. doi: 10.4172/2157-7439.S6-006. Epub 2015 Oct 1. J Nanomed Nanotechnol. 2015. PMID: 26966636 Free PMC article.
-
Provenance information as a tool for addressing engineered nanoparticle reproducibility challenges.Biointerphases. 2016 Oct 19;11(4):04B401. doi: 10.1116/1.4964867. Biointerphases. 2016. PMID: 27936809 Free PMC article.
-
The biocorona: a challenge for the biomedical application of nanoparticles.Nanotechnol Rev. 2017 Aug;6(4):345-353. doi: 10.1515/ntrev-2016-0098. Epub 2017 Jan 20. Nanotechnol Rev. 2017. PMID: 29607287 Free PMC article.
-
Phytochemicals as Dynamic Surface Ligands To Control Nanoparticle-Protein Interactions.ACS Omega. 2018 Feb 28;3(2):2220-2229. doi: 10.1021/acsomega.7b01878. Epub 2018 Feb 22. ACS Omega. 2018. PMID: 30023827 Free PMC article.
-
Modulation of Human Macrophage Responses to Mycobacterium tuberculosis by Silver Nanoparticles of Different Size and Surface Modification.PLoS One. 2015 Nov 18;10(11):e0143077. doi: 10.1371/journal.pone.0143077. eCollection 2015. PLoS One. 2015. PMID: 26580078 Free PMC article.
References
Publication types
MeSH terms
Substances
Grants and funding
LinkOut - more resources
Full Text Sources
Other Literature Sources