. 2015 Jul 16:6:7768.
doi: 10.1038/ncomms8768.

D2HGDH regulates alpha-ketoglutarate levels and dioxygenase function by modulating IDH2

Affiliations

D2HGDH regulates alpha-ketoglutarate levels and dioxygenase function by modulating IDH2

An-Ping Lin et al. Nat Commun. .

Abstract

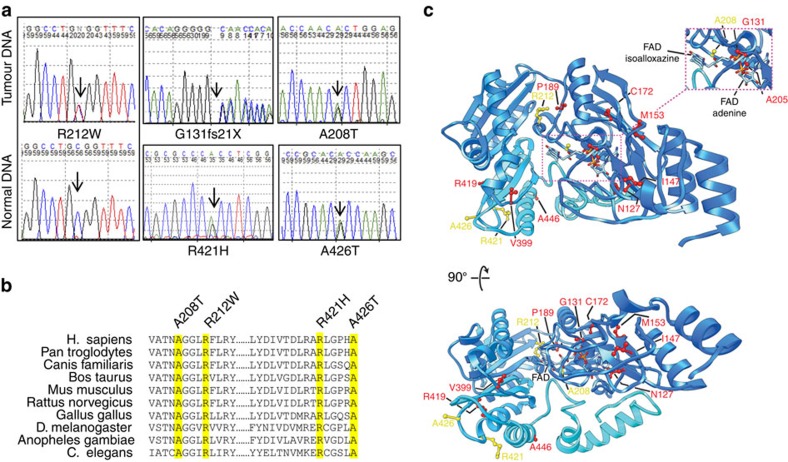
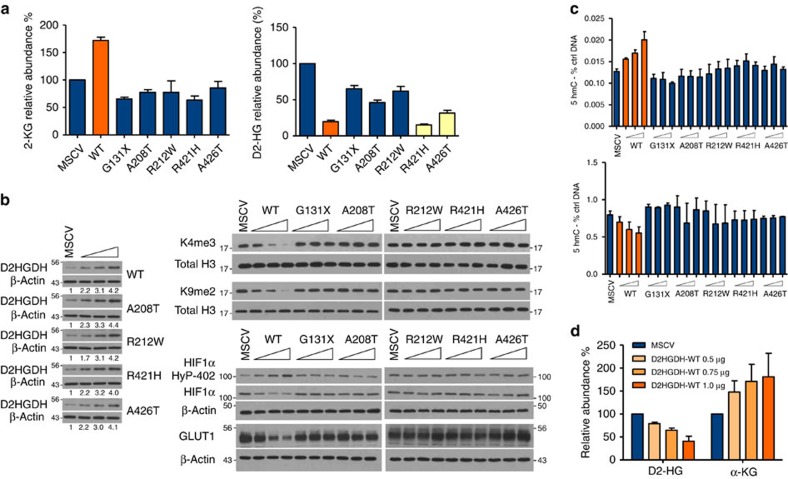
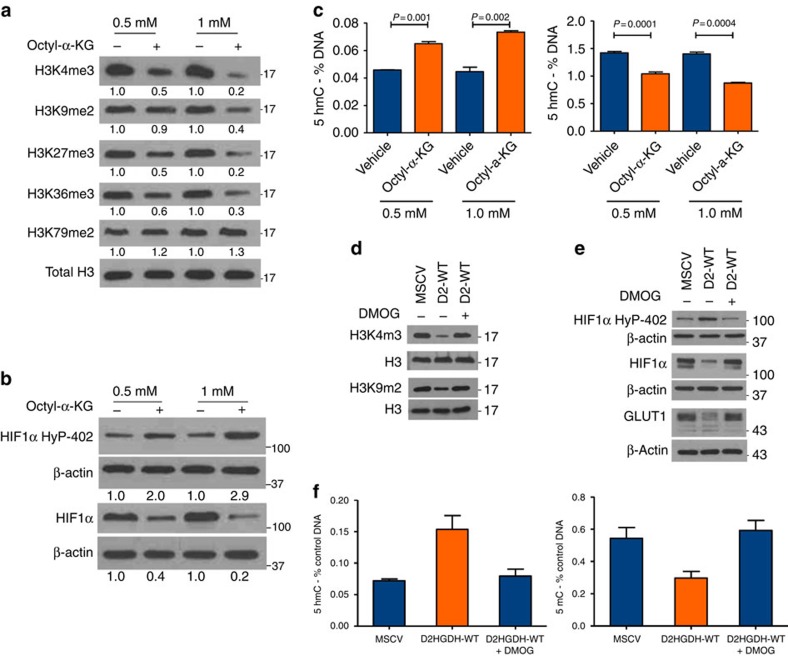
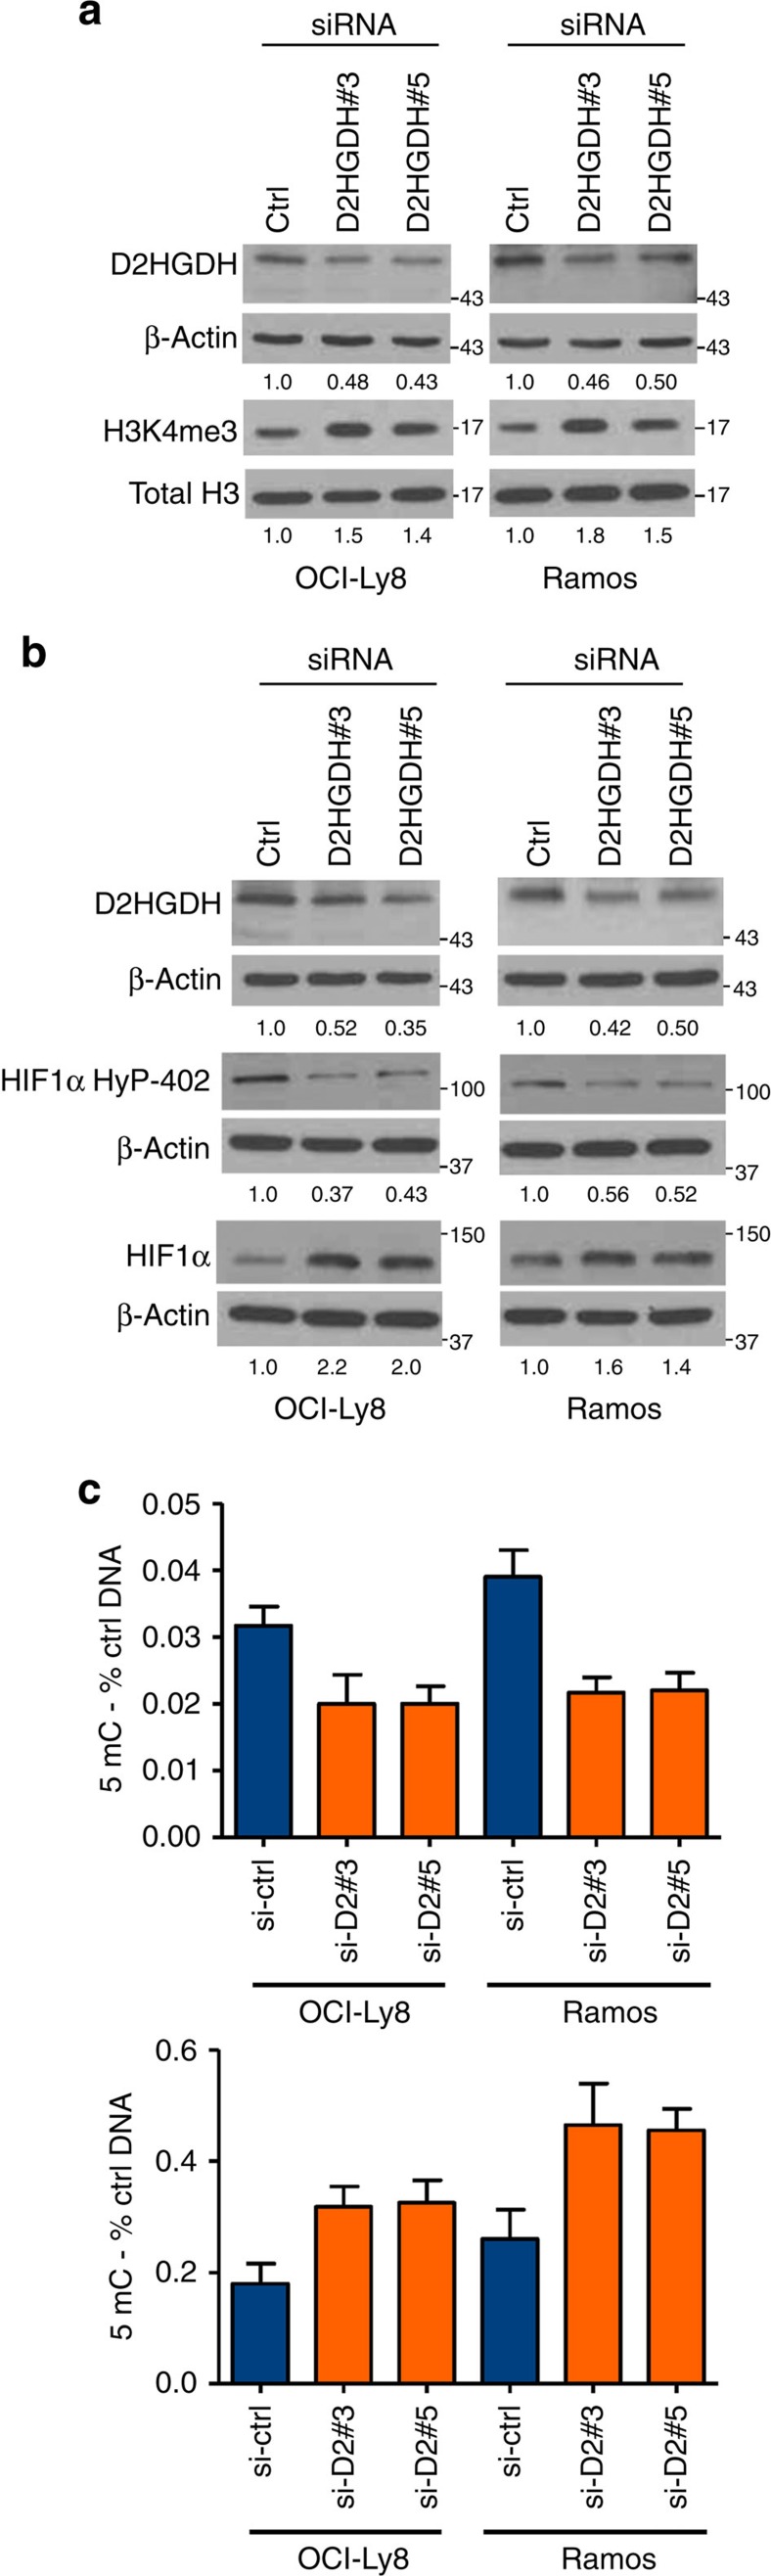
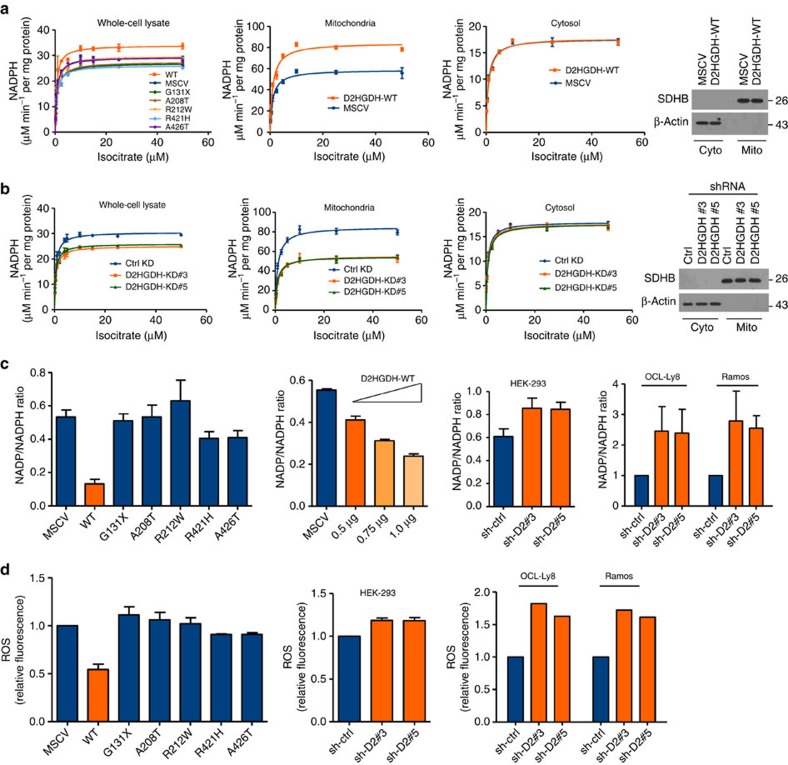
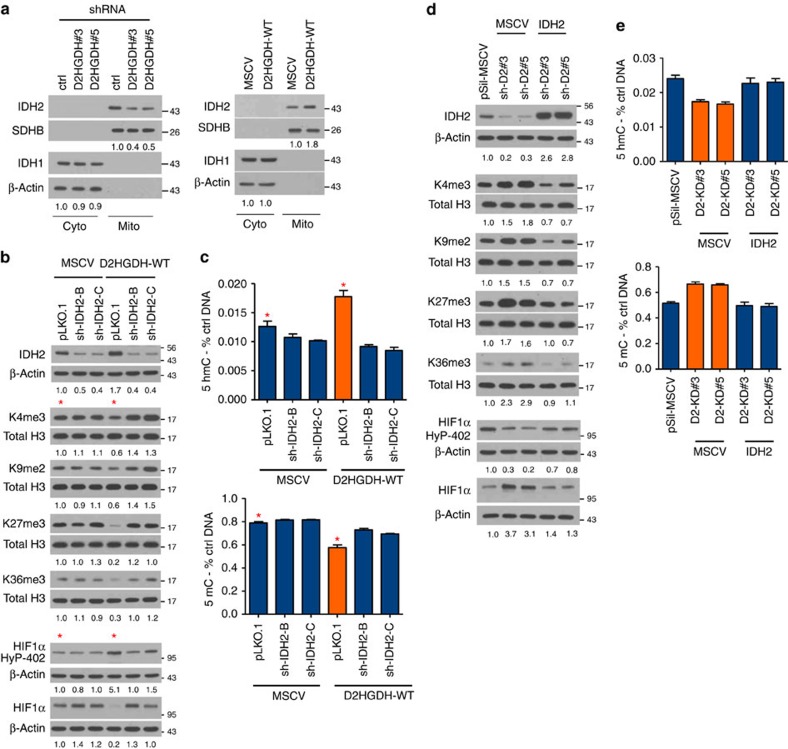
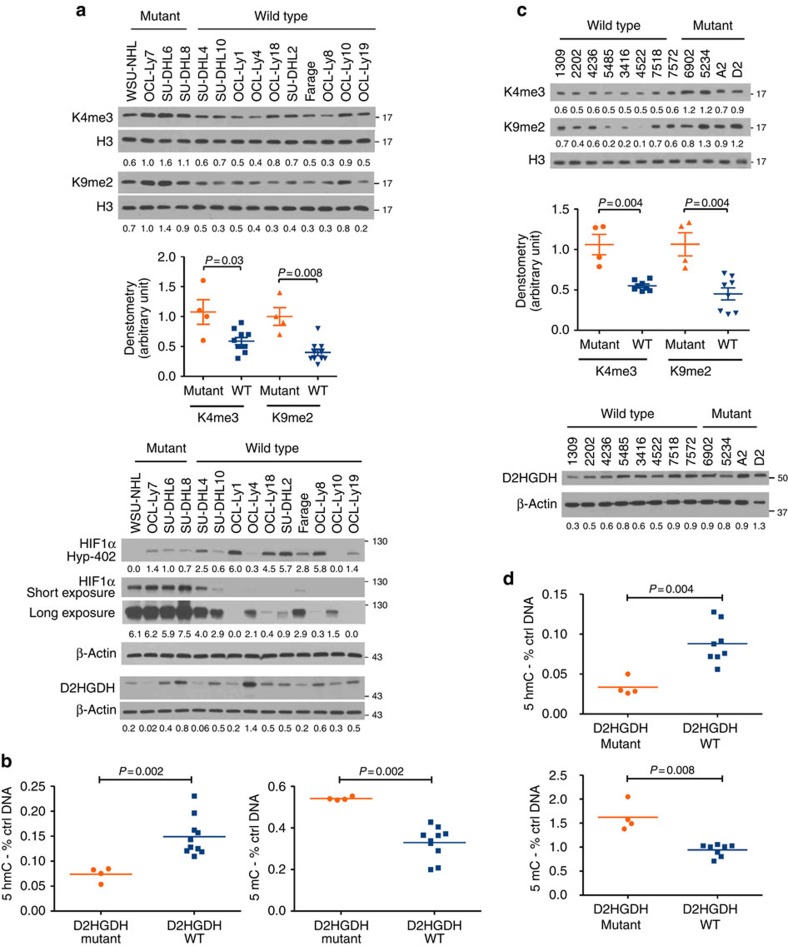
Isocitrate dehydrogenases (IDH) convert isocitrate to alpha-ketoglutarate (α-KG). In cancer, mutant IDH1/2 reduces α-KG to D2-hydroxyglutarate (D2-HG) disrupting α-KG-dependent dioxygenases. However, the physiological relevance of controlling the interconversion of D2-HG into α-KG, mediated by D2-hydroxyglutarate dehydrogenase (D2HGDH), remains obscure. Here we show that wild-type D2HGDH elevates α-KG levels, influencing histone and DNA methylation, and HIF1α hydroxylation. Conversely, the D2HGDH mutants that we find in diffuse large B-cell lymphoma are enzymatically inert. D2-HG is a low-abundance metabolite, but we show that it can meaningfully elevate α-KG levels by positively modulating mitochondrial IDH activity and inducing IDH2 expression. Accordingly, genetic depletion of IDH2 abrogates D2HGDH effects, whereas ectopic IDH2 rescues D2HGDH-deficient cells. Our data link D2HGDH to cancer and describe an additional role for the enzyme: the regulation of IDH2 activity and α-KG-mediated epigenetic remodelling. These data further expose the intricacies of mitochondrial metabolism and inform on the pathogenesis of D2HGDH-deficient diseases.


Figures

Figure 1
Figure 1. D2HGDH mutations in DLBCL.
(a) Sequencing traces representative of each of the five unique mutations found in DLBCL; arrows indicate the nucleotide change, and amino acid substitution is listed at the bottom. Constitutive DNA was available from two patients with D2HGDH mutant tumours (R212W variant), and one case is shown here. The G131fs21X, A208T and R421H mutations were found in cell lines, whereas A426T was found both in primary tumours and cell lines (Supplementary Table 1). (b) All four missense variants identified in DLBCL map to fully conserved residues. (c) Display of the closest structural homologue of human D2HGDH (dehydrogenase from Rhodopseudomonas palustris, PDB 3PM9) identified in the RCSB protein data bank. Orthogonal views of the structure are shown, with the non-covalently bound FAD displayed, as well as sidechains of the residues targeted by missense mutations in DLBCL (shaded yellow) or in D-2-hydroxyglutaric aciduria (shaded red). In both diseases, the mutations clustered to two structural areas—a region of possible contact with the FAD and/or the enzyme's substrate (see expansion subpanel), or an uncharacterized outside loop containing the residues V399, R419, R421, A426 and A446. The structures shown were generated using the programme UCSF Chimera32.
Figure 2
Figure 2. D2HGDH modulates D2-HG and α-KG levels and the readout of dioxygenases function.
(a) Left: LC/MS show that WT-D2HGDH cells have significantly higher α-KG levels than empty-MSCV or mutant D2HGDH expressing isogenic cells (P<0.0001, ANOVA; P<0.05 Bonferroni's multiple comparison post test). Right: expression of WT D2HGDH significantly lowered D2-HG levels in comparison with cells expressing and empty-MSCV or the G131X, A208T and R212W mutants, but not R421H or A426T (yellow bars) (P<0.0001, ANOVA). (b) Left: western blots of D2HGDH in cells transiently transfected with an empty vector (MSCV—1 μg) or increasing amounts (0.5 μg, 0.75 μg and 1 μg) of the WT or mutant enzymes—densitometric quantification confirms the progressive elevation of D2HGDH levels. Right top: western blots of H3K4me3 and H3K9me2 show a progressive decrease in methylation in cells expressing the WT D2HGDH but not the mutant enzymes; right bottom: in hypoxia, expression of WT D2HGDH increases HIF1α hydroxylation (Pro-402), with decrease in its stability, and expression of the transcriptional target GLUT1; expression of mutant enzymes has no effects on HIF1α hydroxylation/expression. (c) WT-D2HGDH cells display a significantly higher abundance of 5hmC marks (top panel, P<0.0001, ANOVA) and concomitant decrease in global DNA methylation (bottom panel, P=0.035, ANOVA). Expression of mutant D2HGDH did not significantly influence 5hmC or 5mC levels. (d) Transient expression of WT D2HGDH significantly decreased D2-HG and increased α-KG levels in a dose-dependent manner (P=0.006 and P=0.0002, respectively, ANOVA). The data shown in a represent the mean and s.d. of assays performed with four or five replicates per sample type, and displayed as relative levels to control cells (MSCV). The transient transfection assays (bd) were performed three to four times. The data shown in c represent mean and s.d. of five data points derived from two biological replicates. The data shown in d represent the mean and s.d. of an assay performed in triplicate, displayed as relative levels to control cells (MSCV); the result from an independent biological replicate is shown in Supplementary Fig. 6.
Figure 3
Figure 3. α-KG mediates the cellular effects of wild-type D2HGDH expression.
(a) Methylation of H3 lysine residues was determined by western blot in HEK-293 exposed to 0.5 mM or 1 mM of octyl-α-KG (or vehicle control) for 6 h. Octyl-α-KG suppressed K4, K9, K27, K36 methylation in a dose-dependent manner. No changes were found in H3K79me2 levels confirming that this residue is not regulated by an α-KG-dependent HDM. (b) Exposure to octyl-α-KG (or vehicle control) in cells grown under hypoxia (1% O2) led to an increase in HIF1α hydroxylation (Pro-402) and consequent decrease in total HIF1α levels. Densitometric quantification is shown at the bottom of the western blots. (c) Octyl-α-KG significantly increased the abundance of 5hmC marks in the DNA (P=0.0001, two-tailed Student's t-test, left panel) and decreased that of 5mC marks (global DNA methylation) (P=0.0001, two-sided Student's t-test, right panel), in a dose-dependent fashion. The data shown in c represent the mean and s.d. of an assay performed in triplicate. Data shown in ac were confirmed with at least one independent biological replicate. (d) HEK-293 cells stably expressing WT D2HGDH were exposed to 1 mM of dimethyloxalylglycine (DMOG) for 6 h, and the methylation levels of H3 lysines verified by western blot. Exposure to DMOG restored K4me3 and K9me2 in D2HGDH-WT cells to the levels found in MSCV control. (e) Hypoxia (1% O2 for 18 h) increases HIF1α hydroxylation (Pro-402) and decreases its stability and activity, defined by GLUT1 expression, in cells expressing WT D2HGDH when compared with isogenic control cells (MSCV); exposure to DMOG fully countered the effects of WT D2HGDH on HIF1α and GLUT1. (f) D2HGDH-WT expressing cells display significantly higher and low abundance of 5hmC (left panel) and 5mC (right panel) marks, respectively, than its isogenic controls expressing an empty MSCV vector (P=0.0008 and P=0.0016 ANOVA). Exposure to DMOG (1 mM for 6 h) reversed the effects of WT D2HGDH back to the MSCV baseline. Experiments shown in d and e were repeated twice, the data in f represent the mean and s.d. of a representative experiment (from two biological replicates) performed in triplicate.
Figure 4
Figure 4. Partial knockdown of D2HGDH in B-cell lymphoma cell lines significantly modifies histone/DNA methylation and HIF1α hydroxylation.
(a) SiRNA-mediated partial knockdown of D2HGDH with two targeting oligonucleotides increased the methylation levels of H3K4me3 in comparison with cells transfected with a control siRNA. (b) Under hypoxia (1% O2, 16 h), B lymphoma cells with partial suppression of D2HGDH expression displayed lower HIF1α hydroxylation and consequent stabilization of total HIF1α. In a and b, the extent of D2HGDH suppression is shown by western blotting and densitometry quantifies all relevant changes. (c) The levels of 5hmC and 5mC (top and bottom panels) were significantly lower and higher, respectively, in cells with a D2HGDH KD when compared with their isogenic controls (P<0.0001, ANOVA, P<0.05 Bonferroni's multiple comparison test for si-ctrl versus si-D2#3 or si-D2#5). The 5hmC and 5mC measurements shown are the mean and s.d. of three data points derived from three biological replicates. The transient knockdown of D2HGDH in these cell lines was repeated three times.
Figure 5
Figure 5. D2HGDH expression influences mitochondrial IDH activity and the cellular redox state.
(a) Left panel: HEK-293 cells stably expressing WT D2HGDH displayed a significantly higher Vmax for IDH than those expressing mutant D2HGDH or an empty vector (P<0.0001, ANOVA). Middle panels: subcellular fractionation demonstrates that D2HGDH increases the Vmax for IDH in the mitochondria, but not in the cytosol; western blots at the right confirm the efficacy of the subcellular separation. (b) Left panel: knockdown of D2HGDH significantly decreased the Vmax for IDH (P<0.0001, ANOVA). Middle panels: subcellular fractionation demonstrates that D2HGDH levels influences exclusively the Vmax for mitochondrial IDH. Western blots at the right confirm the purity of the subcellular fractions. The data are shown as a nonlinear regression (curve fit) and each panel represents mean±s.d. of an assay performed in triplicate. Together with the data shown in Supplementary Fig. 9, the effects of D2HGDH on IDH activity were confirmed in three independent models of D2HGDH KD and two models of D2HGDH ectopic expression. The enzyme kinetics was calculated with the Michaelis–Menten equation. (c) Left: expression of WT D2HGDH significantly lowered NADP/NADPH ratio in comparison with isogenic cells expressing mutant D2HGDH or an empty vector (P=0.017, ANOVA), data shown are mean±s.d. from two biological replicates. Middle: transient expression of WT D2HGDH significantly lowered the NADP/NADPH ratio (P<0.0001, ANOVA); data shown are mean±s.d. of an assay performed in triplicate. Right panels: Stable (HEK-293) or transient (OCI-Ly8 and Ramos) knockdown of D2HGDH significantly increased NADP/NADPH ratio (P=0.01 and P=0.003, ANOVA, for HEK-293 or OCI-Ly8 and Ramos, respectively). Data shown are mean±s.d. of three biological replicates. (d) Left: cells expressing WT D2HGDH displayed significantly lower ROS levels than the isogenic models of mutant D2HGDH or empty-MSCV (P=0.0002, ANOVA); data shown are mean±s.d. from two biological replicates. Stable (middle) or transient (right) KD of D2HGDH in three distinct cell models significantly increased ROS levels (P=0.007, ANOVA, for all comparisons). Data shown at the middle are from two biological replicates; data on the right are from a single assay. In all instances, the Bonferroni's multiple comparison post hoc test yielded a P<0.05).
Figure 6
Figure 6. IDH2 mediates D2HGDH effects on histone and DNA methylation and HIF1α hydroxylation.
(a) Western blot analysis of IDH1 and IDH2 in subcellular fractions of D2HGDH models (knockdown, left panel; ectopic expression, right panel) shows modulation of IDH2 levels. Densitometric quantification is shown at the bottom. (b) Top—western blot analysis of IDH2 KD cells expressing an empty-MSCV vector or WT D2HGDH. Middle—Expression of WT D2HGDH decreased H3K methylation (compare lanes marked with a red star); IDH2 KD restored the H3K methylation levels in these cells. Bottom—expression of WT D2HGDH increased HIF1α hydroxylation and decreased total HIF1α levels (compare lanes marked with a red star); IDH2 KD reversed the increase in HIF1α hydroxylation (and decrease in total HIF1α) associated with expression of D2HGDH WT. (c) Cells expressing D2HGDH-WT (and an empty pLKO.1) displayed a significantly higher abundance of 5hmC marks (top) and a concomitant decrease in global DNA methylation (botton) than MSCV-pLKO.1 controls (marked by red star; P<0.001 two-tailed, Student's t-test). IDH2 KD significantly lowered or increased the levels of 5hmC and 5mC marks, respectively, in D2HGDH-WT cells (P<0.0001, ANOVA, P<0.001 Bonferroni's multiple comparison test), with a more modest change in MSCV-expressing controls. These data are mean and s.d. of an assay performed in triplicate, which was confirmed in an independent biological replicate. The data from the WBs were confirmed in two to three biological replicates. (d) Top—western blot analysis of IDH2 ectopic expression in D2HGDH KD cells. Middle—D2HGDH KD elevated H3K methylation (compare the three first lanes) and this change was abrogated by expression of IDH2. Bottom—D2HGDH KD decreased HIF1α hydroxylation and increased its total levels (compare the three first lanes); these changes were absent in D2HGDH KD cells ectopically expressing IDH2. (e) D2HGDH KD decreased the abundance of 5hmC marks (top) and increased global DNA methylation 5mC (bottom; <0.0001, ANOVA); expression of IDH2 restored these values to that of control (pSIL-MSCV) isogenic cells. These data are mean and s.d. of an assay performed in triplicate, confirmed in a biological replicate. The western blot data shown in d were confirmed in biological replicates.
Figure 7
Figure 7. Cellular effects of D2HGDH mutations in DLBCL.
(a) Methylation of H3 lysine residues and HIF1α hydroxylation/total levels (under hypoxic conditions) were determined by western blot in 14 DLBCL cell lines. H3K4 and K9 methylation were higher, while HIF1α hydroxylation (Hy-HIF1α) was lower (and its total levels consequently higher) in D2HGDH-mutant cell lines when compared with those expressing the WT enzyme. Densitometric quantifications are shown at the bottom of the western blots, and for H3K4me3 and H3K9me2 also in graphic display (mean and s.e.m., Mann–Whitney test). The WB at the bottom displays the expression of D2HGDH across these cell lines. (b) The levels of 5hmC (left) and the 5mC (right) were significantly lower and higher, respectively, in DLBCL cell lines expressing a mutant D2HGDH gene than in the WT cells (P=0.002, two-tailed Mann–Whitney test). The data shown are mean of 3 data points for each cell line (four mutant and ten WT) derived from three independent biological replicates. (c) Western blot analysis of 12 primary DLBCLs (four mutant and eight D2HGDH WT) shows higher H3K4 and H3K9 methylation in mutant lymphomas. Densitometric quantification of H3K4me3 and H3K9me2 (normalized by total H3) is shown below the blots and in graphic display (mean and s.e.m., Mann–Whitney test). The WB at the bottom shows the expression of D2HGDH across these biopsies. (d) The levels of 5hmC (top) and 5Mc marks (bottom) were significantly lower and higher, respectively, in DLBCLs expressing a mutant D2HGDH gene than in the WT tumours (P=0.004 or 0.008, two-tailed Mann–Whitney test). The data shown are mean of three independent measurements for each tumour.

References

    1. Dang L. et al.. Cancer-associated IDH1 mutations produce 2-hydroxyglutarate. Nature 465, 966 (2010) . - PMC - PubMed
    1. Gross S. et al.. Cancer-associated metabolite 2-hydroxyglutarate accumulates in acute myelogenous leukemia with isocitrate dehydrogenase 1 and 2 mutations. J. Exp. Med. 207, 339–344 (2010) . - PMC - PubMed
    1. Ward P. S. et al.. The common feature of leukemia-associated IDH1 and IDH2 mutations is a neomorphic enzyme activity converting alpha-ketoglutarate to 2-hydroxyglutarate. Cancer Cell 17, 225–234 (2010) . - PMC - PubMed
    1. Loenarz C. & Schofield C. J. Expanding chemical biology of 2-oxoglutarate oxygenases. Nat. Chem. Biol. 4, 152–156 (2008) . - PubMed
    1. Lu C. et al.. IDH mutation impairs histone demethylation and results in a block to cell differentiation. Nature 483, 474–478 (2012) . - PMC - PubMed

Publication types

MeSH terms

LinkOut - more resources