

Transgenically-expressed secretoglobin 3A2 accelerates resolution of bleomycin-induced pulmonary fibrosis in mice
- PMID: 26178733
- PMCID: PMC4504078
- DOI: 10.1186/s12890-015-0065-4
Transgenically-expressed secretoglobin 3A2 accelerates resolution of bleomycin-induced pulmonary fibrosis in mice
Abstract
Background: Secretoglobin (SCGB) 3A2, a cytokine-like secretory protein of small molecular weight, is predominantly expressed in airway epithelial cells. While SCGB3A2 is known to have anti-inflammatory, growth factor, and anti-fibrotic activities, whether SCGB3A2 has any other roles, particularly in lung homeostasis and disease has not been demonstrated in vivo. The aim of this study was to address these questions in mice.
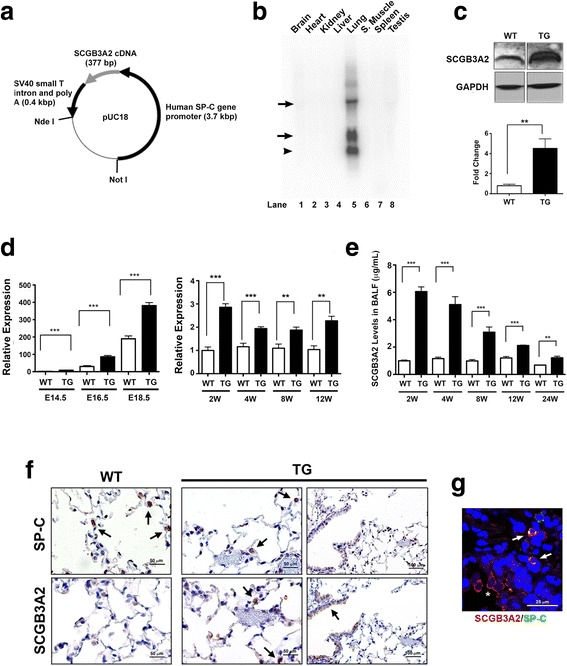
Methods: A transgenic mouse line that expresses SCGB3A2 in the lung using the human surfactant protein-C promoter was established. Detailed histological, immunohistochemical, physiological, and molecular characterization of the Scgb3a2-transgenic mouse lungs were carried out. Scgb3a2-transgenic and wild-type mice were subjected to bleomycin-induced pulmonary fibrosis model, and their lungs and bronchoalveolar lavage fluids were collected at various time points during 9 weeks post-bleomycin treatment for further analysis.
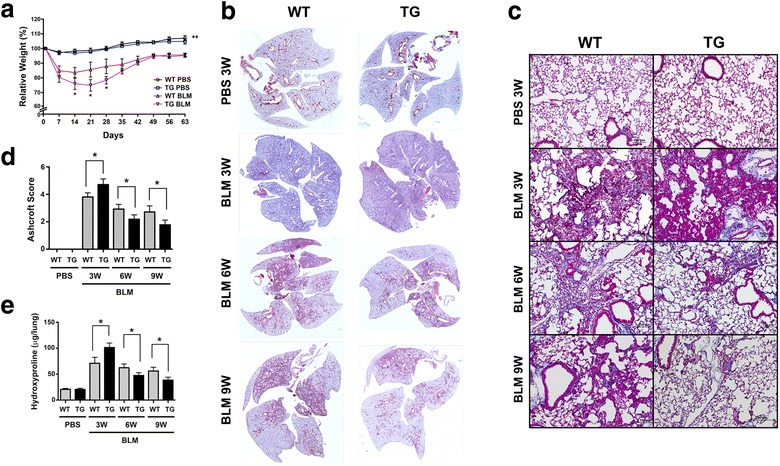
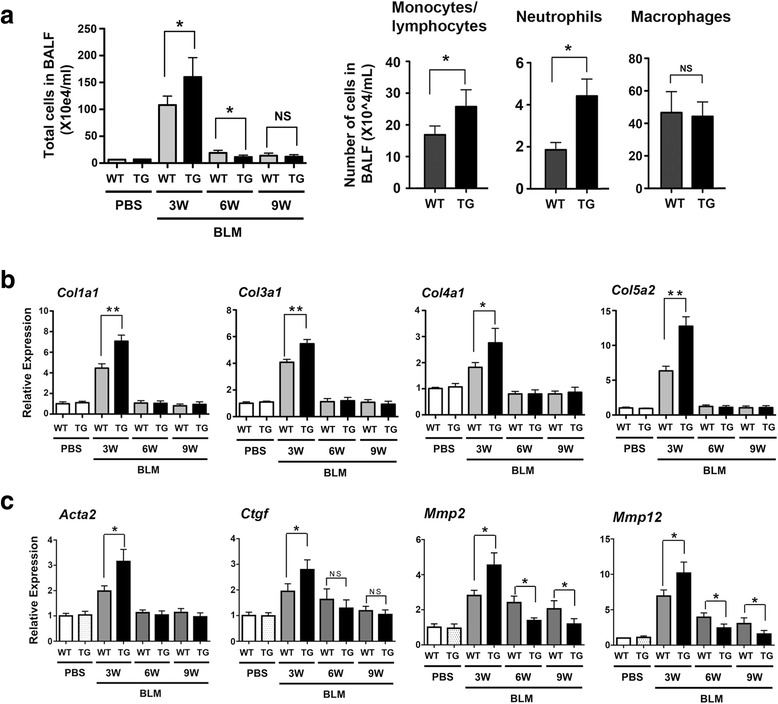
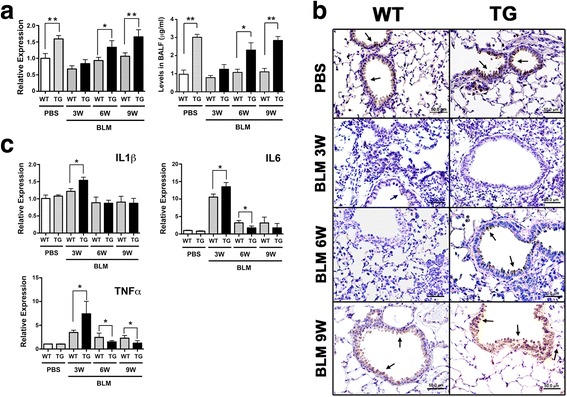
Results: Adult Scgb3a2-transgenic mouse lungs expressed approximately five-fold higher levels of SCGB3A2 protein in comparison to wild-type mice as determined by western blotting of lung tissues. Immunohistochemistry showed that expression was localized to alveolar type II cells in addition to airway epithelial cells, thus accurately reflecting the site of surfactant protein-C expression. Scgb3a2-transgenic mice showed normal lung development and histology, and no overt gross phenotypes. However, when subjected to a bleomycin-induced pulmonary fibrosis model, they initially exhibited exacerbated fibrosis at 3 weeks post-bleomycin administration that was more rapidly resolved by 6 weeks as compared with wild-type mice, as determined by lung histology, Masson Trichrome staining and hydroxyproline content, inflammatory cell numbers, expression of collagen genes, and proinflammatory cytokine levels. The decrease of fibrosis coincided with the increased expression of SCGB3A2 in Scgb3a2-transgenic lungs.
Conclusions: These results demonstrate that SCGB3A2 is an anti-fibrotic agent, and suggest a possible therapeutic use of recombinant SCGB3A2 in the treatment of pulmonary fibrosis.
Figures
Similar articles
-
Secretoglobin 3A2 Exhibits Anti-Fibrotic Activity in Bleomycin-Induced Pulmonary Fibrosis Model Mice.PLoS One. 2015 Nov 11;10(11):e0142497. doi: 10.1371/journal.pone.0142497. eCollection 2015. PLoS One. 2015. PMID: 26559674 Free PMC article.
-
Secretoglobin 3A2 suppresses bleomycin-induced pulmonary fibrosis by transforming growth factor beta signaling down-regulation.J Biol Chem. 2011 Jun 3;286(22):19682-92. doi: 10.1074/jbc.M111.239046. Epub 2011 Apr 10. J Biol Chem. 2011. PMID: 21478551 Free PMC article.
-
Preclinical evaluation of human secretoglobin 3A2 in mouse models of lung development and fibrosis.Am J Physiol Lung Cell Mol Physiol. 2014 Jan 1;306(1):L10-22. doi: 10.1152/ajplung.00037.2013. Epub 2013 Nov 8. Am J Physiol Lung Cell Mol Physiol. 2014. PMID: 24213919 Free PMC article.
-
Emerging role of an immunomodulatory protein secretoglobin 3A2 in human diseases.Pharmacol Ther. 2022 Aug;236:108112. doi: 10.1016/j.pharmthera.2022.108112. Epub 2022 Jan 10. Pharmacol Ther. 2022. PMID: 35016921 Free PMC article. Review.
-
Development of pulmonary fibrosis in fibrinogen-deficient mice.Ann N Y Acad Sci. 2001;936:542-8. doi: 10.1111/j.1749-6632.2001.tb03542.x. Ann N Y Acad Sci. 2001. PMID: 11460513 Review.
Cited by
-
Pediatric Acute Respiratory Distress Syndrome: Fibrosis versus Repair.Front Pediatr. 2016 Mar 30;4:28. doi: 10.3389/fped.2016.00028. eCollection 2016. Front Pediatr. 2016. PMID: 27066462 Free PMC article. Review.
-
Secretoglobin Superfamily Protein SCGB3A2 Alleviates House Dust Mite-Induced Allergic Airway Inflammation in Mice.Int Arch Allergy Immunol. 2016;171(1):36-44. doi: 10.1159/000450788. Epub 2016 Nov 8. Int Arch Allergy Immunol. 2016. PMID: 27820933 Free PMC article.
-
Dysregulation of club cell biology in idiopathic pulmonary fibrosis.PLoS One. 2020 Sep 17;15(9):e0237529. doi: 10.1371/journal.pone.0237529. eCollection 2020. PLoS One. 2020. PMID: 32941426 Free PMC article.
-
Spatiotemporal Expression of Three Secretoglobin Proteins, SCGB1A1, SCGB3A1, and SCGB3A2, in Mouse Airway Epithelia.J Histochem Cytochem. 2019 Jun;67(6):453-463. doi: 10.1369/0022155419829050. Epub 2019 Feb 15. J Histochem Cytochem. 2019. PMID: 30768367 Free PMC article.
-
Association Between Secretoglobin Family 3A Member 2 (SCGB3A2) Gene Polymorphisms and Asthma in a Korean Population.Med Sci Monit. 2017 Apr 19;23:1880-1885. doi: 10.12659/msm.903983. Med Sci Monit. 2017. PMID: 28422086 Free PMC article.
References
-
- Jackson BC, Thompson DC, Wright MW, McAndrews M, Bernard A, Nebert DW, Vasiliou V. Update of the human secretoglobin (SCGB) gene superfamily and an example of ‘evolutionary bloom’ of androgen-binding protein genes within the mouse Scgb gene superfamily. Hum Genomics. 2011;5(6):691–702. doi: 10.1186/1479-7364-5-6-691. - DOI - PMC - PubMed
-
- Niimi T, Keck-Waggoner CL, Popescu NC, Zhou Y, Levitt RC, Kimura S. UGRP1, a uteroglobin/Clara cell secretory protein-related protein, is a novel lung-enriched downstream target gene for the T/EBP/NKX2.1 homeodomain transcription factor. Mol Endocrinol. 2001;15(11):2021–2036. doi: 10.1210/mend.15.11.0728. - DOI - PubMed
-
- Guha A, Vasconcelos M, Cai Y, Yoneda M, Hinds A, Qian J, Li G, Dickel L, Johnson JE, Kimura S, et al. Neuroepithelial body microenvironment is a niche for a distinct subset of Clara-like precursors in the developing airways. Proc Natl Acad Sci U S A. 2012;109(31):12592–12597. doi: 10.1073/pnas.1204710109. - DOI - PMC - PubMed
Publication types
MeSH terms
Substances
Grants and funding
LinkOut - more resources
Full Text Sources
Other Literature Sources
Medical
Molecular Biology Databases
