

Biological effects of fulvestrant on estrogen receptor positive human breast cancer: short, medium and long-term effects based on sequential biopsies
- PMID: 26178788
- PMCID: PMC4879515
- DOI: 10.1002/ijc.29682
Biological effects of fulvestrant on estrogen receptor positive human breast cancer: short, medium and long-term effects based on sequential biopsies
Abstract
We report the first study of the biological effect of fulvestrant on ER positive clinical breast cancer using sequential biopsies through to progression. Thirty-two locally/systemically advanced breast cancers treated with first-line fulvestrant (250 mg/month) were biopsied at therapy initiation, 6 weeks, 6 months and progression and immunohistochemically-analyzed for Ki67, ER, EGFR and HER2 expression/signaling activity. This series showed good fulvestrant responses (duration of response [DoR] = 25.8 months; clinical benefit = 81%). Ki67 fell (p < 0.001) in 79% of tumours by 6 months and lower Ki67 at all preprogression time-points predicted for longer DoR. ER and PR significantly decreased in all tumours by 6 months (p < 0.001), with some declines in ER (serine 118) phosphorylation and Bcl-2 (p = 0.007). There were modest HER2 increases (p = 0.034, 29% tumours) and loss of any detectable EGFR phosphorylation (p = 0.024, 50% tumours) and MAP kinase (ERK1/2) phosphorylation (p = 0.019, 65% tumours) by 6 months. While ER remained low, there was some recovery of Ki67, Bcl-2 and (weakly) EGFR/MAPK activity in 45-67% patients at progression. Fulvestrant's anti-proliferative impact is related to DoR, but while commonly downregulating ER and indicators of its signaling and depleting EGFR/MAPK signaling in some patients, additional elements must determine response duration. Residual ER at fulvestrant relapse explains reported sensitivity to further endocrine therapies. Occasional modest treatment-induced HER2 and weakly detectable EGFR/HER2/MAPK signaling at relapse suggests targeting of such activity might have value alongside fulvestrant in some patients. However, unknown pathways must drive relapse in most. Ki67 has biomarker potential to predict fulvestrant outcome and as a quantitative measure of response.
Keywords: biology; breast cancer; endocrine resistance; fulvestrant.
© 2015 The Authors. Published by Wiley Periodicals, Inc. on behalf of UICC.
Figures
 ,
,  ,
,  ,
,  and
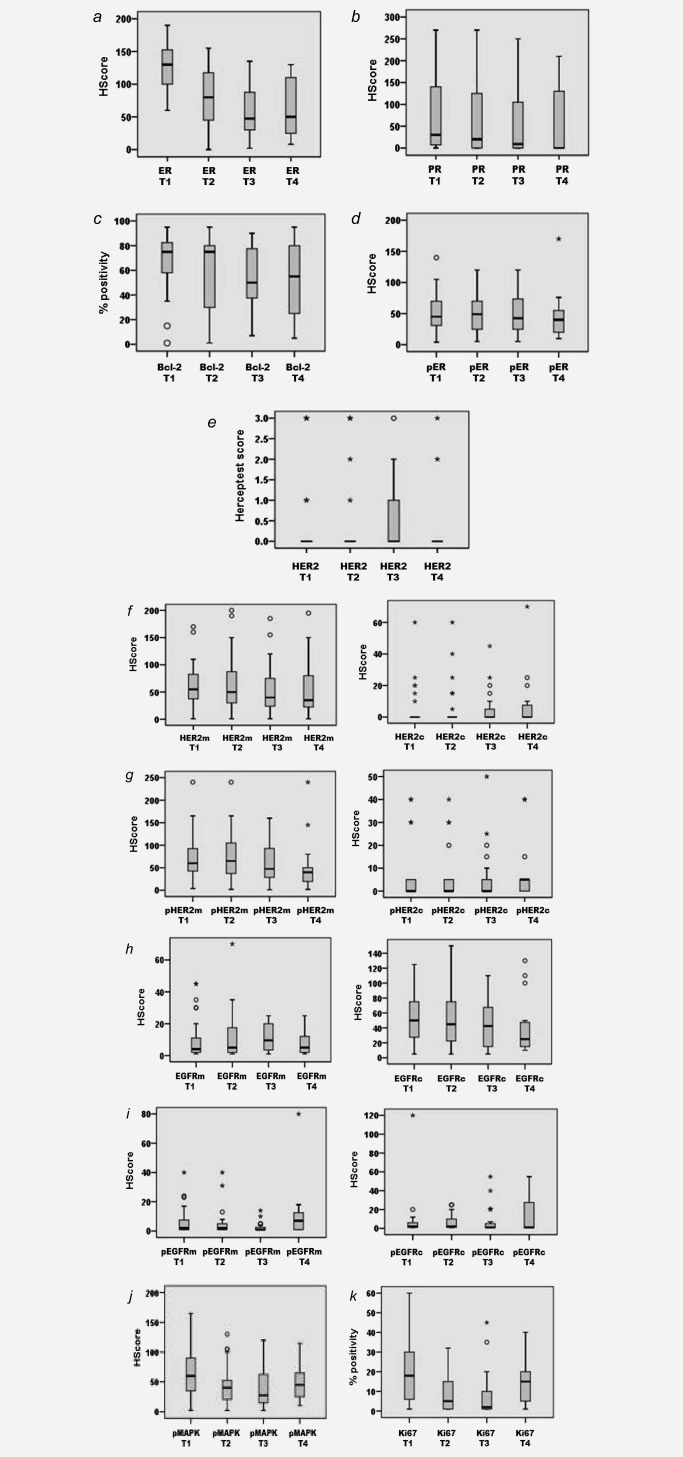
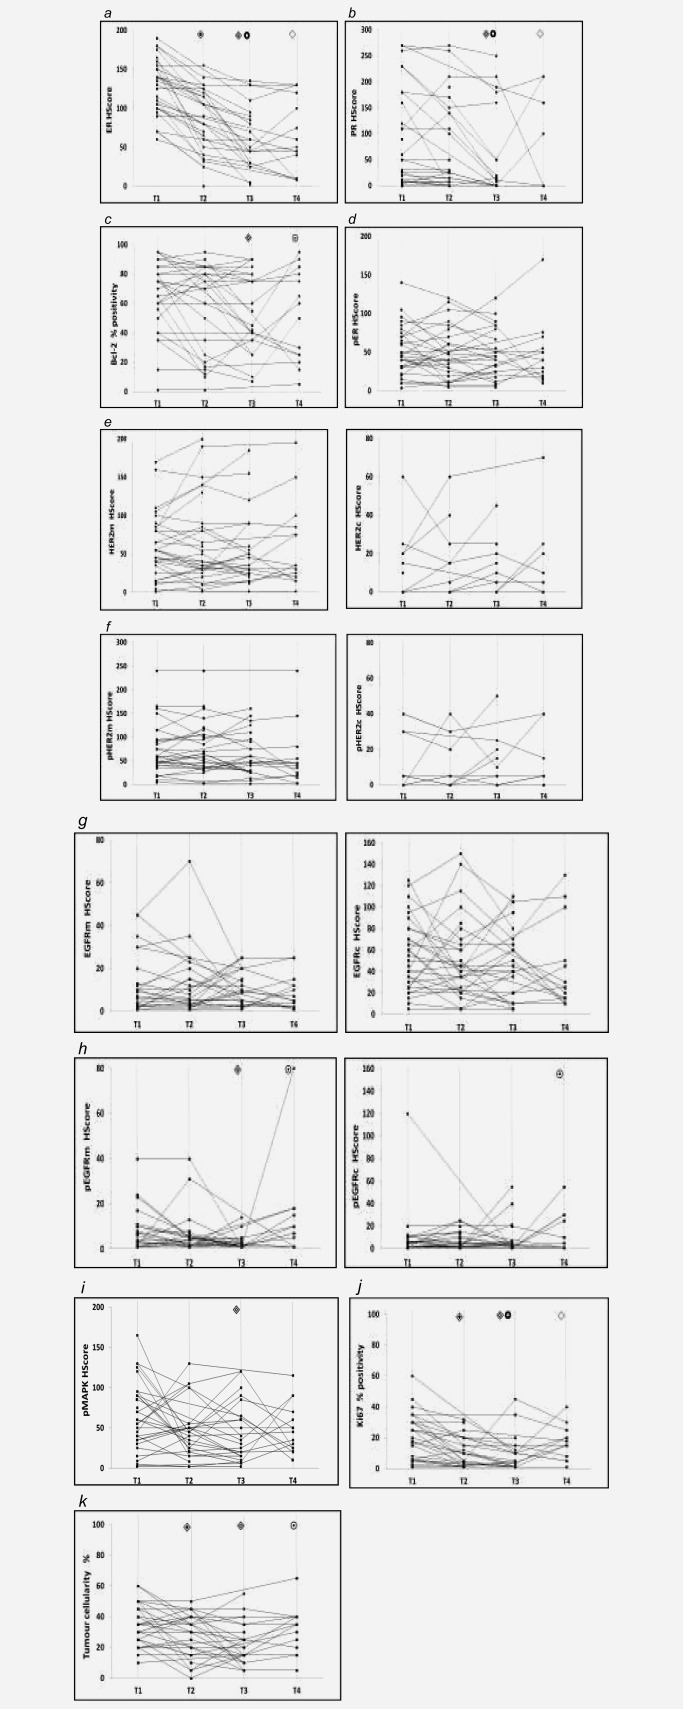
and  , respectively. To aid visualisation of profile over the multiple time‐points in these plots, marker data have been connected in the same patient if any sample was unavailable. (a) ER H Score (T1‐T2, T1‐T3, T2‐T3 falls p < 0.001; T1‐T4 fall p = 0.001); (b) PR H Score (T1‐T3 p < 0.001, T2‐T3 falls p = 0.006; T1‐T4 fall p = 0.012); (c) Bcl‐2% positivity (T1‐T3 fall p = 0.007; T3‐T4 increase p = 0.066); (d) pER (serine 118 phosphorylation) H Score; (e) HER2m (membrane) and HER2c (cytoplasmic) H Scores; (f) pHER2m (membrane) and pHER2c (cytoplasmic) H Scores (NB. no measurable staining was detected in any sample from 20 patients for HER2c and 16 patients for pHER2c); (g) EGFRm (membrane) and EGFRc (cytoplasmic) H Scores; (h) pEGFRm (membrane; T1‐T3 fall p = 0.024; T3‐T4 increase p = 0.012) and pEGFRc H Scores (cytoplasmic; T3‐T4 increase p = 0.041); (i) pMAPK H Score (T1‐T3 fall p = 0.019); (j) Ki67% positivity (T1‐T2 p = 0.001, T1‐T3 p = 0.012, T2‐T3 falls p = 0.048; T1‐T4 fall p = 0.028); (k) Tumour cellularity % (T1‐T2 fall p = 0.019; T1‐T3 fall p = 0.003; T3‐T4 increase p = 0.065).
Similar articles
-
Dose-dependent change in biomarkers during neoadjuvant endocrine therapy with fulvestrant: results from NEWEST, a randomized Phase II study.Breast Cancer Res Treat. 2012 May;133(1):237-46. doi: 10.1007/s10549-011-1947-7. Breast Cancer Res Treat. 2012. PMID: 22286314 Clinical Trial.
-
SERPINA1 is a direct estrogen receptor target gene and a predictor of survival in breast cancer patients.Oncotarget. 2015 Sep 22;6(28):25815-27. doi: 10.18632/oncotarget.4441. Oncotarget. 2015. PMID: 26158350 Free PMC article.
-
Efficacy of fulvestrant in the treatment of postmenopausal women with endocrine-resistant advanced breast cancer in routine clinical practice.Clin Transl Oncol. 2018 Jul;20(7):862-869. doi: 10.1007/s12094-017-1797-9. Epub 2017 Nov 24. Clin Transl Oncol. 2018. PMID: 29178019
-
Aromatase inhibitors: combinations with fulvestrant or signal transduction inhibitors as a strategy to overcome endocrine resistance.J Steroid Biochem Mol Biol. 2005 May;95(1-5):173-81. doi: 10.1016/j.jsbmb.2005.04.004. J Steroid Biochem Mol Biol. 2005. PMID: 15996863 Review.
-
The therapeutic role of fulvestrant in the management of patients with hormone receptor-positive breast cancer.Breast. 2014 Jun;23(3):201-8. doi: 10.1016/j.breast.2014.01.016. Epub 2014 Mar 1. Breast. 2014. PMID: 24589524 Review.
Cited by
-
Plumbagin sensitizes breast cancer cells to tamoxifen-induced cell death through GRP78 inhibition and Bik upregulation.Sci Rep. 2017 Mar 13;7:43781. doi: 10.1038/srep43781. Sci Rep. 2017. PMID: 28287102 Free PMC article.
-
HSP90 inhibitor AUY922 can reverse Fulvestrant induced feedback reaction in human breast cancer cells.Cancer Sci. 2017 Jun;108(6):1177-1184. doi: 10.1111/cas.13238. Epub 2017 May 19. Cancer Sci. 2017. PMID: 28301080 Free PMC article.
-
Lost but Not Least-Novel Insights into Progesterone Receptor Loss in Estrogen Receptor-Positive Breast Cancer.Cancers (Basel). 2021 Sep 23;13(19):4755. doi: 10.3390/cancers13194755. Cancers (Basel). 2021. PMID: 34638241 Free PMC article. Review.
-
Activated zinc transporter ZIP7 as an indicator of anti-hormone resistance in breast cancer.Metallomics. 2019 Sep 1;11(9):1579-1592. doi: 10.1039/c9mt00136k. Epub 2019 Sep 4. Metallomics. 2019. PMID: 31483418 Free PMC article.
-
TACkling Cancer by Targeting Selective Protein Degradation.Pharmaceutics. 2023 Oct 10;15(10):2442. doi: 10.3390/pharmaceutics15102442. Pharmaceutics. 2023. PMID: 37896202 Free PMC article. Review.
References
-
- Wakeling AE. Similarities and distinctions in the mode of action of different classes of antioestrogens. Endocr Relat Cancer 2000;7:17–28. - PubMed
-
- Chia S, Gradishar W, Mauriac L, et al. Double‐blind, randomized placebo controlled trial of fulvestrant compared with exemestane after prior nonsteroidal aromatase inhibitor therapy in postmenopausal women with hormone receptor‐positive, advanced breast cancer: results from effect. J Clin Oncol 2008; 26:1664–70. - PubMed
-
- Howell A, Robertson JFR, Quaresma Albano J, et al. Fulvestrant, Formerly ICI 182,780, Is as effective as anastrozole in postmenopausal women with advanced breast cancer progressing after prior endocrine treatment. J Clin Oncol 2002;20:3396–403. - PubMed
-
- Osborne CK, Pippen J, Jones SE, et al. Double‐blind, randomized trial comparing the efficacy and tolerability of fulvestrant versus anastrozole in postmenopausal women with advanced breast cancer progressing on prior endocrine therapy: results of a North American trial. J Clin Oncol 2002;20:3386–95. - PubMed
Publication types
MeSH terms
Substances
LinkOut - more resources
Full Text Sources
Other Literature Sources
Medical
Research Materials
Miscellaneous
