. 2015 Jul 16:5:12230.
doi: 10.1038/srep12230.

The virus-induced protein APOBEC3G inhibits anoikis by activation of Akt kinase in pancreatic cancer cells

Affiliations

The virus-induced protein APOBEC3G inhibits anoikis by activation of Akt kinase in pancreatic cancer cells

Jia Wu et al. Sci Rep. .

Abstract

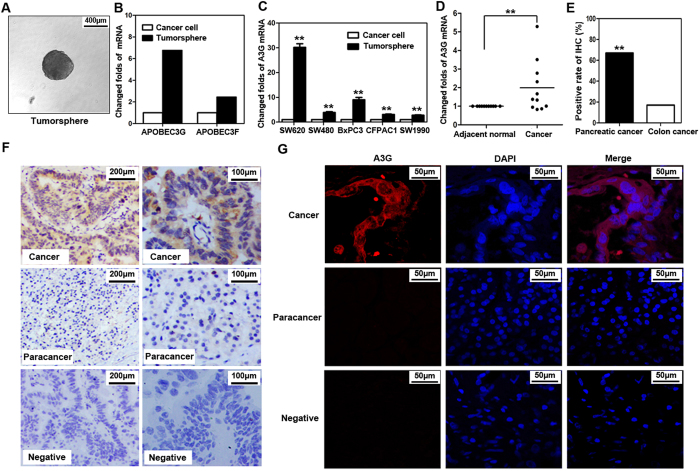
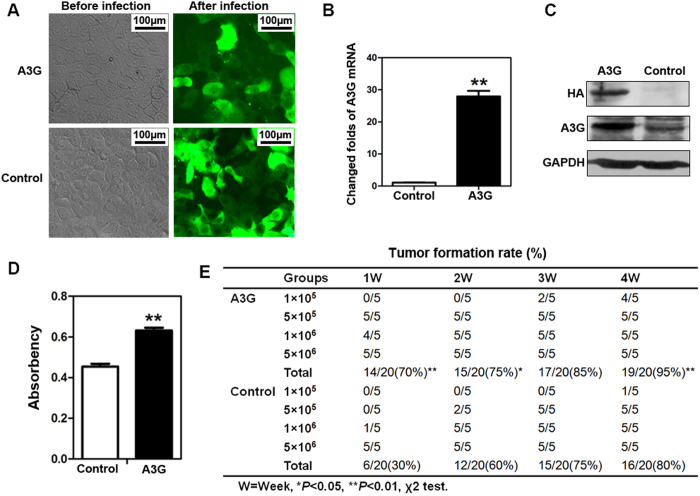
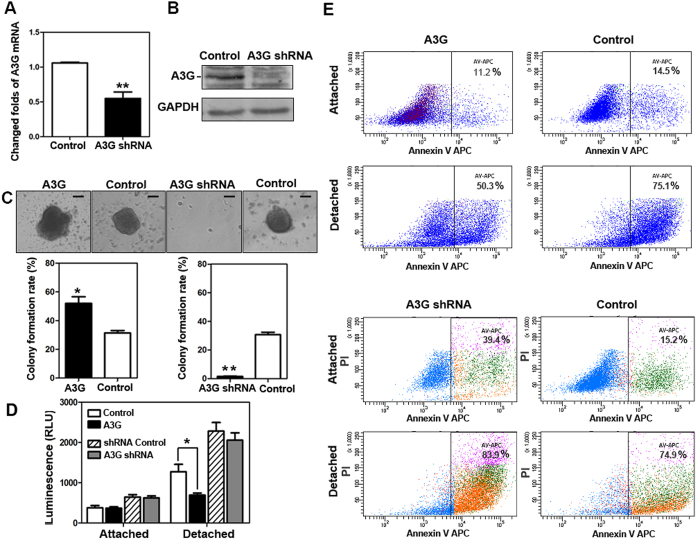
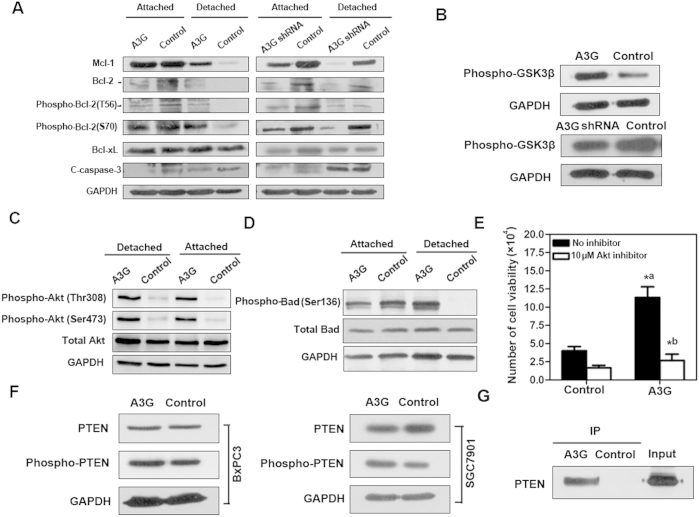
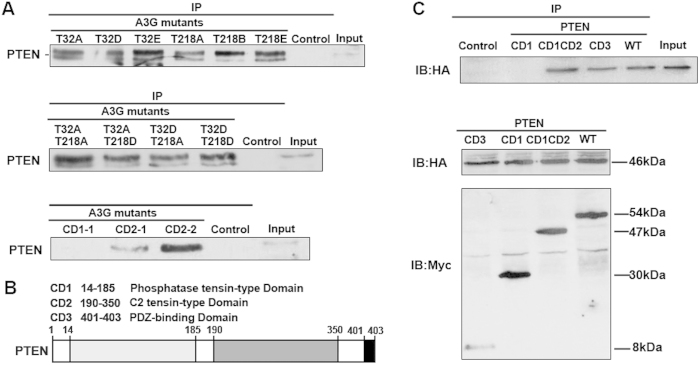
Pancreatic cancer is one of the more common cancers with a poor prognosis. Some varieties of cancer are related to virus infection. As a virus-induced protein, APOBEC3G (A3G) presents extensive anti-virus ability, but the role of A3G in pancreatic cancer was previously unknown. The expression of A3G in pancreatic cancer was examined using TaqMan real-time qPCR, immunohistochemical and immunofluorescent staining. Subsequently, the role of A3G in pancreatic cancer was evaluated in vivo using the tumor xenograft model. Anoikis was detected by colony formation assay and flow cytometry in vitro. The Akt kinase activity and target protein PTEN were examined by co-immunoprecipitation and immunoblot. The virus-induced protein A3G was significantly up-regulated in pancreatic cancer, and the up-regulation of A3G promoted xenograft tumor formation. A3G inactivated PTEN by binding to the C2 tensin-type and PDZ domains, thereby inducing anoikis resistance through Akt activation. Our results demonstrate that the up-regulation of A3G in pancreatic cancer cells induces anoikis resistance, and they provide novel insight into the mechanism by which A3G affects the malignant behavior of pancreatic cancer cells.


Figures

Figure 1
Figure 1. A3G is up-regulated in pancreatic cancer cells.
(A) Tumorsphere formation. SW620 cells were cultured with serum-free cloning media at 37 °C in a 5% CO2 atmosphere. Tumorspheres were observed after 7–10 days (Scale bar 400μm). (B) cDNA expression profile microarray screening. The APOBEC3 family (APOBEC3G and APOBEC3F) were up-regulated in tumorspheres compared with attached cancer cells in cDNA expression profile microarray screening. (C) Real-time qPCR quantification of A3G in cancer cells. The expression of A3G was analyzed using TaqMan real-time qPCR. A3G mRNA was higher in tumorspheres than in attached cancer cells. All data are represented for triplicate experiments (**P < 0.01, Student’s t-test). (D) The expression of A3G in pancreatic cancer tissues. Total RNA was extracted from 11 matched human pancreatic cancer and para-cancerous tissues and subjected to TaqMan real-time qPCR. The expression of A3G in pancreatic cancer tissues was higher than that in para-cancerous tissues (**P < 0.01, Student’s t-test). (E) Expression differences of A3G in colorectal and pancreatic cancer. The expression of A3G in pancreatic cancer was higher than colon cancer in immunohistochemical staining (**P < 0.01, χ2 test). (F) Immunohistochemical staining. Slides from 54 matched human pancreatic cancer and para-cancerous tissues were checked by immunohistochemical staining. The expression of A3G was higher in cancer tissues (ductal) than in para-cancerous tissues (acinar) (Left: Scale bar 200 μm; Right: Scale bar 100 μm). (G) Immunofluorescent staining. Representative immunofluorescent staining showed that A3G was higher in pancreatic cancer tissues and was mainly distributed in the cytoplasm (Scale bar 50 μm).
Figure 2
Figure 2. The overexpression of A3G promotes the xenograft tumor formation rate but inhibits tumor growth in nude mice.
(A) Establishment of stable A3G expressing BxPC3 cells. BxPC3 Cells with stable A3G expression were established by recombinant lentivirus infection (Scale bar 100 μm). (B,C) The detection of A3G in stably expressing BxPC3 cells. Real-time qPCR and western blots revealed that A3G expression was significantly higher in stable A3G-expressing BxPC3 cells than in control cells (**P < 0.01, Student’s t-test). (D) Determination of cell proliferation. Cell proliferation was quantified by MTS assay. The data are represented as the means ± SEM of triplicate experiments (**P < 0.01, Student’s t-test). (E) Overexpression of A3G promotes the tumor formation rate. A3G-expressing BxPC3 cells and control cells were injected subcutaneously into nude Balb/c mice, and mice were followed for 4 weeks. The tumor formation rate was significantly higher in the A3G-expressing group than in controls (*P < 0.05, **P < 0.01, χ2 test).
Figure 3
Figure 3. The up-regulation of A3G induces anoikis resistance.
(A,B) The establishment of stable A3G knockdown BxPC3 cells. BxPC3 cells with stable A3G knockdown were established by recombinant lentiviral infection. Real-time qPCR and western blots revealed that A3G levels were significantly lower in stable A3G knockdown BxPC3 cells than in controls (**P < 0.01, Student’s t-test). (C) A3G expression increases the colony formation rate. Representative images from the colony formation assay for stable A3G-expressing BxPC3 cells and A3G knockdown BxPC3 cells are shown in the upper panels. The colony formation rate of A3G-overexpressing cells was significantly higher than control cells, while the colony formation rate of A3G knockdown cells was significantly lower than control cells. All data are represented as the means ± SEM of triplicate experiments (*P < 0.05, **P < 0.01, ANOVA) (Scale bar 100 μm). (D) Determination of Caspase 3/7 activities. Caspase 3/7 activities were inhibited in stable A3G-expressing cells after detachment (*P < 0.05, Student’s t-test). (E) A3G induces anoikis resistance. Stable A3G-expressing BxPC3 cells and A3G knockdown BxPC3 cells were stained with Annexin V/APC in attached and detached states and were subjected to flow cytometry analyses. In the detached state, stable A3G-expressing cells showed suppressed anoikis (upper 4 panels); meanwhile, stable A3G knockdown cells showed the promotion of anoikis after detachment (lower 4 panels).
Figure 4
Figure 4. A3G promotes anoikis resistance through PTEN-mediated activation of the Akt pathway.
(A) Apoptosis-related proteins are involved in anoikis resistance. Western blot analysis of apoptosis-related proteins in stable A3G-expressing cells, A3G knockdown cells and control cells. Compared with the control cells, the anti-apoptotic proteins Bcl-2, Mcl-1 and phospho-Bcl-2 were up-regulated and cleaved caspase-3 was attenuated in stable A3G-expressing cells after detachment. In contrast, Bcl-2, Mcl-1 and phospho-Bcl-2 were down-regulated in stable A3G knockdown cells. GAPDH was used as a loading control. (B) Akt kinase is activated by A3G. Akt kinase activity was up-regulated in stable A3G-expressing BxPC3 cells. GAPDH was used as a loading control. (C) Detection of phospho-Akt. A3G-expressing cells and control cells were collected and seeded into poly-HEMA-coated 6-well plates in attachment and detachment conditions. The cells were incubated at 37 °C for 24 h. Western blot analysis of Akt in A3G-expressing cells and control cells. Phospho-Akt (Thr308) and phospho-Akt (Ser473) were up-regulated in A3G-expressing cells compared with control cells, both in attachment and detachment. GAPDH was used as a loading control. (D) Detection of phospho-Bad. Western blot analysis of Bad in stable A3G-expressing BxPC3 cells and control cells. Compared with control cells, phospho-Bad (Ser136) was up-regulated in stable A3G-expressing cells after detachment. GAPDH was used as a loading control. (E) Inhibition of Akt decreases anoikis resistance in A3G overexpressing cells. Cell viability of stable A3G-expressing BxPC3 cells after detachment was significantly higher than control (*aP < 0.05; Student’s t-test); cell viability of stable A3G-expressing BxPC3 cells in detached state was remarkably decreased by Akt inhibition (*bP < 0.05; Student’s t-test). All data are represented as the means ± SEM for triplicate experiments. (F) Detection of PTEN. Western blot analysis demonstrated that phospho-PTEN was up-regulated in stable A3G-expressing BxPC3 cells and SGC7901 cells transiently transfected with A3G-HA plasmid. (G) PTEN is a target of A3G-induced Akt activation. Stable A3G-expressing BxPC3 cells were lysed, and A3G was co-immunoprecipitated with HA-tag agarose-conjugated antibodies. Western blot detection of PTEN showed that A3G could interact with PTEN. All data are repeated for three times in the same condition.
Figure 5
Figure 5. The interaction of A3G and PTEN depends on the binding domain.
(A) The binding capacity of A3G and PTEN is related to a zinc-coordinating domain of A3G but not to its phosphorylation state. PTEN was co-immunoprecipitated from 293T cells transfected with different A3G mutants (T32A, T32D, T32E, T218A, T218D, T218E, T32A/T218A, T32A/T218D, T32D/T218A and T32DT218D) and A3G CD mutant plasmids (CD2-1 and CD2–2). PTEN was not co-immunoprecipitated from 293T cells transfected with the A3G CD mutant plasmid CD1-1. All data are repeated for three times in the same condition. (B) Binding domain of PTEN. Shown is an illustration of the PTEN binding domain. (C) Binding capacity is related to the domain of PTEN. The top image shows that A3G HA-tagged protein was co-immunoprecipitated from 293T cells co-transfected with A3G HA-tagged plasmid and PTEN Myc-tagged CD mutant plasmids (CD1CD2, CD3) but not with PTEN CD1 mutant plasmid. The bottom image shows the input of 293T cells co-transfected with A3G HA-tagged plasmid and PTEN Myc-tagged CD mutant plasmids. All data are repeated for three times in the same condition.

Similar articles

Cited by

References

    1. Siegel R., Naishadham D. & Jemal A. Cancer statistics, 2012. CA Cancer J Clin. 62, 10–29 (2012). - PubMed
    1. Michl P. & Gress T. M. Current concepts and novel targets in advanced pancreatic cancer. Gut. 60, 317–326 (2013). - PubMed
    1. Nagaprashantha L. D., Vatsyayan R., Lelsani P. C., Awasthi S. & Singhal S. S. The sensors and regulators of cell-matrix surveillance in anoikis resistance of tumors. Int J Cancer. 128, 743–752 (2011). - PMC - PubMed
    1. Frisch S. M. & Francis H. Disruption of epithelial cell-matrix interactions induces apoptosis. J Cell Biol. 124, 619–626 (1994). - PMC - PubMed
    1. Douma S. et al. Suppression of anoikis and induction of metastasis by the neurotrophic receptor TrkB. Nature. 430, 1034–1039 (2004). - PubMed

Publication types