. 2015 Jul 16:6:7530.
doi: 10.1038/ncomms8530.

The cell cycle regulator 14-3-3σ opposes and reverses cancer metabolic reprogramming

Affiliations

The cell cycle regulator 14-3-3σ opposes and reverses cancer metabolic reprogramming

Liem Phan et al. Nat Commun. .

Abstract

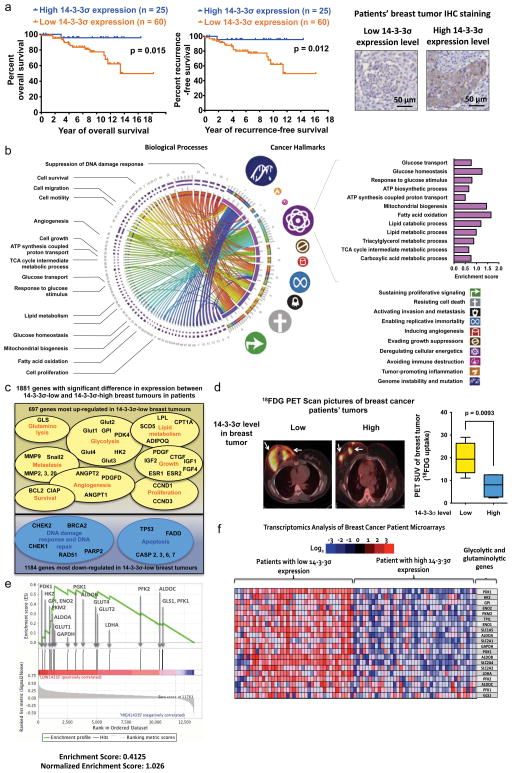
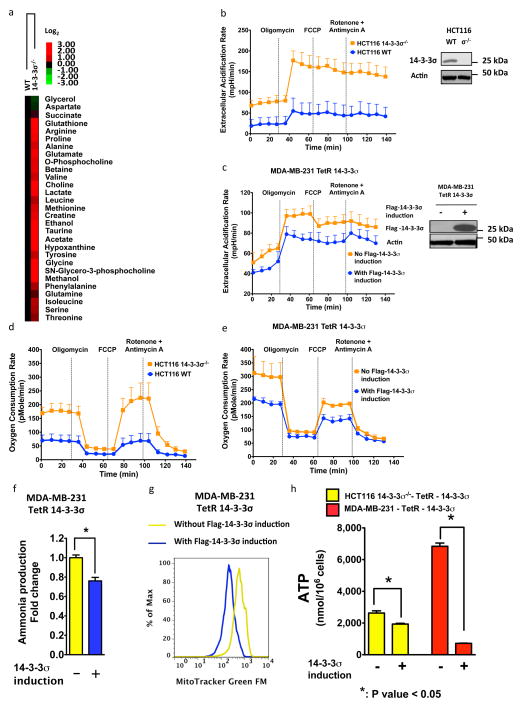
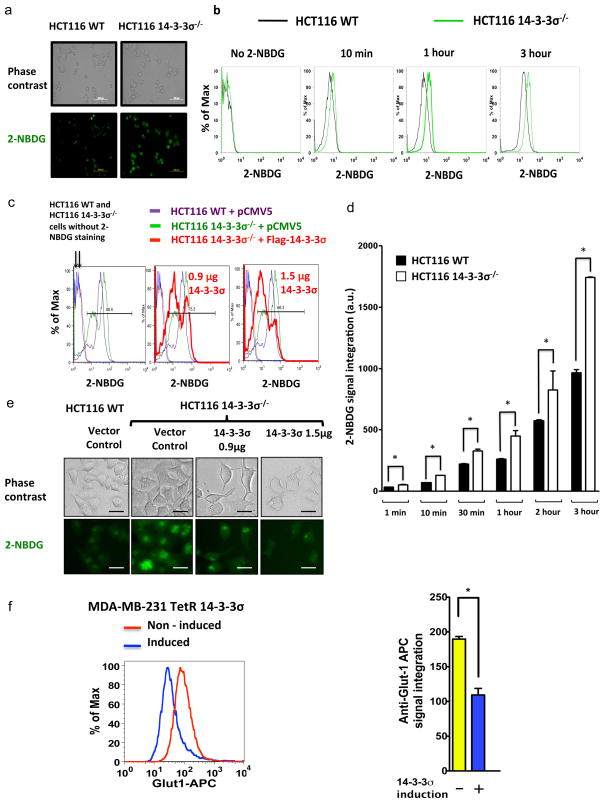
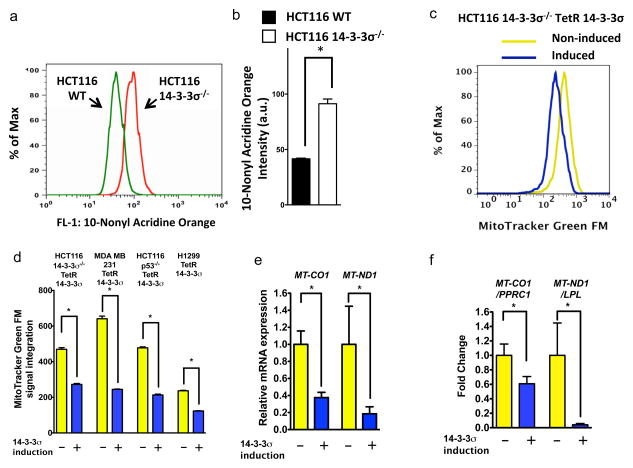
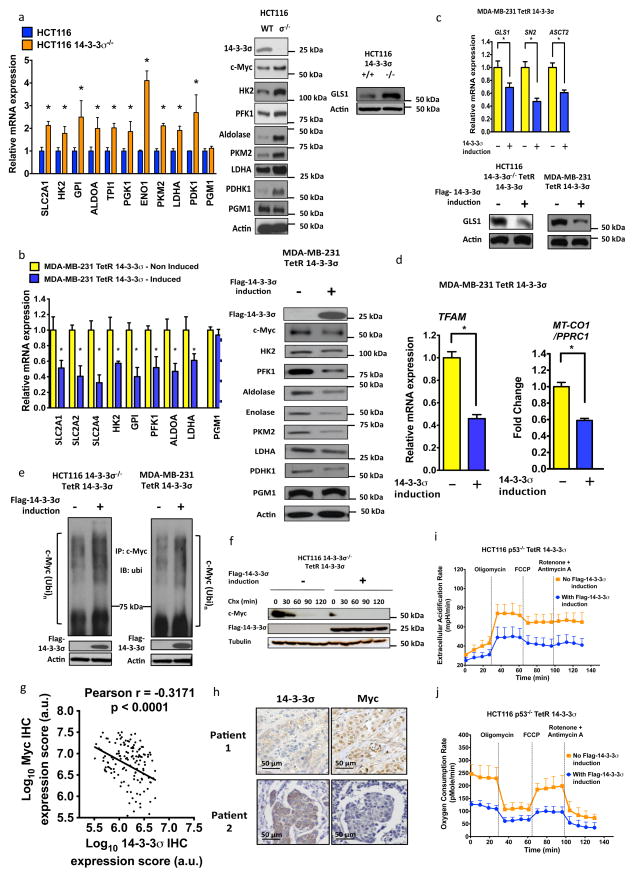
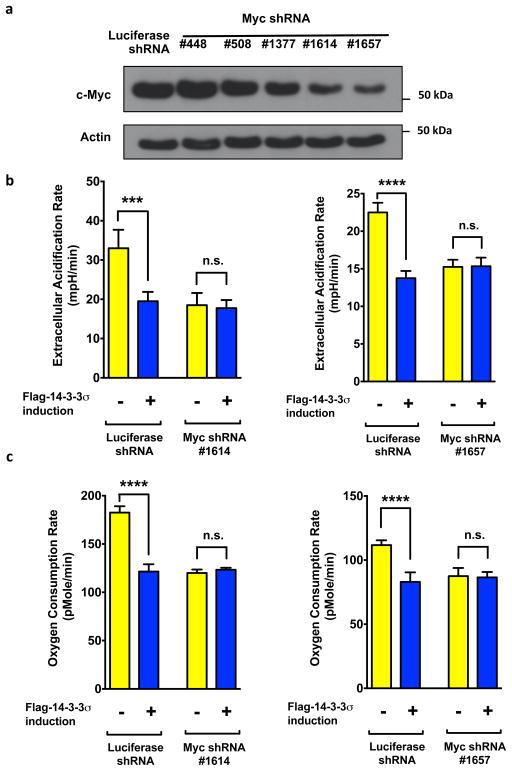
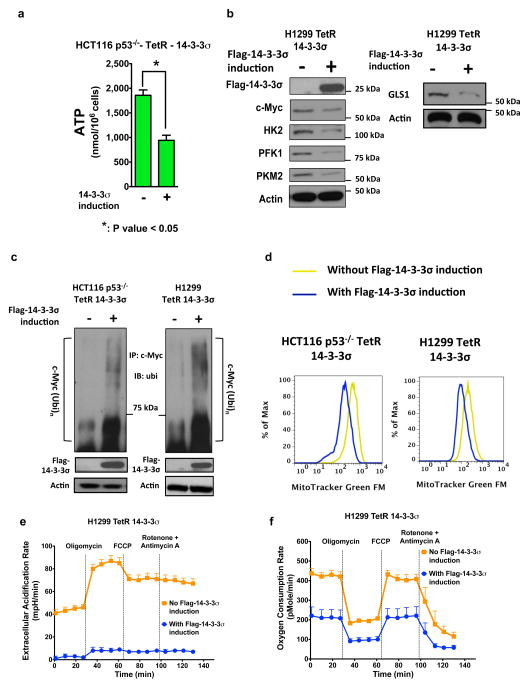
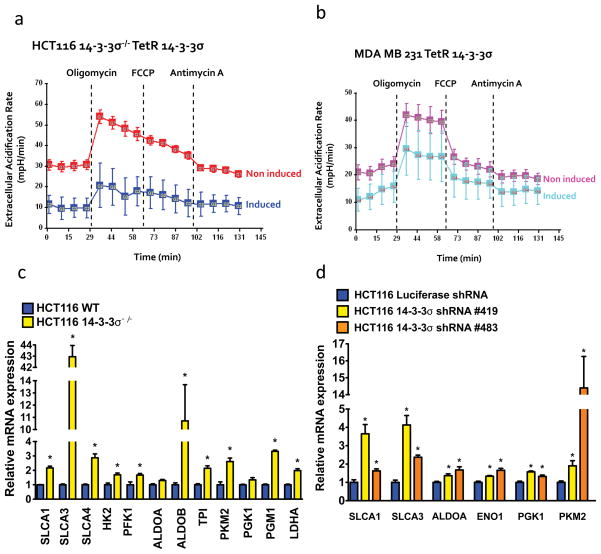
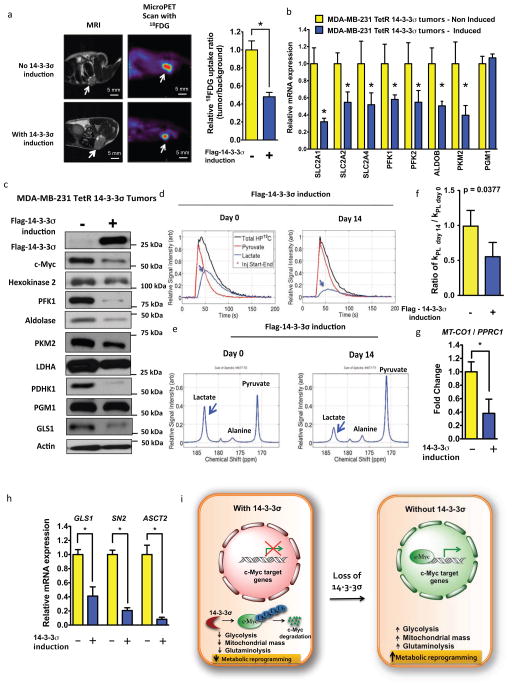
Extensive reprogramming of cellular energy metabolism is a hallmark of cancer. Despite its importance, the molecular mechanism controlling this tumour metabolic shift remains not fully understood. Here we show that 14-3-3σ regulates cancer metabolic reprogramming and protects cells from tumorigenic transformation. 14-3-3σ opposes tumour-promoting metabolic programmes by enhancing c-Myc poly-ubiquitination and subsequent degradation. 14-3-3σ demonstrates the suppressive impact on cancer glycolysis, glutaminolysis, mitochondrial biogenesis and other major metabolic processes of tumours. Importantly, 14-3-3σ expression levels predict overall and recurrence-free survival rates, tumour glucose uptake and metabolic gene expression in breast cancer patients. Thus, these results highlight that 14-3-3σ is an important regulator of tumour metabolism, and loss of 14-3-3σ expression is critical for cancer metabolic reprogramming. We anticipate that pharmacologically elevating the function of 14-3-3σ in tumours could be a promising direction for targeted anticancer metabolism therapy development in future.


Conflict of interest statement

Competing financial interests: The authors declare no competing financial interests.

Figures

Figure 1
Figure 1. The clinical relevance of 14-3-3σ in breast cancer and tumour metabolic reprogramming
(a) High 14-3-3σ expression was associated with prolonged breast cancer patients’ survival. 14-3-3σ protein expression levels in breast cancer patients at MD Anderson Cancer Center were evaluated by immunohistochemistry staining and matched with clinical data. 14-3-3σ protein expression in normal breast tissues was used as a reference to stratify patients. (b) Down-regulation of 14-3-3σ is associated with upregulation of major cancer hallmarks especially deregulation of cellular energetics (i.e., metabolic reprogramming). Transcriptomic profiles of breast cancer patients (cohort GSE20194, n=255, Gene Expression Omnibus database) were analysed by Nexus Expression 3.0 software (BioDiscovery). The gene expression profiles of the lowest 14-3-3σ quartile were compared to those of the highest 14-3-3σ quartile and matched with corresponding biological processes and cancer hallmarks. A Circos map (circos.ca) was used to display the biological processes and cancer hallmarks that were upregulated upon 14-3-3σ down-regulation. The size of cancer hallmarks’ symbols indicated the magnitude of their upregulation upon 14-3-3σ silencing. The bar graph on the upper right corner shows a significant increase in cancer energy metabolism when 14-3-3σ expression is down-regulated. Enrichment scores were calculated based on transcriptomic analysis using Nexus Expression 3.0 program (BioDiscovery). Details about transcriptomic changes associated with 14-3-3σ down-regulation are described in Supplementary Figure X. (c) Low 14-3-3σ expression is associated with increased oncogene expression and reduced tumour suppressors’ levels. This Venn diagram highlights genes and biological processes with significantly changed expression when 14-3-3σ is down-regulated in breast cancer patients’ tumours (cohort GSE20194, n= 255, Gene Expression Omnibus database). (d) High 14-3-3σ expression is accompanied by a decrease in 18FDG uptake by human breast tumours. PET scan data and gene expression profiles of patients’ breast tumours (collected at MDACC) are combined in this analysis to study the impact of 14-3-3σ on tumour glucose uptake in patients. Average±95% confidence interval (CI). (e–f) Gene Set Enrichment Analysis (GSEA, Broad Institute) of breast cancer patients showed upregulation of metabolic genes in breast tumours that expressed a low level of 14-3-3σ compared to breast tumours with high 14-3-3σ expression.
Figure 2
Figure 2. 14-3-3σ inhibits cancer metabolic reprogramming
(a) The broad suppressive impact of 14-3-3σ on cancer metabolism. Nuclear Magnetic Resonance was used to measure the concentrations of important metabolites in HCT116 14-3-3σ+/+ (WT), HCT116 14-3-3σ−/−. (b) 14-3-3σ decreased the extracellular acidification rate (ECAR) of HCT116 in vitro. ECARs were measured by a Seahorse Extracellular Efflux Analyzer XF96 (XF96). Average±standard deviation (SD), n=3, p<0.05. (c) 14-3-3σ reduced the extracellular acidification rate (ECAR) of MDA-MB-231 in vitro. ECARs were measured by XF96. Average±SD, n=3, p<0.05. (d) 14-3-3σ inhibited the oxygen consumption rate (OCR) of HCT116 in vitro. OCRs were measured by XF96. Average±standard deviation (SD), n=3, Student t-test,* P< 0.05. (e) 14-3-3σ diminished the oxygen consumption rate of MDA-MB-231 in vitro. OCRs were measured by XF96. Average±SD, n=3, Student t-test,* P< 0.05 (f) 14-3-3σ inhibited cancer glutaminolysis as measured by ammonia production assays. Cellular lysate of MDA-MB-231 TetR 14-3-3σ cells were collected to measure ammonia production rate using an ammonia production kit (Sigma Aldrich). Average±SD, n=3, Student t-test,* P< 0.05. (g) 14-3-3σ decreased cancer mitochondrial mass of MDA-MB-231 in vitro. MDA-MB-231 TetR 14-3-3σ cells were stained with Mitochondria Tracker Green FM (Molecular Probes, Invitrogen), which stains functional mitochondria. Mitochondrial Tracker Green FM signals were analyzed using a BD Biosciences FACS Canto flow cytometer. FlowJo X software was used to build Mitochondrial Tracker Green FM histograms. Non-induced MDA-MB-231 TetR 14-3-3σ cells were used as a control. (h) Induction of 14-3-3σ expression decreased ATP concentrations in the colorectal cancer cell line HCT116 and the triple negative breast cancer cell line MDA-MB-231 in vitro. HCT116 14-3-3σ−/− TetR 14-3-3σ and MDA-MB-231 TetR 14-3-3σ cancer cells were grown in doxycycline-containing medium (5 ng/ml) for inducing Flag-14-3-3σ expression for 3 days. Non-induced cells were used as a control. Cell lysates from HCT116 14-3-3σ−/− TetR 14-3-3σ cells and MDA-MB-231 TetR 14-3-3σ cells were collected for measuring ATP concentration using an ATP Bioluminescence CLSII kit (Roche) and a luminometer (Biotek). Average±95%CI, n=3, ANOVA,* P< 0.05.
Figure 3
Figure 3. 14-3-3σ reduces glucose uptake of colorectal and breast cancer cells
(a) Microscopic pictures show that loss of 14-3-3σ in HCT116 resulted in marked enhancement of glucose uptake. HCT116 WT (14-3-3σ+/+) and HCT116 14-3-3σ−/− cells were incubated with 2-NBDG, a green fluorescent glucose analogue that is commonly used to measure glucose uptake. 2-NBDG signals were captured by fluorescence microscopy. (b) Flow cytometry analysis indicates a significant increase in glucose uptake of 14-3-3σ–deficient cancer cells. In this experiment, HCT116 WT and HCT116 14-3-3σ−/− cells were incubated with 2-NBDG for the indicated times. 2-NBDG signals were quantified by flow cytometry. Our data point out a considerable enhancement of glucose import activity in cancer cells upon 14-3-3σ suppression. (c) Restoring 14-3-3σ expression in 14-3-3σ–deficient cells decreased glucose uptake in a dose-dependent manner. HCT116 14-3-3σ−/− cells were transfected with increasing amounts of pCMV5-Flag-14-3-3σ. 2-NBDG signals were quantified using a flow cytometer as in (b). (d) Bar graph and statistical analysis of data shown in (c). Data represent means ± 95% confidence interval. ANOVA,* P< 0.05. (e) Representative pictures from a fluorescence microscope for the experiment in (c). (scale bar=50 μm). Forced expression of 14-3-3σ in 14-3-3σ–null cancer cells reduced glucose uptake. (f) Induced 14-3-3σ decreased the expression of glucose transporter Glut1 on the cell membrane surface. Induced and non-induced cells were stained with specific anti-Glut1 antibodies conjugated with APC fluorophore and analyzed by flow cytometry. Bars represent means ± 95% CI; Student t-test, * p < 0.05.
Figure 4
Figure 4. 14-3-3σ reduces mitochondrial mass of cancer cells
(a–b) 14-3-3σ decreased mitochondrial mass of HCT116 colorectal carcinoma cells. HCT116 14-3-3σ+/+ (WT) and HCT116 14-3-3σ−/− cells were stained with 10-nonyl acridine orange (10-NAO) (Molecular Probes, Invitrogen). 10-NAO is an orange dye associated with mitochondrial cardiolipin. Therefore, 10-NAO is frequently used to evaluate total mitochondrial mass. In this experiment, 10-NAO signal was quantified by flow cytometry and is displayed as a histogram (a) and a bar graph (b). Bars represent average ± 95% CI; Student t-test, * p < 0.05.. (c) Restoring 14-3-3σ expression led to a significant decline in mitochondrial mass in HCT116 14-3-3σ−/− cells. Flag-14-3-3σ expression was induced in HCT116 14-3-3σ−/− cells. Non-induced cells were used as a control. All cells were stained with MitoTracker Green FM, a green fluorescent dye used to quantify functional mitochondrial mass. MitoTracker Green FM signals were analyzed by flow cytometry. (d) Bar graph of data from (c) show the suppressive effect of 14-3-3σ on mitochondrial mass of multiple cancer cell lines. Bars represent means ± 95% CI; Student t-test, * p < 0.05. Notably, 14-3-3σ’s inhibitory impact on mitochondrial biogenesis was also observed in p53-deficient cancer cells (HCT116 p53−/− and H1299). (e) 14-3-3σ decreased mitochondrial gene expression. Flag-14-3-3σ expression was induced in HCT116 14-3-3σ−/− TetR 14-3-3σ and MDA-MB-231 TetR 14-3-3σ cells. Real-time PCR was performed using specific primers for the mitochondrial genes MT-CO1 and MT-ND1. Bars represent average ± 95% CI; Student t-test, * p < 0.05. (f) 14-3-3σ diminished mitochondrial DNA copy number. Flag-14-3-3σ expression was induced in HCT116 14-3-3σ−/− TetR 14-3-3σ cells. Non-induced cells were used as a control. The expression ratios of MT-CO1/ PPRC1 and MT-ND1/LPL were quantitated by using real-time PCR. Bars represent average ± 95% CI; Student t-test, * p < 0.05. While MT-CO1 and MT-ND1 genes are located in mitochondrial DNA, PPRC1 and LPL1 are encoded in the nucleus. Therefore, reduction of MT-CO1/ PPRC1 and MT-ND1/LPL ratios reflects a decrease in mitochondrial DNA content or mitochondrial number due to 14-3-3σ.
Figure 5
Figure 5. 14-3-3σ inhibits cancer metabolism by promoting Myc degradation
(a) Loss of 14-3-3σ upregulated Myc-induced glycolytic genes. The expression of glycolytic genes in HCT116 WT (14-3-3σ+/+) and HCT116 14-3-3σ−/− cells were measured using Realtime PCR (left panel). Average±95%CI, n=4, ANOVA,* P< 0.05. Western Blot was performed using the indicated antibodies (right panel). (b) 14-3-3σ downregulated Myc-induced glycolytic genes. The mRNA expression of glycolytic genes were compared between indicated cells using Realtime PCR (left panel). Average±95%CI, n=3, ANOVA,* P< 0.05. Western Blot was performed using the indicated antibodies (right panel). (c) 14-3-3σ reduced expression of Myc-induced glutaminolytic genes. Realtime PCR and Western Blot were used to compare the expression of Myc-induced glutaminolytic genes at mRNA and protein levels. Average±95%CI, n=3, ANOVA,* P< 0.05. (d) 14-3-3σ suppressed TFAM expression and reduced MT-CO1/PPRC1 ratio in vitro. TFAM is an important Myc-induced mitochondrial transcription factor. MT-CO1 is a mitochondrial gene encoding cytochrome c oxidase. PPRC1, peroxisome proliferator-activated receptor gamma, coactivator-related 1, is a gene of nuclear DNA. Average±95% CI, n=3, Student t-test, * p < 0.05. (e) 14-3-3σ increased Myc ubiquitination. Indicated cells were treated with Doxycycline to induce Flag-14-3-3σ expression (+). Non-induced cells were used as a control (−). Cell lysates were immunoprecipitated with anti-Myc antibodies and immunoblotted with anti-ubiquitin antibodies. (f) 14-3-3σ shortened Myc half-life. Flag-14-3-3σ was induced by doxycycline in indicated cells. Cells were treated with 200 μg/ml Cycloheximide (Chx) for the indicated times. Cell lysates are immunoblotted with indicated antibodies. (g) 14-3-3σ expression was inversely correlated with Myc level in 145 patients’ breast tumours. 14-3-3σ and Myc protein expression were quantified from immunohistochemistry (IHC) staining of breast cancer patients tissue microarrays collected at MDACC. Correlation analysis and graph was built using GraphPad Prism software. (h) Representative immunohistochemistry images of (g) showing the negative correlation between 14-3-3σ and Myc protein expression in breast cancer. (i) 14-3-3σ diminished the extracellular acidification rates (ECARs) of HCT116 p53−/− in vitro. ECARs were measured by XF96. Average±SD, n=4, p<0.05. (j) 14-3-3σ diminished the oxygen consumption rates (OCRs) of the p53-deficient colon cancer cell line HCT116 p53−/− in vitro. OCRs were measured by XF96. Average±SD, n=4, p<0.05.
Figure 6
Figure 6. Targeting c-Myc is a mechanism by which 14-3-3σ suppresses cancer metabolic reprogramming
(a) c-Myc expression was knocked down in MDA-MB-231 TetR 14-3-3σ breast cancer cells. (b–c) c-Myc knockdown hindered 14-3-3σ–mediated suppression of cancer metabolic reprogramming. MDA-MB-231 TetR 14-3-3σ cells infected with luciferase shRNA, c-Myc shRNA #1614, or c-Myc shRNA #1657 were treated with doxycycline to induce Flag-14-3-3σ expression (+). Non-induced cells were used as a control (−). ECAR and OCR were measured as previously described. Bars represent means ± 95% CI; Student t-test, * p < 0.05.
Figure 7
Figure 7. 14-3-3σ effectively suppresses metabolic reprogramming in p53-deficient colorectal and lung cancer cells
(a) 14-3-3σ expression decreased energy production in p53-deficient colorectal carcinoma cells. ATP measurements were shown. Bars represent means ± 95% CI; Student t-test, * p < 0.05 (b) 14-3-3σ reduced expression of c-Myc as well as c-Myc glycolytic and glutaminolytic targets in p53-null H1299 lung cancer cells. Flag-14-3-3σ expression was induced in the cells. c-Myc, HK2, PFK1, PKM2, and GLS1 protein levels of induced and non-induced H1299 cells were compared. (c) 14-3-3σ promoted c-Myc polyubiquitination in p53-deficient cancer cells. Flag-14-3-3σ expression was induced in indicated cells (+). Non-induced cells were used as a control (−). Cell lysates were immunoprecipitated with anti-c-Myc antibodies and immunoblotted with anti-ubiquitin (ubi) antibodies. (d) Induction of 14-3-3σ expression reduced mitochondrial mass of p53-null cancer cells. Mitochondria of HCT116 p53−/− TetR 14-3-3σ and H1299 TetR 14-3-3σ cells were stained with MitoTracker Green FM. (e) 14-3-3σ reduced extracellular acidification rate of p53-null H1299 cells. Extracellular acidification rate (ECARs), which reflects glycolytic activity, was measured in induced and non-induced H1299 TetR 14-3-3σ cells. (f) 14-3-3σ suppressed oxygen consumption and mitochondrial respiration in p53-deficient cells. Oxygen consumption and mitochondrial respiration of induced and non-induced H1299 TetR 14-3-3σ were measured.
Figure 8
Figure 8. 14-3-3σ is involved in metabolic regulation under hypoxic condition
(a–b) Induction of Flag-14-3-3σ expression in HCT116 14-3-3σ−/− and MDA-MB-231 cells decreases extracellular acidification rate in hypoxia. HCT116 14-3-3σ−/− TetR 14-3-3σ cells and MDA-MB-231 TetR 14-3-3σ cells were grown in a hypoxic chamber for 48 hours. Flag-14-3-3σ expression was induced for 48 hours by adding doxycycline to the culture medium. Non-induced cells were used as a control. Extracellular acidification rates were measured by a Seahorse Extracellular Flux analyzer XF24 (Seahorse Biosciences). n=3; Average±SD. Student t-test, * p < 0.05. (c–d) Loss or knockdown of 14-3-3σ results in increase in glycolytic gene mRNA expression in hypoxia. HCT116 WT (14-3-3σ+/+), HCT116 14-3-3σ−/−, HCT116 Luciferase shRNA, HCT116 14-3-3σ shRNA #419 and HCT116 14-3-3σ shRNA #483 cells were grown in a hypoxic chamber for 48 hours. Total mRNA of these cells were extracted and converted to cDNA for Real-time PCR reactions with specific primers as indicated above. n=4; Average±95%CI; ANOVA,* P< 0.05.
Figure 9
Figure 9. 14-3-3σ inhibits tumour metabolic reprogramming in vivo.
(a) Doxycycline-induced Flag-14-3-3σ expression results in a remarkable decrease in 18FDG uptake in MDA-MB-231 xenograft breast tumors. MDA-MB-231 TetR 14-3-3σ breast cancer cells were injected into the mammary fat pad of a female nude mouse. 14-3-3σ expression was induced by doxycycline. All mice were then imaged with Magnetic Resonance Imaging and microPET Scan. The white arrows indicate tumor location. The relative 18FDG uptake ratio was calculated. n=5, Average±95%CI, *p<0.05. (b) 14-3-3σ down-regulated Myc-induced glycolytic genes in xenograft breast tumours. After microPET and MRI imaging, tumors were extracted from the mice. Indicated mRNA levels were measured by Realtime PCR.. Average±95%CI, ANOVA,* P< 0.05. (c) 14-3-3σ reduced levels of Myc and Myc-induced glycolytic and glutaminolytic proteins in xenograft tumors. Cell lysates were immunoblotted with the indicated antibodies. (d) 14-3-3σ decelerated [13C]pyruvate-to-[13C]lactate flux in MDA-MB-231 TetR 14-3-3σ xenograft tumours. Pyruvate-to-lactate flux was measured using hyperpolarized 13C-pyruvate tracer and Magnetic Resonance Spectroscopy Imaging, following the time course at day 0 (before Flag-14-3-3σ induction) and day 14 (after Flag-14-3-3σ induction). (e) Magnetic resonance chemical shift spectra of (d) showing Flag-14-3-3σ induction decreased 13C lactate concentration in MDA-MB-231 TetR 14-3-3σ xenograft tumors. (f) Flag-14-3-3σ expression decelerates the rate constant of 13C pyruvate-to-13C lactate reaction in MDA-MB-231 TetR 14-3-3σ xenograft tumors. kPL represents the rate constant of 13C pyruvate-to-13C lactate reaction. The ratio of kPL day 14 / kPL day 0 was calculated. All data is represented as average±95% CI, *p<0.05. (g) Flag-14-3-3σ induction decreased MT-CO1/PPRC1 (mitochondrial DNA/nuclear DNA) ratio in vivo. Average±95%CI, *p<0.05 (h) 14-3-3σ decreased Myc-induced glutaminolytic gene expression in MDA-MB-231 TetR 14-3-3σ xenograft tumors. Indicated mRNA levels were measured by Realtime PCR. Average±95%CI, ANOVA,* P< 0.05. (i) Proposed working model: When 14-3-3σ is present, it promotes Myc degradation and keeps cellular metabolism in check. As tumours evolve, 14-3-3σ is silenced by hypermethylation of its promoter area or by an increase in 14-3-3σ-targeting E3 ubiquitin ligases (e.g., Efp, COP1). After escaping from 14-3-3σ-mediated regulation, Myc is stabilized and reprograms tumour metabolism. Restoring 14-3-3σ’s function in tumours may inhibit cancer bioenergetics and reverse cancer metabolic reprogramming.

References

    1. Hanahan D, Weinberg RA. Hallmarks of cancer: the next generation. Cell. 2011;144:646–674. - PubMed
    1. Yeung SJ, Pan J, Lee MH. Roles of p53, MYC and HIF-1 in regulating glycolysis - the seventh hallmark of cancer. Cell Mol Life Sci. 2008;65:3981–3999. - PMC - PubMed
    1. Vander Heiden MG, Cantley LC, Thompson CB. Understanding the Warburg effect: the metabolic requirements of cell proliferation. Science. 2009;324:1029–1033. - PMC - PubMed
    1. Phan LM, Yeung SC, Lee MH. Cancer metabolic reprogramming: importance, main features, and potentials for precise targeted anti-cancer therapies. Cancer biology & medicine. 2014;11:1–19. - PMC - PubMed
    1. Dang CV, Semenza GL. Oncogenic alterations of metabolism. Trends Biochem Sci. 1999;24:68–72. - PubMed

Publication types

MeSH terms