. 2015 Sep;21(9):1521-31.
doi: 10.1261/rna.051557.115. Epub 2015 Jul 15.

Leveraging transcript quantification for fast computation of alternative splicing profiles

Affiliations

Leveraging transcript quantification for fast computation of alternative splicing profiles

Gael P Alamancos et al. RNA. 2015 Sep.

Abstract

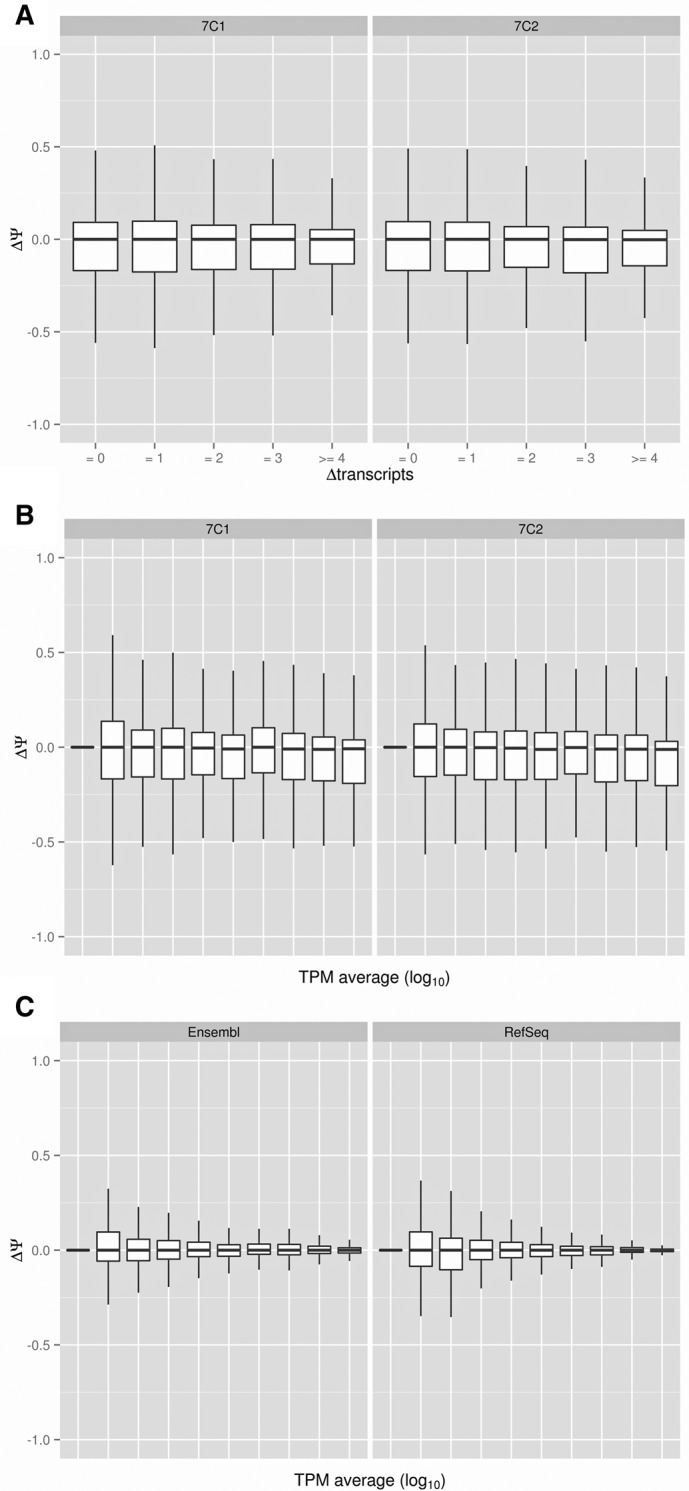
Alternative splicing plays an essential role in many cellular processes and bears major relevance in the understanding of multiple diseases, including cancer. High-throughput RNA sequencing allows genome-wide analyses of splicing across multiple conditions. However, the increasing number of available data sets represents a major challenge in terms of computation time and storage requirements. We describe SUPPA, a computational tool to calculate relative inclusion values of alternative splicing events, exploiting fast transcript quantification. SUPPA accuracy is comparable and sometimes superior to standard methods using simulated as well as real RNA-sequencing data compared with experimentally validated events. We assess the variability in terms of the choice of annotation and provide evidence that using complete transcripts rather than more transcripts per gene provides better estimates. Moreover, SUPPA coupled with de novo transcript reconstruction methods does not achieve accuracies as high as using quantification of known transcripts, but remains comparable to existing methods. Finally, we show that SUPPA is more than 1000 times faster than standard methods. Coupled with fast transcript quantification, SUPPA provides inclusion values at a much higher speed than existing methods without compromising accuracy, thereby facilitating the systematic splicing analysis of large data sets with limited computational resources. The software is implemented in Python 2.7 and is available under the MIT license at https://bitbucket.org/regulatorygenomicsupf/suppa.

Keywords: RNA-seq; splicing; splicing event.


Figures

FIGURE 1.
FIGURE 1.
SUPPA pipeline. (A) SUPPA calculates possible alternative splicing events with the operation generateEvents from an annotation, which can be obtained from a database or built from RNA-seq data using a transcript reconstruction method. For each event, the transcripts contributing to either form of the event are stored and the calculation of the Ψ value per sample for each event is performed using the transcript abundances per sample (TPMs) (Materials and Methods). From one or more transcript quantification files, which can be obtained from any transcript quantification method, SUPPA calculates for each event the Ψ value per sample with the operation psiPerEvent. (B) Events generated from the annotation are given a unique identifier that includes a code for the event type (SE, MX, A5, A3, RI, AF, AL) and a set of start (s) and end (e) coordinates that define the event (shown in the figure) (Materials and Methods). In the figure, the form of the alternative splicing event that includes the region in black is the one for which the relative inclusion level (Ψ) is given: For SE, the PSI indicates the inclusion of the middle exon; for A5/A3, the form that minimizes the intron length; for MX, the form that contains the alternative exon with the smallest start coordinate (the left-most exon) regardless of strand; for RI, the form that retains the intron; and for AF/AL, the form that maximizes the intron length. The gray area indicates the alternative form of the event.
FIGURE 2.
FIGURE 2.
Benchmarking with simulated data. (A) Correlation of the ground-truth Ψ values (Materials and Methods) with those estimated with Sailfish + SUPPA using simulated data. The blue line and gray boundaries are the fitted curves with the LOESS regression method. (B) Cumulative distribution of the absolute difference between the ground-truth Ψ values and the ones estimated with Sailfish + SUPPA (SAILFISH), RSEM+SUPPA (RSEM), MISO and MATS. The lines describe the proportion of all events tested (cumulative percent, y-axis) that are predicted at a given maximum absolute difference from the ground-truth value (ΔΨ, x-axis). Using a rank-sum test, the distributions are significantly different comparing Sailfish + SUPPA and MATS (P-value = 8.89 × 10⁻¹²), Sailfish + SUPPA and MISO (P-value = 1.86 × 10⁻¹³), RSEM + SUPPA and MATS (P-value = 2.72 × 10⁻¹⁶), as well as RSEM + SUPPA and MISO (P-value = 2.2 × 10⁻¹⁶) (Supplemental Table 2).
FIGURE 3.
FIGURE 3.
Benchmarking using experimentally validated events. (A) Correlation of the experimental Ψ values with those estimated with Sailfish + SUPPA in MDA-MB-231 cells with (ESRP1, left panel) and without (EV, right panel) ESRP1 overexpression. Experimental Ψ values were obtained by RT-PCR (Shen et al. 2012) and estimated Ψ values were obtained from RNA-seq data from the same samples (Shen et al. 2012). The blue line and gray boundaries are the fitted curves with the LOESS regression method. (B) Cumulative distribution of the absolute difference between the same experimental Ψ values and the ones estimated with Sailfish + SUPPA (SAILFISH), RSEM + SUPPA (RSEM), MISO, and MATS from RNA-seq data from the same samples (Shen et al. 2012). The lines describe the proportion of all events (cumulative percent, y-axis) that are calculated at a given maximum absolute difference from the RT-PCR value (ΔΨ, x-axis). The distributions are not significantly different from each other (rank-sum test P-values >0.1) (Supplemental Table 2).
FIGURE 4.
FIGURE 4.
Annotation dependencies. Boxplots of the difference of Ψ values estimated by SUPPA for Ensembl and RefSeq annotations from Sailfish quantification (y-axis) as a function of (A) the difference in the number of transcripts defining each event in Ensembl and RefSeq or as a function of (B) the mean expression of the gene in which the event is contained. The x-axis in B is grouped into 10 quantiles according to the log10(TPM) scale. The variability (y-axis) is represented for both replicates (7C1 and 7C2) of the cytosolic RNA-seq data from MCF7 cells. (C) Boxplots of the distribution of Ψ differences (y-axis) between replicates for the estimates from the Ensembl (left panel) and RefSeq (right panel) annotations as a function of the mean expression genes (x-axis), grouped into 10 quantiles in the log10(TPM) scale, using genes with TPM > 0. Mean expression is calculated as the average of the log10(TPM) for each gene in the two replicates for C or for each gene in the two annotations in B.
FIGURE 5.
FIGURE 5.
Annotation-free PSI estimation. Correlation of the experimental Ψ values with those estimated with Cufflinks de novo + SUPPA in MDA-MB-231 cells with (ESRP1, left panel) and without (EV, right panel) ESRP1 overexpression. Experimental Ψ values were obtained by RT-PCR (Shen et al. 2012) and estimated Ψ values were obtained from RNA-seq data in the same samples (Shen et al. 2012). The blue line and gray boundaries are the fitted curves using the LOESS regression method.
FIGURE 6.
FIGURE 6.
Speed benchmarking. (A) Time performance for read assignment/mapping to transcript/genome positions by RSEM, Sailfish, STAR, and TopHat on the synthetic as well as the ESRP1 and EV RNA-seq data sets separately (Materials and Methods). RSEM and Sailfish include the transcript quantification operation. (B) Time performance for the Ψ value calculation from the already mapped reads (MATS, MISO) or quantified transcripts (SUPPA). ESRP1 and EV samples were pooled for this benchmarking (MDA-MB-231). MATS includes the calculation of the ΔΨ between samples and MISO the calculation of the confidence interval, which we could not separate from the Ψ calculation. All tools were run in multithreaded mode when possible. Time reported for all cases is the actual cumulative time the process used across all threads (Materials and Methods).

References

    1. Bechara EG, Sebestyén E, Bernardis I, Eyras E, Valcárcel J. 2013. RBM5, 6, and 10 differentially regulate NUMB alternative splicing to control cancer cell proliferation. Mol Cell 52: 720–733. - PubMed
    1. Behr J, Kahles A, Zhong Y, Sreedharan VT, Drewe P, Rätsch G. 2013. MITIE: simultaneous RNA-Seq-based transcript identification and quantification in multiple samples. Bioinformatics 29: 2529–2538. - PMC - PubMed
    1. Brooks AN, Yang L, Duff MO, Hansen KD, Park JW, Dudoit S, Brenner SE, Graveley BR. 2011. Conservation of an RNA regulatory map between Drosophila and mammals. Genome Res 21: 193–202. - PMC - PubMed
    1. David CJ, Manley JL. 2010. Alternative pre-mRNA splicing regulation in cancer: pathways and programs unhinged. Genes Dev 24: 2343–2364. - PMC - PubMed
    1. Dobin A, Davis CA, Schlesinger F, Drenkow J, Zaleski C, Jha S, Batut P, Chaisson M, Gingeras TR. 2013. STAR: ultrafast universal RNA-seq aligner. Bioinformatics 29: 15–21. - PMC - PubMed

Publication types