. 2015 Jul 16:8:39.
doi: 10.1186/s12920-015-0114-0.

Integrated network analysis and logistic regression modeling identify stage-specific genes in Oral Squamous Cell Carcinoma

Affiliations

Integrated network analysis and logistic regression modeling identify stage-specific genes in Oral Squamous Cell Carcinoma

Vinay Randhawa et al. BMC Med Genomics. .

Abstract

Background: Oral squamous cell carcinoma (OSCC) is associated with substantial mortality and morbidity but, OSCC can be difficult to detect at its earliest stage due to its molecular complexity and clinical behavior. Therefore, identification of key gene signatures at an early stage will be highly helpful.

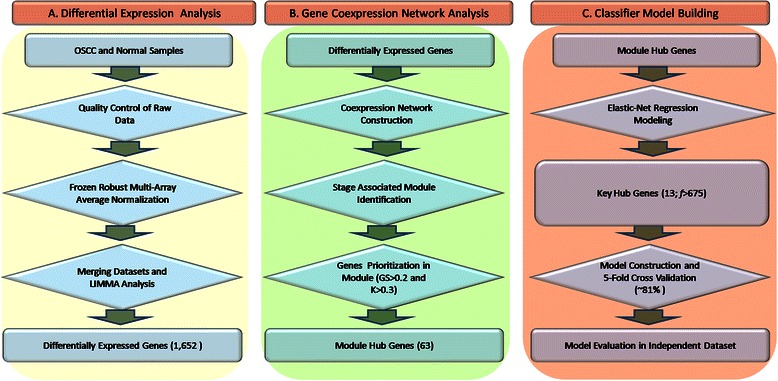
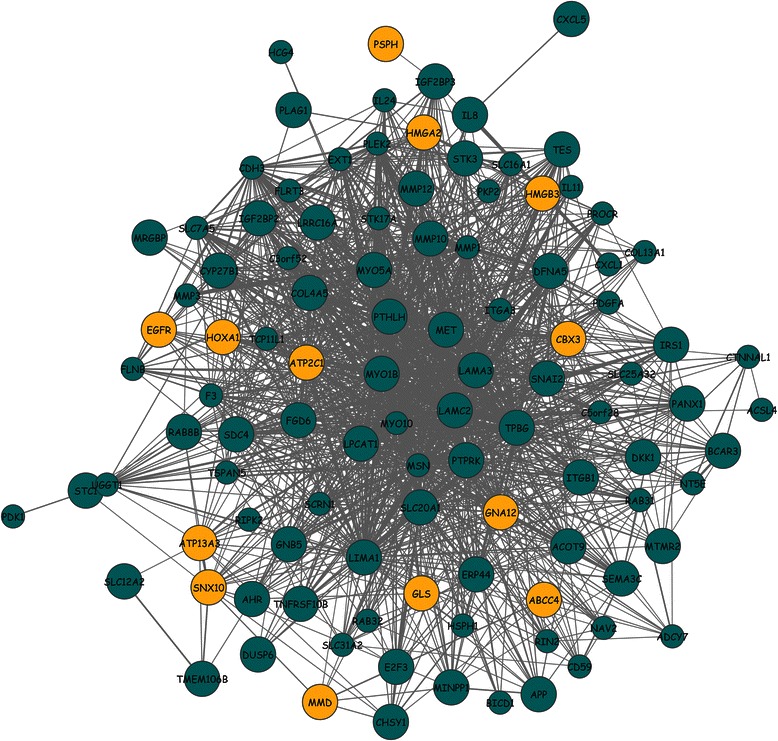
Methods: The aim of this study was to identify key genes associated with progression of OSCC stages. Gene expression profiles were classified into cancer stage-related modules, i.e., groups of genes that are significantly related to a clinical stage. For prioritizing the candidate genes, analysis was further restricted to genes with high connectivity and a significant association with a stage. To assess predictive power of these genes, a classification model was also developed and tested by 5-fold cross validation and on an independent dataset.

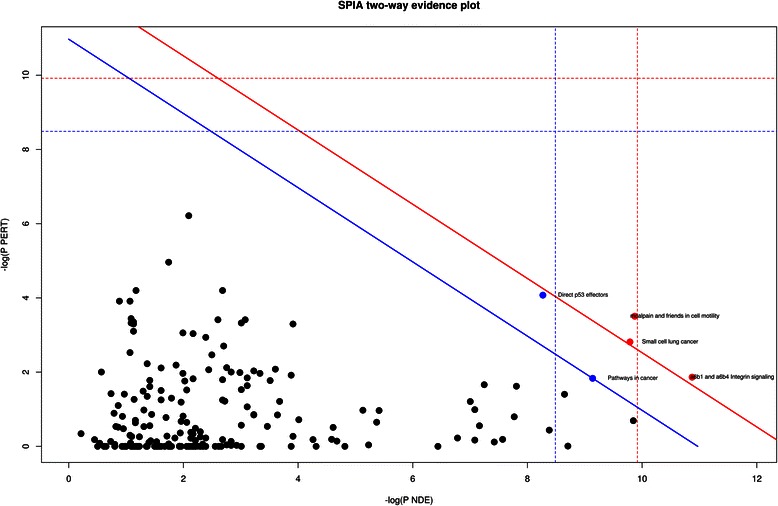
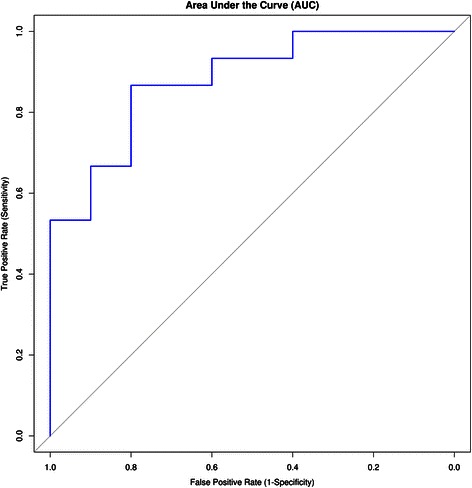
Results: The identified genes were enriched for significant processes and functional pathways, and various genes were found to be directly implicated in OSCC. Forward and stepwise, multivariate logistic regression analyses identified 13 key genes whose expression discriminated early- and late-stage OSCC with predictive accuracy (area under curve; AUC) of ~0.81 in a 5-fold cross-validation strategy.

Conclusions: The proposed network-driven integrative analytical approach can identify multiple genes significantly related to an OSCC stage; the classification model that is developed with these genes may help to distinguish cancer stages. The proposed genes and model hold promise for monitoring of OSCC stage progression, and our findings may facilitate cancer detection at an earlier stage, resulting in improved treatment outcomes.


Figures

Fig. 1
Fig. 1
The steps involved in systems level analysis of data on oral squamous cell carcinoma (OSCC). a Microarray data collection and preprocessing of experiments to identify differentially expressed genes (DEGs). b Construction of the OSCC network and identification of an OSCC stage-associated module and of cancer hub genes. c Development and testing of a key hub gene-based classifier model by 5-fold cross-validation
Fig. 2
Fig. 2
A multidimensional scaling (MDS) plot of the merged gene expression data.a This panel shows that without removal of the batch effect, all samples are clustered by experiment and by platform (not by the biological variable of interest) inside the MDS space. b With intra-platform batch adjustment, the samples are intermingled on the basis of the biological variable. All samples are color coded by biological variables (normal: red, cancer: green), with different symbols corresponding to different studies
Fig. 3
Fig. 3
Module assignments for the expression data on oral squamous cell carcinoma (OSCC). a A gene dendrogram is constructed by average linkage hierarchical clustering. The color row underneath the cluster tree shows module assignment implemented by the dynamic tree cut method.b The Z-summary statistic (y-axis) of the original data modules against 100 random samples is plotted as a function of module size. Each circle represents a module labeled by a color and module name. The dashed redline denotes a significance threshold (Z = 10)
Fig. 4
Fig. 4
Analysis of expression data on oral squamous cell carcinoma (OSCC) in the WGCNA software. WGCNA: Weighted Gene Correlation Network Analysis. Suitability of the pink module is clearly visible.a A heatmap of module eigengenes (MEs) and correlations, where each row represents a module (labeled by color), and each column represents a trait. The value at the top of each square represents Pearson’s correlation coefficient between the MEs and trait, along with the associated p-value in parentheses. The red and blue colors represent a strong positive and negative correlation, respectively, between a ME and a trait. b Module significance (MS) of all modules, with pink at the top of the plot, indicating that expression profiles of the pink module are strongly associated with the trait. c Analysis of topological robustness of the pink module via plotting of a simultaneous node deletion against changes in the size of the largest component, σ(ρ), when the fraction ρ of the vertices (nodes) was removed. The results indicate network robustness. d The plot of gene significance (GS iGS) against scaled connectivity (K i) where each point (“darkgolden” and “darkcyan”) corresponds to a gene in the pink module. Intramodular connectivity significantly correlated with gene significance (r = 0.36, p = 8.3 × 10−5). All large labeled nodes (GS i >0.2 and K i > 0.3) are the identified hubs. Among these, darkgolden nodes represent hubs with the strongest correlation with the phenotype (GS i >0.2, K i > 0.3, and f >675); these hubs represent “key hub genes”
Fig. 5
Fig. 5
Visualization of hub genes in the pink module network. All gene-to-gene correlations were selected in the pink module, and the network was visualized by means of the Cytoscape software. Edge (grey) width is proportional to the weight of the correlation between two genes. All large labeled nodes are the identified hubs (gene significance [GS iGS] >0.2 and scaled connectivity [K i] > 0.3), whereas darkgolden nodes represent hubs that show the strongest correlations with the phenotype (these are “key hub genes”)
Fig. 6
Fig. 6
Significantly enriched pathways among the hub genes. A two-way evidence plot of signaling-pathway impact analysis (SPIA) for each pathway is represented by one dot. Pathways on the right of the red oblique line (red dots) are statistically significant at the 1 % threshold after Bonferroni correction of global p-values (PG) obtained by combining (by Fisher’s method) over-representation of differentially expressed genes (DEGs) in a given pathway (PPERT) and an abnormal perturbation of the pathway (PNDE). The pathways on the right of the blue oblique line (blue dots) are statistically significant after false discovery rate (FDR) correction of PG
Fig. 7
Fig. 7
The plot of a receiver-operating characteristic (ROC) curve. The average area under the curve (AUC) of ~0.81 denotes the accuracy of the signature of key hub genes in the test dataset. The ROC curve depicts a true positive rate (sensitivity) versus a false positive rate (one minus specificity). The diagonal line in the ROC plot has an AUC value of 0.5, representing the predictive power of a random guess. The graph was rendered in the ROCR software

Similar articles

Cited by

References

    1. Siegel R, Naishadham D, Jemal A. Cancer statistics. CA Cancer J Clin. 2012;62:10–29. doi: 10.3322/caac.20138. - DOI - PubMed
    1. Jemal A, Bray F, Center MM, Ferlay J, Ward E, Forman D. Global cancer statistics. CA Cancer J Clin. 2011;61:69–90. doi: 10.3322/caac.20107. - DOI - PubMed
    1. Tiziani S, Lopes V, Günther UL. Early stage diagnosis of oral cancer using 1H NMR-based metabolomics. Neoplasia. 2009;11:269–276. doi: 10.1593/neo.81396. - DOI - PMC - PubMed
    1. Centers for Disease Control and Prevention: Improving diagnoses of oral cancer. :13–16.
    1. Ye H, Yu T, Temam S, Ziober BL, Wang J, Schwartz JL, et al. Transcriptomic dissection of tongue squamous cell carcinoma. BMC Genomics. 2008;9:69. doi: 10.1186/1471-2164-9-69. - DOI - PMC - PubMed

Publication types