. 2015 Sep 15;26(18):3245-62.
doi: 10.1091/mbc.E15-06-0366. Epub 2015 Jul 15.

Rho1- and Pkc1-dependent phosphorylation of the F-BAR protein Syp1 contributes to septin ring assembly

Affiliations

Rho1- and Pkc1-dependent phosphorylation of the F-BAR protein Syp1 contributes to septin ring assembly

Laura Merlini et al. Mol Biol Cell. .

Abstract

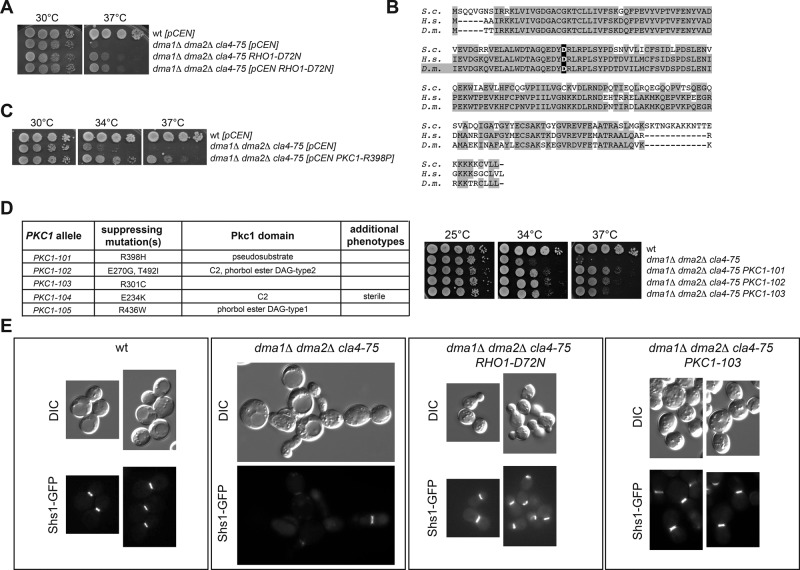
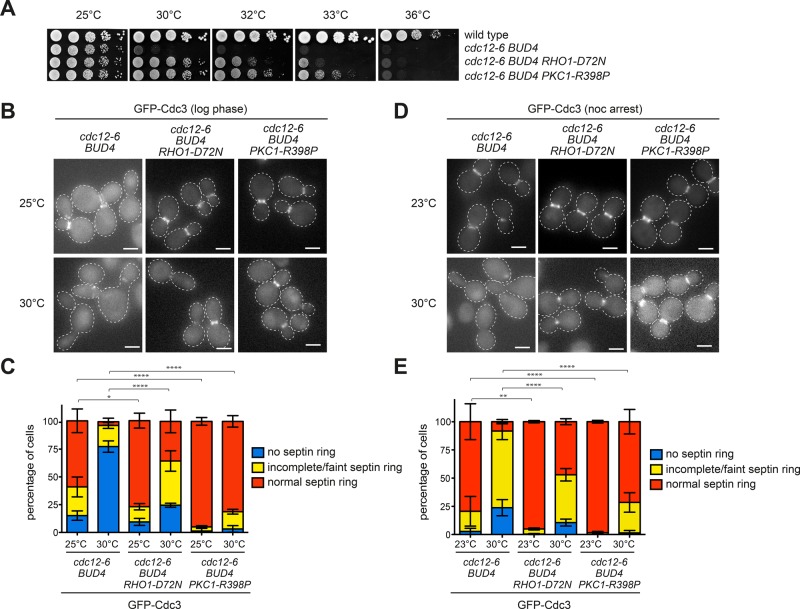
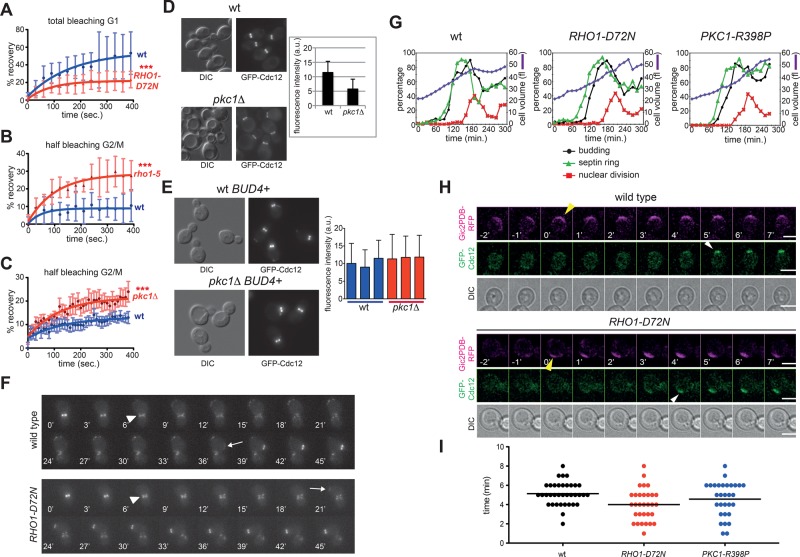
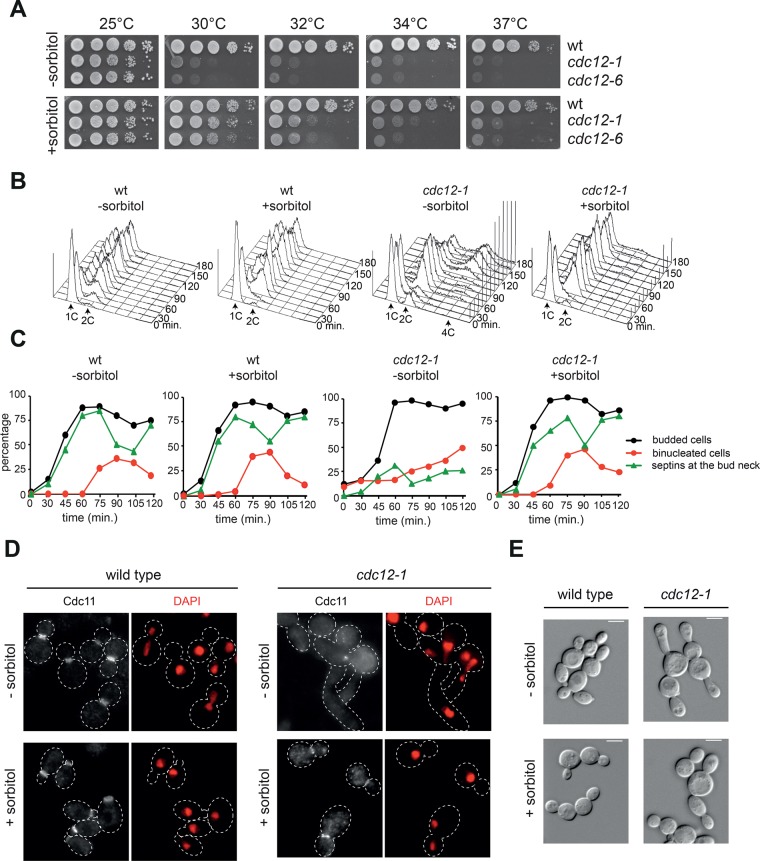
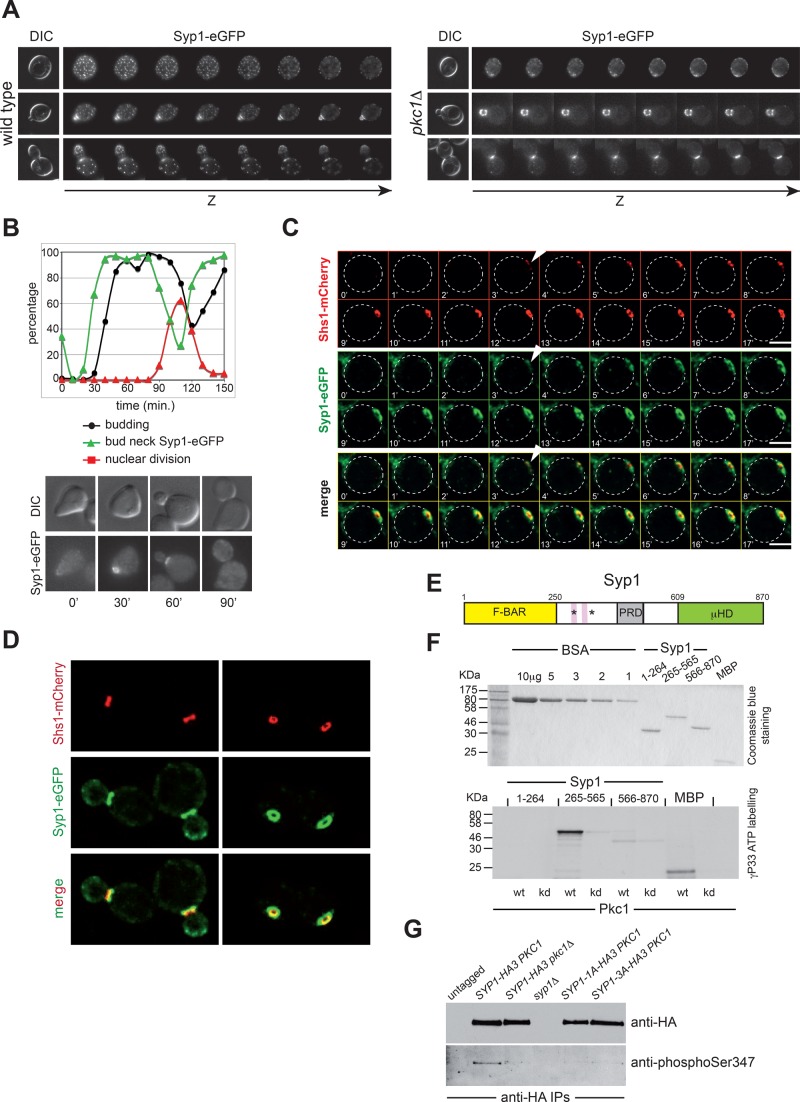
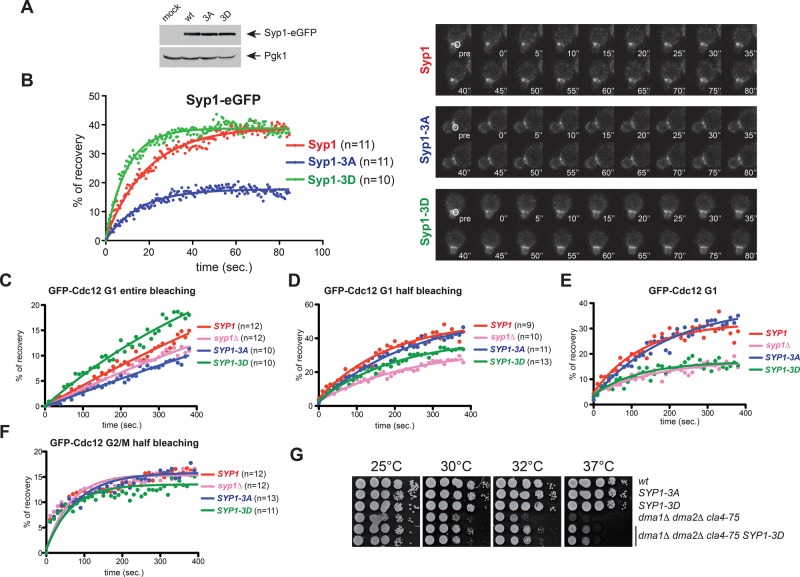
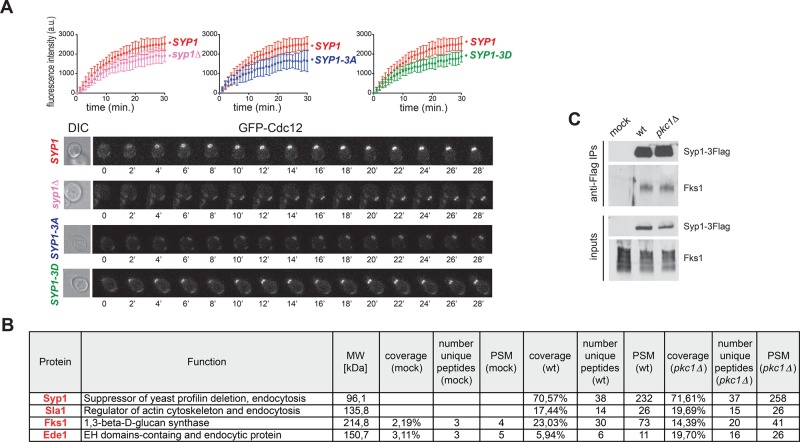
In many cell types, septins assemble into filaments and rings at the neck of cellular appendages and/or at the cleavage furrow to help compartmentalize the plasma membrane and support cytokinesis. How septin ring assembly is coordinated with membrane remodeling and controlled by mechanical stress at these sites is unclear. Through a genetic screen, we uncovered an unanticipated link between the conserved Rho1 GTPase and its effector protein kinase C (Pkc1) with septin ring stability in yeast. Both Rho1 and Pkc1 stabilize the septin ring, at least partly through phosphorylation of the membrane-associated F-BAR protein Syp1, which colocalizes asymmetrically with the septin ring at the bud neck. Syp1 is displaced from the bud neck upon Pkc1-dependent phosphorylation at two serines, thereby affecting the rigidity of the new-forming septin ring. We propose that Rho1 and Pkc1 coordinate septin ring assembly with membrane and cell wall remodeling partly by controlling Syp1 residence at the bud neck.


Figures

FIGURE 1:
FIGURE 1:
Rho1 and Pkc1 hyperactivation suppresses the temperature sensitivity of dma1Δ dma2Δ cla4-75 cells. (A, C, D) Serial dilutions of strains with the indicated genotypes were spotted on YEPD plates and incubated at the indicated temperatures for 2 d. The table in D lists the PKC1 alleles isolated in our genetic screen as suppressors of the lethality of dma1Δ dma2Δ cla4Δ cells. (B) Amino acid sequence alignment of Rho1/RhoA from budding yeast (S.c.), human (H.s.), and fruit fly (D.m.). The aspartate in bold is the conserved residue changed to asparagine in the RHO1-D72N allele. (E) Representative images of cells with the indicated genotypes and expressing Shs1-GFP after shift to 37°C for 6 h.
FIGURE 2:
FIGURE 2:
Rho1 and Pkc1 hyperactivation rescues the septin ring instability of cdc12-6 mutant cells. (A) Serial dilutions of strains with the indicated genotypes were spotted on YEPD plates and incubated at the indicated temperatures for 2 d. (B, C) cdc12-6 BUD4+ cells expressing wild-type RHO1 and PKC1, RHO1-D72N, or PKC1-R398P at their respective genomic loci were grown at 25°C and shifted to the restrictive temperature of 30°C for 1 h. The septin ring is marked by GFP-Cdc3. Average values and error bars (SD) are derived from three independent experiments (n ≥ 100). (D, E) The same strains as in B and C were grown at 23°C, arrested in mitosis by 3 h of treatment with nocodazole, and shifted to 30°C for 1 h to image GFP-Cdc3. Average values and error bars (SD) are derived from three independent experiments (n ≥ 100). Scale bars, 5 μm.
FIGURE 3:
FIGURE 3:
RHO1 and PKC1 mutations affect septin dynamics. (A) FRAP analysis of the septin ring in G1 cells after complete bleaching of the GFP-Cdc12 fluorescence signal at the presumptive bud site (time 0: postbleach). (B, C) FRAP analysis of the septin ring in budded cells after bleaching of half of the GFP-Cdc12 fluorescence signal at the bud neck (time 0: postbleach). Curves were fitted to monoexponential decay. (D) Wild-type and pkc1Δ cells in the W303 background (bud4) were grown in sorbitol-containing YEPD medium at 30°C and imaged. Fluorescence intensities of GFP-Cdc12 signals at the bud neck were quantified on one single in-focus plane (n ≥ 100). (E) Three independent wild-type and pkc1Δ strains in W303 carrying a wild-type copy of BUD4 (BUD4+) were grown and imaged as in D to quantify fluorescence intensities of GFP-Cdc12 signals at the bud neck (n ≥ 100). (F) Representative movies of wild-type and RHO1-D72N cells expressing GFP-Cdc12. Arrowheads indicate splitting of the septin ring, whereas arrows indicate appearance of a new septin ring. Time 0 is arbitrarily set 6 min before septin ring splitting. (G) Small, unbudded cells of wild-type, RHO1-D72N, and PKC1-R398P cells were isolated by centrifugal elutriation and released in fresh YEPD medium at 25°C (time 0). At the indicated time points, cells were collected for FACS analysis of DNA contents (not shown) and kinetics of cell volume, budding, nuclear division, and septin ring formation. This last was analyzed by indirect immunofluorescence with anti-Cdc11 antibodies. (H, I) Wild-type, RHO1-D72N, and PKC1-R398P cells expressing GFP-Cdc12 and the Gic2PDB-RFP marker of Cdc42 activation were filmed at 30°C to measure the time interval between Cdc42 activation and septin recruitment. The graph (I) represents the distribution of time intervals in each strain (n ≥ 30) and mean times (black bars).
FIGURE 4:
FIGURE 4:
Hyperosmotic medium rescues the lethality and cytokinetic defects of septin mutants. (A) Serial dilutions of strains with the indicated genotypes were spotted on YEPD plates and incubated at the indicated temperatures for 2 d. (B–E) Wild-type and cdc12-1 cells were grown in YEPD at 25°C in the absence or presence of sorbitol, arrested in G1 by α-factor, and released in fresh medium at 34°C (time 0). At the indicated time points, cell samples were collected for FACS analysis of DNA contents (B) and kinetics of budding, nuclear division, and septin deposition at the bud neck by indirect immunofluorescence of the septin Cdc11 (C). Distribution of septins (D) and cell morphology (E) in representative cells at t = 120 min after release.
FIGURE 5:
FIGURE 5:
Pkc1 phosphorylates Syp1 and controls its bud neck localization. (A) Z-stack serial images of wild-type and pkc1Δ cells expressing Syp1-eGFP at different cell cycle stages (top: G1, unbudded; middle: S phase, small budded; bottom: mitosis, large budded). Spacing between sequential planes is 0.3 μm. (B) Wild-type cells expressing Syp1-eGFP were arrested in G1 by α-factor and released in fresh YEPD medium at 25°C. At the indicated time points, cells were collected for FACS analysis of DNA contents (not shown) and kinetics of budding, nuclear division, and Syp1-eGFP localization. (C) Wild-type cells expressing Syp1-eGFP and Shs1-mCherry were filmed at room temperature with 1-min time lapse. Z-stacks (31 planes at 0.2-μm spacing) were maximum projected and deconvolved with Huygens. Arrowheads indicate the appearance of septin and Syp1 rings. (D) Images of wild- type cells expressing Syp1-eGFP and Shs1-mCherry show that Syp1 rings are larger in diameter than Shs1 rings and located on mother side of the bud neck. (E) Schematic representation of the Syp1 protein showing the N-terminal F-BAR domain (yellow), the middle, unstructured region (white) containing the proline-rich domain (gray), and the muniscin-homology domain (green) at the C-terminus. Pink boxes indicate the two phospholipid-binding motifs, and asterisks mark the position of the serines phosphorylated by Pkc1. (F) The three domains of Syp1 were purified from bacteria (purified proteins are shown on top after Coomassie blue staining of an acrylamide gel) and subjected to in vitro phosphorylation by wild-type or kinase-dead (kd) Pkc1 immunoprecipitated from yeast cells ([γ-33P]ATP labeling, bottom). (G) Syp1-HA3 was immunoprecipitated from protein extracts obtained from cycling cultures of strains with the indicated genotypes and probed by Western blot with a phospho-specific antibody raised against phosphorylated Ser-347, as well as with anti-HA antibodies.
FIGURE 6:
FIGURE 6:
Syp1 phosphorylation by Pkc1 promotes Syp1 turnover at the bud neck and rigidity of the septin ring during its formation. (A) Steady-state levels of Syp1-, Syp1-3A-, and Syp1-3D-eGFP in logarithmically growing cells. (B) FRAP analysis of Syp1-eGFP at the bud neck. Half of the Syp1 ring was bleached in small-budded wild-type, SYP1-3A, and SYP1-3D cells, and recovery of fluorescence was measured every 0.5 s. Time 0 indicates the first time point after bleaching. Curves were fitted to monoexponential decay. (C–F) Cells with the indicated genotypes and expressing GFP-Cdc12 were analyzed by FRAP after bleaching of the entire (C) or half septin ring (D, F) in either G1 cells (C, D) or G2/M cells (F). Images were taken every 10 s. Time 0 corresponds to the first frame after bleaching. Curves were fitted with a one-phase association function (C, D) or with a two-phase association function (F). The goodness of the fit was based on 95% confidence intervals and R2 values. Kinetics of recovery after entire bleaching (C) was subtracted from those after half-bleaching (D) to obtain curves of recovery deriving only from septin dynamics inside the ring (i.e., recovery from the unbleached half of the ring; E). (G) Serial dilutions of stationary-phase cultures of strains with the indicated genotypes were spotted on YEPD plates and incubated for 2 d at the indicated temperatures.
FIGURE 7:
FIGURE 7:
Syp1 contributes to fast septin recruitment at the bud neck and interacts with Fks1. (A) Kinetics of septin recruitment at the presumptive bud site were calculated by measuring the fluorescence intensity of GFP-Cdc12 over time (frames every 1 min) in cells with the indicated genotypes arrested in G1 by α-factor and released into fresh medium at 30°C at time 0. Wild type, n = 9; syp1Δ, n = 18; SYP1-3A, n = 10; SYP1-3D, n = 15. (B) Mass spectrometric analysis of Flag immunoprecipitates from cell extracts of wild-type cells expressing either untagged Syp1 (mock) or Flag-tagged Syp1 (Syp1-3xFlag) and carrying either wild-type PKC1 or PKC1 deletion (pkc1Δ). Cells were grown to exponential phase in sorbitol-containing medium to keep pkc1Δ cells alive. The table contains only a partial list of Syp1-interacting proteins that were uncovered by mass spectrometry. Unique peptides are peptides with different amino acid sequence. PSM (peptide-spectrum match) represents the total number of peptides identified for each protein. (C) Syp1-3Flag was immunoprecipitated from wild-type and pkc1Δ cells grown in YEPD containing sorbitol. Immunoprecipitates were separated by SDS–PAGE electrophoresis and analyzed by Western blot with anti-Fks1 and anti-Flag antibodies.

Similar articles

Cited by

References

    1. Albuquerque CP, Smolka MB, Payne SH, Bafna V, Eng J, Zhou H. A multidimensional chromatography technology for in-depth phosphoproteome analysis. Mol Cell Proteomics. 2008;7:1389–1396. - PMC - PubMed
    1. Anastasia SD, Nguyen DL, Thai V, Meloy M, Macdonough T, Kellogg DR. A link between mitotic entry and membrane growth suggests a novel model for cell size control. J Cell Biol. 2012;197:89–104. - PMC - PubMed
    1. Antonsson B, Montessuit S, Friedli L, Payton MA, Paravicini G. Protein kinase C in yeast. Characteristics of the Saccharomyces cerevisiae PKC1 gene product. J Biol Chem. 1994;269:16821–16828. - PubMed
    1. Badrane H, Nguyen MH, Blankenship JR, Cheng S, Hao B, Mitchell AP, Clancy CJ. Rapid redistribution of phosphatidylinositol-(4,5)-bisphosphate and septins during the Candida albicans response to caspofungin. Antimicrob Agents Chemother. 2012;56:4614–4624. - PMC - PubMed
    1. Barral Y. Cell biology. Septins at the nexus. Science. 2010;329:1289–1290. - PubMed

Publication types

MeSH terms