

Signal inhibition by a dynamically regulated pool of monophosphorylated MAPK
- PMID: 26179917
- PMCID: PMC4569323
- DOI: 10.1091/mbc.E15-01-0037
Signal inhibition by a dynamically regulated pool of monophosphorylated MAPK
Abstract
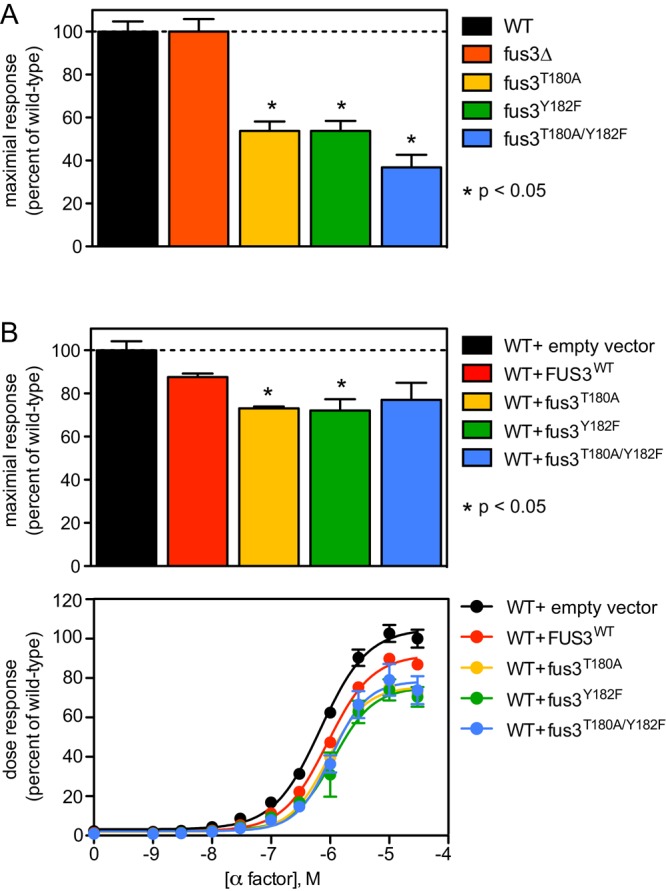
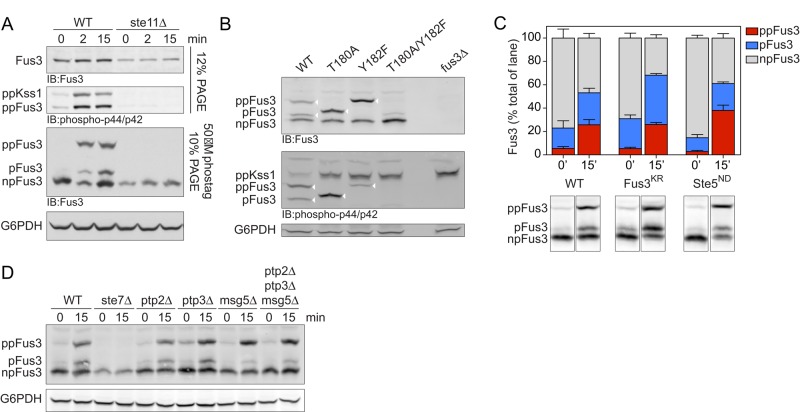
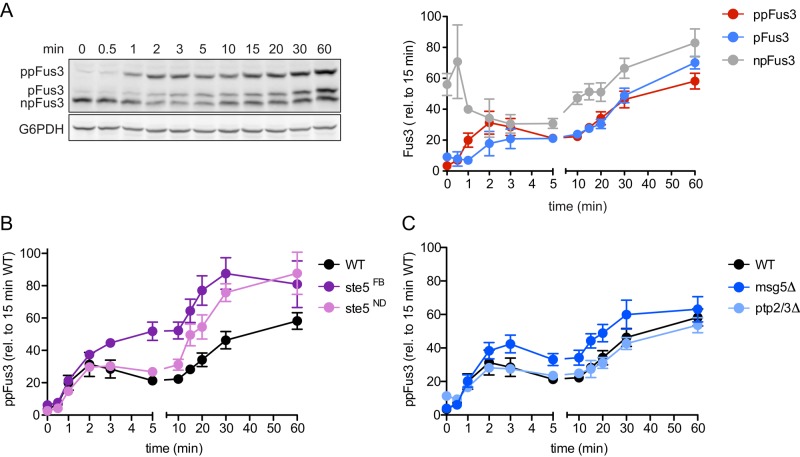
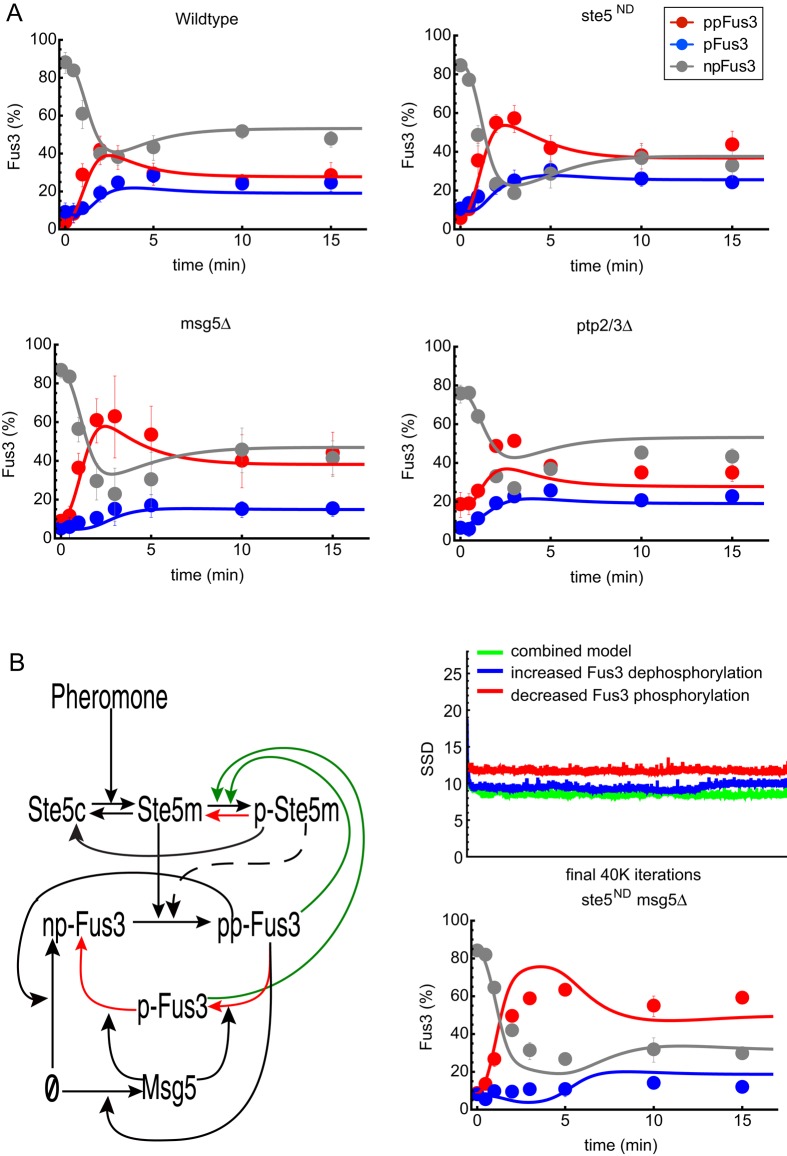
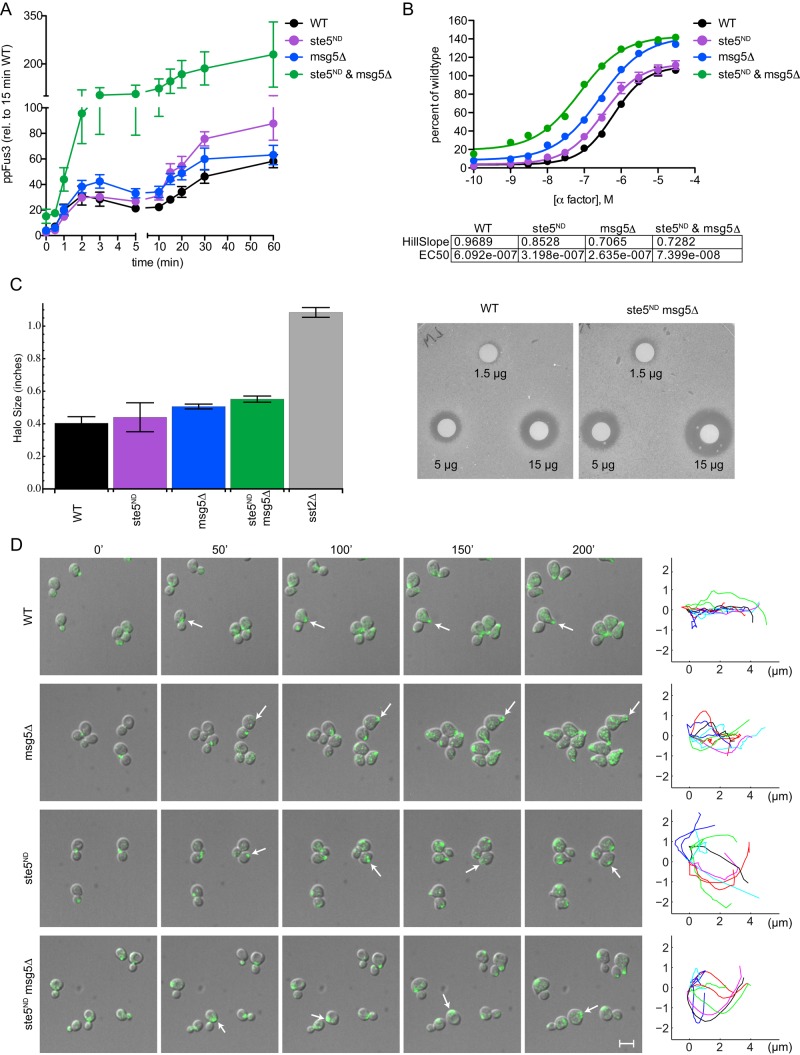
Protein kinases regulate a broad array of cellular processes and do so through the phosphorylation of one or more sites within a given substrate. Many protein kinases are themselves regulated through multisite phosphorylation, and the addition or removal of phosphates can occur in a sequential (processive) or a stepwise (distributive) manner. Here we measured the relative abundance of the monophosphorylated and dual-phosphorylated forms of Fus3, a member of the mitogen-activated protein kinase (MAPK) family in yeast. We found that upon activation with pheromone, a substantial proportion of Fus3 accumulates in the monophosphorylated state. Introduction of an additional copy of Fus3 lacking either phosphorylation site leads to dampened signaling. Conversely, cells lacking the dual-specificity phosphatase (msg5Δ) or that are deficient in docking to the MAPK-scaffold (Ste5(ND)) accumulate a greater proportion of dual-phosphorylated Fus3. The double mutant exhibits a synergistic, or "synthetic," supersensitivity to pheromone. Finally, we present a predictive computational model that combines MAPK scaffold and phosphatase activities and is sufficient to account for the observed MAPK profiles. These results indicate that the monophosphorylated and dual-phosphorylated forms of the MAPK act in opposition to one another. Moreover, they reveal a new mechanism by which the MAPK scaffold acts dynamically to regulate signaling.
© 2015 Nagiec, McCarter, et al. This article is distributed by The American Society for Cell Biology under license from the author(s). Two months after publication it is available to the public under an Attribution–Noncommercial–Share Alike 3.0 Unported Creative Commons License (http://creativecommons.org/licenses/by-nc-sa/3.0).
Figures
Similar articles
-
MAPK modulation of yeast pheromone signaling output and the role of phosphorylation sites in the scaffold protein Ste5.Mol Biol Cell. 2019 Apr 1;30(8):1037-1049. doi: 10.1091/mbc.E18-12-0793. Epub 2019 Feb 6. Mol Biol Cell. 2019. PMID: 30726174 Free PMC article.
-
Saccharomyces cerevisiae Ste5 is important for induction and substrate specificity of Fus3 MAP kinase in the pheromone signaling pathway.Mol Cells. 2000 Jun 30;10(3):301-8. Mol Cells. 2000. PMID: 10901168
-
MAPK specificity in the yeast pheromone response independent of transcriptional activation.Curr Biol. 2001 Aug 21;11(16):1266-71. doi: 10.1016/s0960-9822(01)00370-0. Curr Biol. 2001. PMID: 11525741
-
Pheromone signaling pathways in yeast.Sci STKE. 2006 Dec 5;2006(364):cm6. doi: 10.1126/stke.3642006cm6. Sci STKE. 2006. PMID: 17148787 Review.
-
Spatial and temporal signal processing and decision making by MAPK pathways.J Cell Biol. 2017 Feb;216(2):317-330. doi: 10.1083/jcb.201609124. Epub 2017 Jan 2. J Cell Biol. 2017. PMID: 28043970 Free PMC article. Review.
Cited by
-
Modulating p38 MAPK signaling by proteostasis mechanisms supports tissue integrity during growth and aging.Nat Commun. 2023 Jul 28;14(1):4543. doi: 10.1038/s41467-023-40317-7. Nat Commun. 2023. PMID: 37507441 Free PMC article.
-
Negative Feedback Phosphorylation of Gγ Subunit Ste18 and the Ste5 Scaffold Synergistically Regulates MAPK Activation in Yeast.Cell Rep. 2018 May 1;23(5):1504-1515. doi: 10.1016/j.celrep.2018.03.135. Cell Rep. 2018. PMID: 29719261 Free PMC article.
-
MAPK modulation of yeast pheromone signaling output and the role of phosphorylation sites in the scaffold protein Ste5.Mol Biol Cell. 2019 Apr 1;30(8):1037-1049. doi: 10.1091/mbc.E18-12-0793. Epub 2019 Feb 6. Mol Biol Cell. 2019. PMID: 30726174 Free PMC article.
-
Analysis of the thresholds for transcriptional activation by the yeast MAP kinases Fus3 and Kss1.Mol Biol Cell. 2018 Mar 1;29(5):669-682. doi: 10.1091/mbc.E17-10-0578. Epub 2018 Jan 10. Mol Biol Cell. 2018. PMID: 29321252 Free PMC article.
-
Spatio-temporal MAPK dynamics mediate cell behavior coordination during fungal somatic cell fusion.J Cell Sci. 2018 May 4;131(9):jcs213462. doi: 10.1242/jcs.213462. J Cell Sci. 2018. PMID: 29592970 Free PMC article.
References
-
- Bhattacharyya RP, Remenyi A, Good MC, Bashor CJ, Falick AM, Lim WA. The Ste5 scaffold allosterically modulates signaling output of the yeast mating pathway. Science. 2006;311:822–826. - PubMed
-
- Brachmann CB, Davies A, Cost GJ, Caputo E, Li J, Hieter P, Boeke JD. Designer deletion strains derived from Saccharomyces cerevisiae S288C: a useful set of strains and plasmids for PCR-mediated gene disruption and other applications. Yeast. 1998;14:115–132. - PubMed
Publication types
MeSH terms
Substances
Grants and funding
LinkOut - more resources
Full Text Sources
Molecular Biology Databases
