

Biochemical and molecular predictors for prognosis in nonketotic hyperglycinemia
- PMID: 26179960
- PMCID: PMC4767401
- DOI: 10.1002/ana.24485
Biochemical and molecular predictors for prognosis in nonketotic hyperglycinemia
Erratum in
-
Corrigendum: Swanson MA, Coughlin CR Jr, Scharer GH, et al: Biochemical and molecular predictors for prognosis in nonketotic hyperglycinemia. Ann Neurol 2015;78:606-618.Ann Neurol. 2016 Mar;79(3):505. doi: 10.1002/ana.24600. Epub 2016 Feb 12. Ann Neurol. 2016. PMID: 26969502 Free PMC article. No abstract available.
Abstract
Objective: Nonketotic hyperglycinemia is a neurometabolic disorder characterized by intellectual disability, seizures, and spasticity. Patients with attenuated nonketotic hyperglycinemia make variable developmental progress. Predictive factors have not been systematically assessed.
Methods: We reviewed 124 patients stratified by developmental outcome for biochemical and molecular predictive factors. Missense mutations were expressed to quantify residual activity using a new assay.
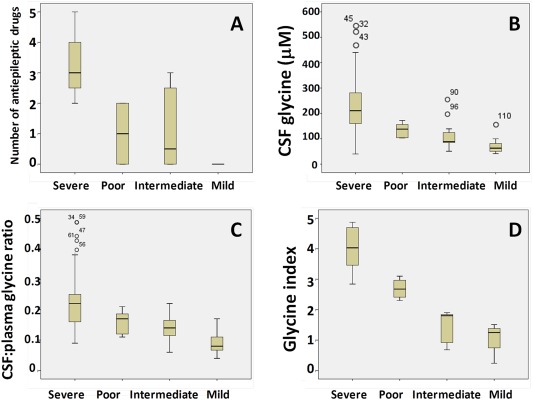
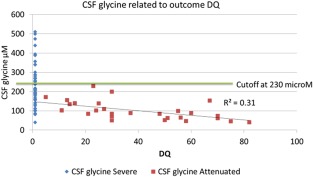
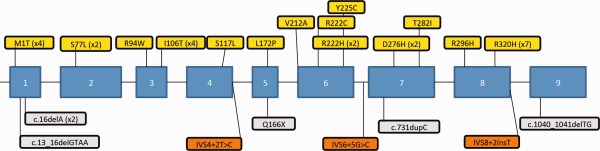
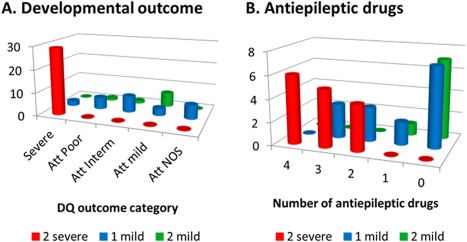
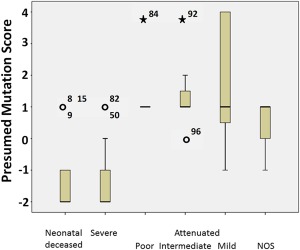
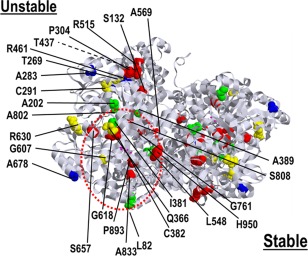
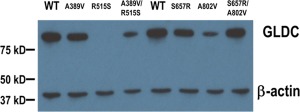
Results: Patients with severe nonketotic hyperglycinemia required multiple anticonvulsants, whereas patients with developmental quotient (DQ) > 30 did not require anticonvulsants. Brain malformations occurred mainly in patients with severe nonketotic hyperglycinemia (71%) but rarely in patients with attenuated nonketotic hyperglycinemia (7.5%). Neonatal presentation did not correlate with outcome, but age at onset ≥ 4 months was associated with attenuated nonketotic hyperglycinemia. Cerebrospinal fluid (CSF) glycine levels and CSF:plasma glycine ratio correlated inversely with DQ; CSF glycine > 230 μM indicated severe outcome and CSF:plasma glycine ratio ≤ 0.08 predicted attenuated outcome. The glycine index correlated strongly with outcome. Molecular analysis identified 99% of mutant alleles, including 96 novel mutations. Mutations near the active cleft of the P-protein maintained stable protein levels. Presence of 1 mutation with residual activity was necessary but not sufficient for attenuated outcome; 2 such mutations conferred best outcome. Divergent outcomes for the same genotype indicate a contribution of other genetic or nongenetic factors.
Interpretation: Accurate prediction of outcome is possible in most patients. A combination of 4 factors available neonatally predicted 78% of severe and 49% of attenuated patients, and a score based on mutation severity predicted outcome with 70% sensitivity and 97% specificity.
© 2015 The Authors Annals of Neurology published by Wiley Periodicals, Inc. on behalf of American Neurological Association.
Figures

References
-
- Carson NAJ. Non‐ketotic hyperglycinaemia—a review of 70 patients. J Inherit Metab Dis 1982;5:126–128..
-
- Hennermann JB, Berger J‐M, Grieben U, et al. Prediction of long‐term outcome in glycine encephalopathy: a clinical survey. J Inherit Metab Dis 2012;35:253–261. - PubMed
-
- Hoover‐Fong JE, Shah S, Van Hove JLK, et al. Natural history of nonketotic hyperglycinemia in 65 patients. Neurology 2004;63:1847–1853. - PubMed
-
- Dobyns WB. Agenesis of the corpus callosum and gyral malformations are frequent manifestations of nonketotic hyperglycinemia. Neurology 1989;39:817–820. - PubMed
-
- Van Hove JLK, Kishnani PS, Demaerel P, et al. Acute hydrocephalus in nonketotic hyperglycinemia. Neurology 2000;54:754–756. - PubMed
Publication types
MeSH terms
Substances
Grants and funding
LinkOut - more resources
Full Text Sources
Other Literature Sources
Medical
