

Mobile Phone Sensor Correlates of Depressive Symptom Severity in Daily-Life Behavior: An Exploratory Study
- PMID: 26180009
- PMCID: PMC4526997
- DOI: 10.2196/jmir.4273
Mobile Phone Sensor Correlates of Depressive Symptom Severity in Daily-Life Behavior: An Exploratory Study
Abstract
Background: Depression is a common, burdensome, often recurring mental health disorder that frequently goes undetected and untreated. Mobile phones are ubiquitous and have an increasingly large complement of sensors that can potentially be useful in monitoring behavioral patterns that might be indicative of depressive symptoms.
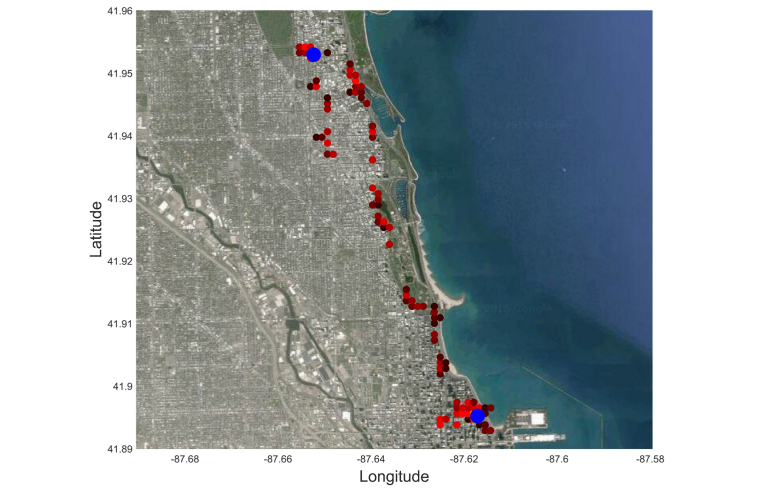
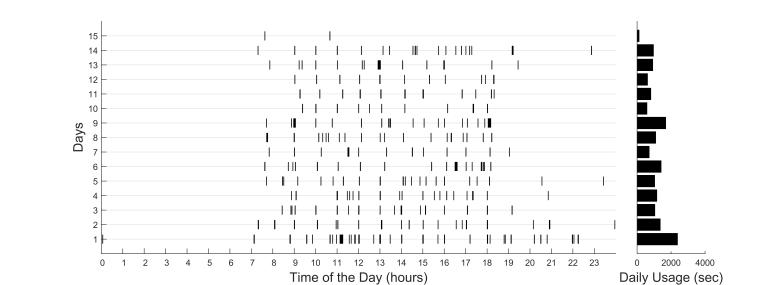
Objective: The objective of this study was to explore the detection of daily-life behavioral markers using mobile phone global positioning systems (GPS) and usage sensors, and their use in identifying depressive symptom severity.
Methods: A total of 40 adult participants were recruited from the general community to carry a mobile phone with a sensor data acquisition app (Purple Robot) for 2 weeks. Of these participants, 28 had sufficient sensor data received to conduct analysis. At the beginning of the 2-week period, participants completed a self-reported depression survey (PHQ-9). Behavioral features were developed and extracted from GPS location and phone usage data.
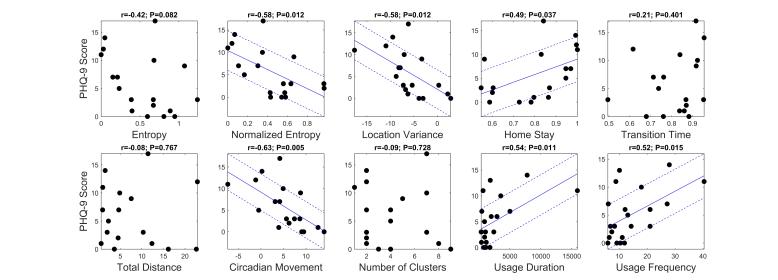
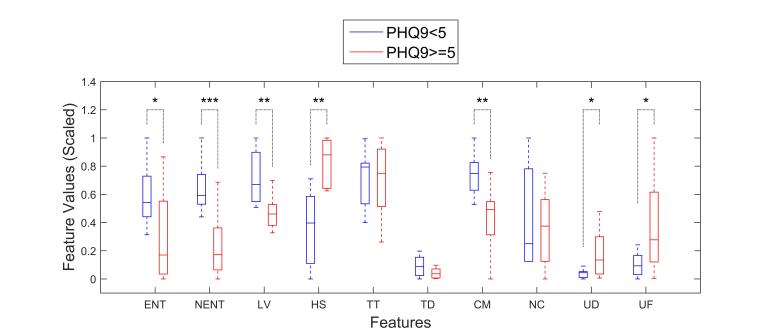
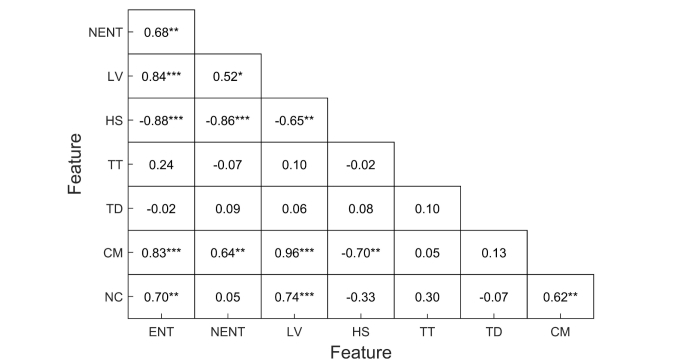
Results: A number of features from GPS data were related to depressive symptom severity, including circadian movement (regularity in 24-hour rhythm; r=-.63, P=.005), normalized entropy (mobility between favorite locations; r=-.58, P=.012), and location variance (GPS mobility independent of location; r=-.58, P=.012). Phone usage features, usage duration, and usage frequency were also correlated (r=.54, P=.011, and r=.52, P=.015, respectively). Using the normalized entropy feature and a classifier that distinguished participants with depressive symptoms (PHQ-9 score ≥5) from those without (PHQ-9 score <5), we achieved an accuracy of 86.5%. Furthermore, a regression model that used the same feature to estimate the participants' PHQ-9 scores obtained an average error of 23.5%.
Conclusions: Features extracted from mobile phone sensor data, including GPS and phone usage, provided behavioral markers that were strongly related to depressive symptom severity. While these findings must be replicated in a larger study among participants with confirmed clinical symptoms, they suggest that phone sensors offer numerous clinical opportunities, including continuous monitoring of at-risk populations with little patient burden and interventions that can provide just-in-time outreach.
Keywords: activities of daily living; classification; cluster analysis; depression; mobile health (mHealth).
Conflict of interest statement
Conflicts of Interest: None declared.
Figures
References
-
- Kessler RC, Berglund P, Demler O, Jin R, Koretz D, Merikangas KR, Rush AJ, Walters EE, Wang PS, National Comorbidity Survey Replication The epidemiology of major depressive disorder: results from the National Comorbidity Survey Replication (NCS-R) JAMA. 2003 Jun 18;289(23):3095–3105. doi: 10.1001/jama.289.23.3095.289/23/3095 - DOI - PubMed
-
- Kessler RC, McGonagle KA, Zhao S, Nelson CB, Hughes M, Eshleman S, Wittchen HU, Kendler KS. Lifetime and 12-month prevalence of DSM-III-R psychiatric disorders in the United States. Results from the National Comorbidity Survey. Arch Gen Psychiatry. 1994 Jan;51(1):8–19. - PubMed
-
- Karsten J, Hartman CA, Smit JH, Zitman FG, Beekman AT, Cuijpers P, van der Does AJ, Ormel J, Nolen WA, Penninx BW. Psychiatric history and subthreshold symptoms as predictors of the occurrence of depressive or anxiety disorder within 2 years. Br J Psychiatry. 2011 Mar;198(3):206–212. doi: 10.1192/bjp.bp.110.080572. http://bjp.rcpsych.org/cgi/pmidlookup?view=long&pmid=21357879 198/3/206 - DOI - PubMed
-
- Lewinsohn PM, Solomon A, Seeley JR, Zeiss A. Clinical implications of "subthreshold" depressive symptoms. J Abnorm Psychol. 2000 May;109(2):345–351. - PubMed
Publication types
MeSH terms
Grants and funding
LinkOut - more resources
Full Text Sources
Other Literature Sources
Medical
