. 2015 Sep;114(3):1806-18.
doi: 10.1152/jn.00362.2015. Epub 2015 Jul 15.

Neural circuit basis of visuo-spatial working memory precision: a computational and behavioral study

Affiliations

Neural circuit basis of visuo-spatial working memory precision: a computational and behavioral study

Rita Almeida et al. J Neurophysiol. 2015 Sep.

Erratum in

  • CORRIGENDUM.
    [No authors listed] [No authors listed] J Neurophysiol. 2019 Oct 1;122(4):1843. doi: 10.1152/z9k-5270-corr.2019. J Neurophysiol. 2019. PMID: 31617797 Free PMC article. No abstract available.

Abstract

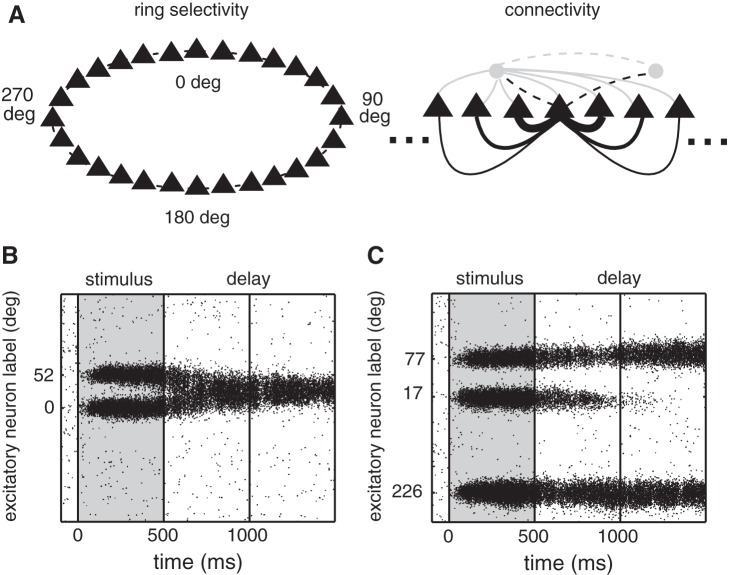
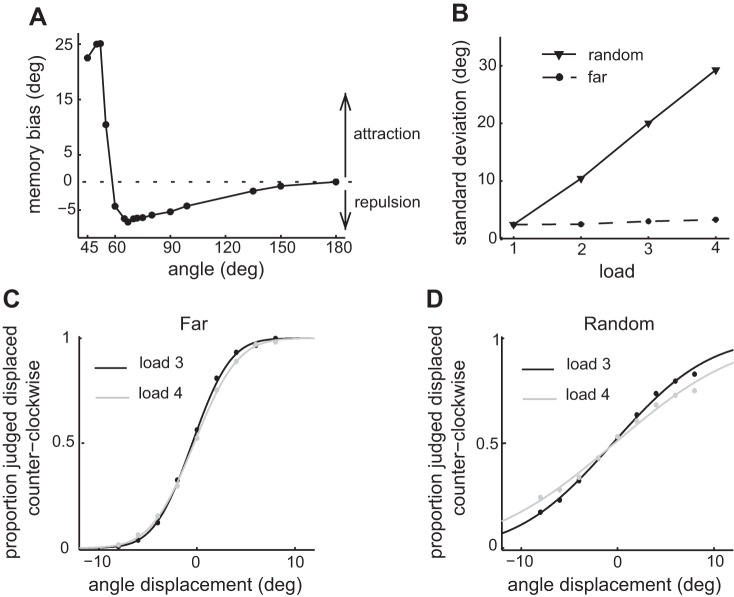
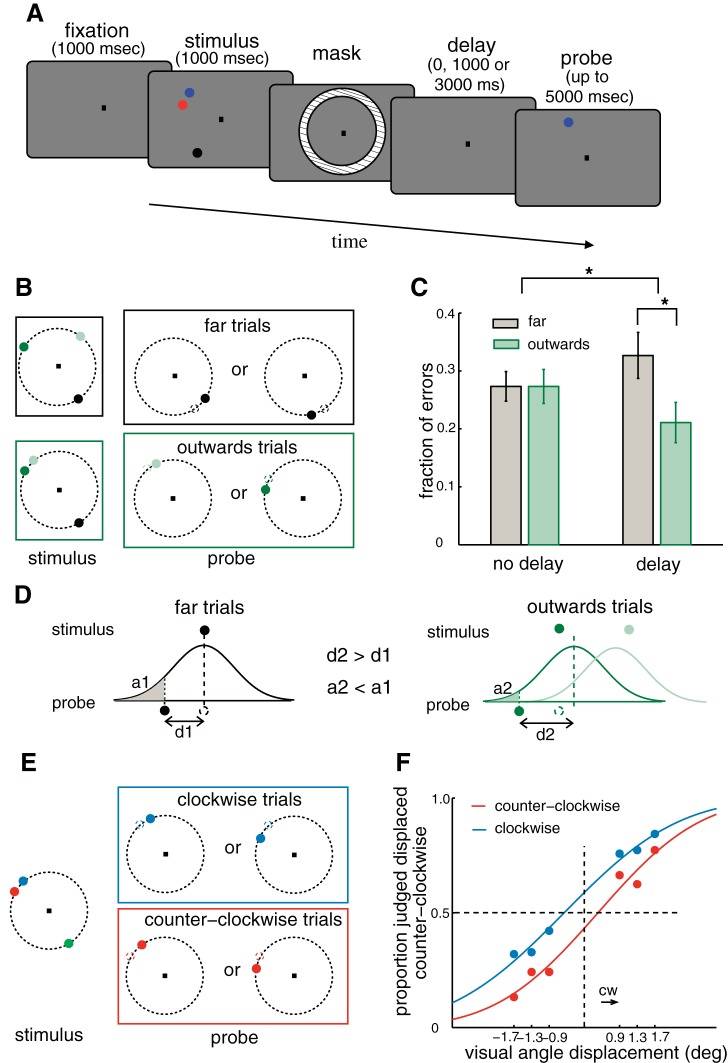
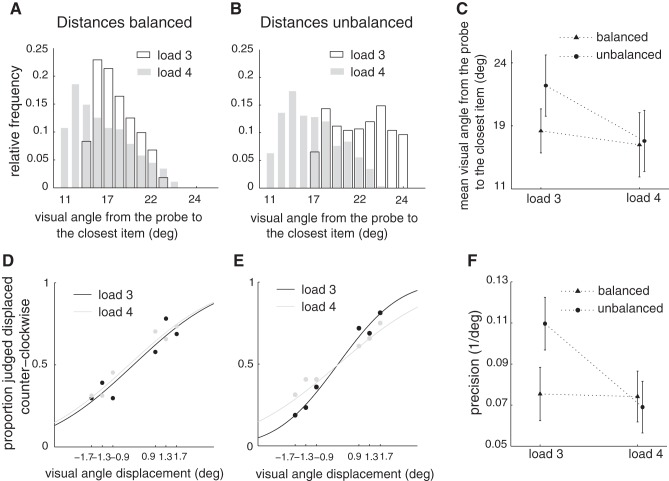
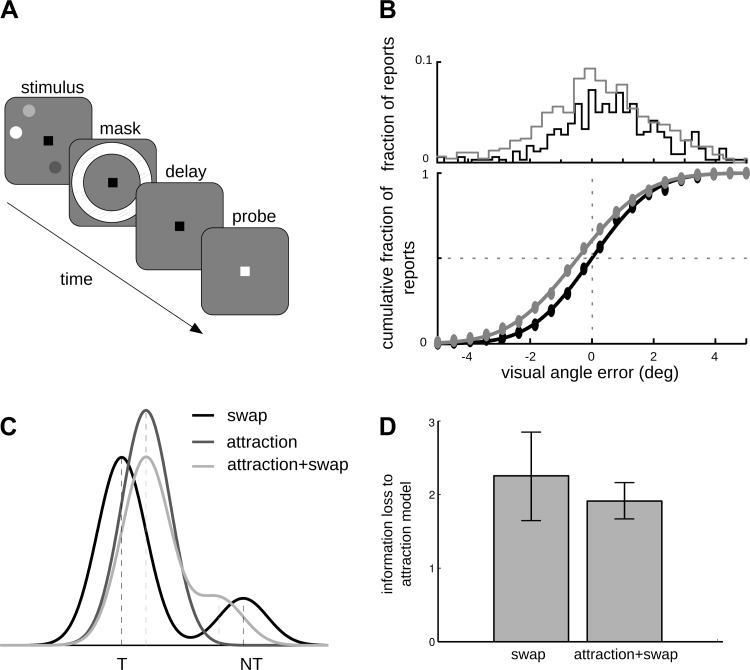
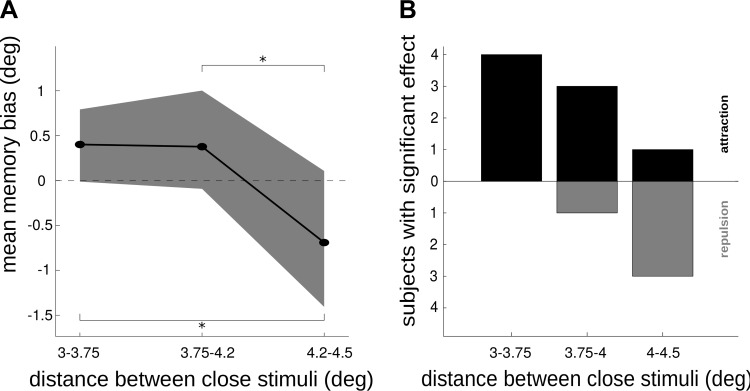
The amount of information that can be retained in working memory (WM) is limited. Limitations of WM capacity have been the subject of intense research, especially in trying to specify algorithmic models for WM. Comparatively, neural circuit perspectives have barely been used to test WM limitations in behavioral experiments. Here we used a neuronal microcircuit model for visuo-spatial WM (vsWM) to investigate memory of several items. The model assumes that there is a topographic organization of the circuit responsible for spatial memory retention. This assumption leads to specific predictions, which we tested in behavioral experiments. According to the model, nearby locations should be recalled with a bias, as if the two memory traces showed attraction or repulsion during the delay period depending on distance. Another prediction is that the previously reported loss of memory precision for an increasing number of memory items (memory load) should vanish when the distances between items are controlled for. Both predictions were confirmed experimentally. Taken together, our findings provide support for a topographic neural circuit organization of vsWM, they suggest that interference between similar memories underlies some WM limitations, and they put forward a circuit-based explanation that reconciles previous conflicting results on the dependence of WM precision with load.

Keywords: attractor model; capacity; precision; short-term memory; working memory.


Figures

Fig. 1.
Fig. 1.
The biophysical network model. A: schematic representation of the ring structure of the network model (left) and of the connectivity structure (right) between excitatory (black triangles) and inhibitory neurons (gray circles). Neurons encoding similar angles were strongly connected as illustrated by the width of the lines connecting cells. Connections onto excitatory neurons are indicated with a solid line and connections onto interneurons with a dashed line; excitatory connections are indicated in black and inhibitory connections in gray. B: example activity of excitatory neurons in the network, when items were located in the vicinity of each other, leading to attraction of the memory traces. C: example activity of excitatory neurons in the network in a trial with 3 presented items, illustrating the loss of a memory trace during the delay period.
Fig. 2.
Fig. 2.
The biophysical network model predicts behavioral effects in multi-item visuo-spatial working memory (vsWM) tasks. A: memory bias as a function of angle between 2 items simultaneously presented. The results are averages over 100 simulations and are based on memory traces after 500 ms from stimulus offset. Memory biases toward the other presented item (attraction) were defined as positive, while biases away from the other presented item (repulsion) were defined as negative. The bias for small angles is easier to explore experimentally and leads to the formulation of the prediction of attraction biases. B: standard deviation error of the memory trace after 500 ms as a function of load. The standard deviation error was relatively constant for far items and increased with load for randomly located items, leading to the prediction of conditional dependence of precision on load. C: proportion of probes judged to be displaced counterclockwise from the memorized item. The results are for far items and loads 3 and 4 and were fitted with a probit model with displacement of the probe as independent variable. D: same as C but for randomly located items. C and D use the same simulations as in B and show that for far items there is no decrease in precision with load, which is observed for randomly located items. This observation also leads to the prediction of conditional dependence of precision on load.
Fig. 3.
Fig. 3.
Behavioral data support the model-derived prediction of attraction biases. A: schematic illustration of the paradigm used in the behavioral experiment. B: illustration of the sorting of trials according to relative positions of the items. In one case, items were far from each other (far trials, framed in black). In the other case, the target item was presented close to another item and was displaced away from its neighbor during probing (outward trials, framed in green). C: fraction of errors averaged over participants (n = 8) in 48 trials of each trial type (delay/no delay and far/outward). Data were analyzed with a probit model. There was a significant interaction between delay and trial type. For no-delay trials there was no difference between the fraction of errors for far and outward trials, while there was a significant difference for delay trials. *Significant differences. Error bars indicate SE. D: schematic illustration of the mechanism thought to underlie the decrease in errors for outward trials compared with far trials. Bell-shaped curves represent the probability distribution of the remembered locations. The probed item defines an area under the probability function. This area is the probability of incorrectly judging the direction of displacement of the probe and is larger for far than outward trials (a2 < a1). The distance between location of the item and the location of the probe is larger for outward trials (d1 < d2). Hence, the probability of a correct response in outward trials is larger than in far trials, as observed experimentally. E: illustration of another sorting of trials, all containing the probed item in the vicinity of another item. Trials were sorted according to the clockwise or counterclockwise location of the probed item relative to the neighboring item. F: psychometric curves for clockwise and counterclockwise trials were horizontally displaced in relation to each other. Curves resulted from a probit model fit to data from all participants (n = 8). The results of C and F are consistent with the prediction of attraction biases.
Fig. 4.
Fig. 4.
Behavioral data support the model-derived prediction of conditional dependence of precision on load. A and B: histograms of the distances between the target or probed item to the nearest nonprobed item for loads 3 and 4 for the case of balanced or invariant distances across load (A) or for the case of unbalanced or varying distances across load trials (B) (see results). Each combination of load and trial type (balanced/unbalanced) included 384 trials. C: mean distances from the target to the nearest neighbor for loads 3 and 4 and for balanced and unbalanced distances. Error bars indicate SD. D: psychometric curves for loads 3 and 4 for the case of balanced distances. Curves resulted from a probit model fit to data from all participants (n = 8). E: same as in D for unbalanced distances. F: precision derived from D and E decreased with load for unbalanced distances, while it remained unchanged for balanced distances. Error bars indicate SE.
Fig. 5.
Fig. 5.
Behavioral data suggest that attraction of memory representations and not swap error is responsible for memory biases observed in close trials. A: schematic illustration of the modified experimental paradigm, where participants indicated the remembered target location upon appearance of a colored cue in the center of the screen. B, top: distributions of error to target for clockwise (gray) and counterclockwise (black) trials differed significantly (P < 0.00005, data from all participants n = 9), revealing an attractive bias. Bottom: cumulative proportion of errors to target from the distributions at top, to compare with psychometric curves in Fig. 2E. Data were fitted with a cumulative normal function. C: schematic illustration of the probability density function for each of the 3 models tested: swap, attraction, and attraction + swap models. D: average information loss ΔAIC across subjects (n = 8) for swap and attraction + swap models compared with the attraction model, the best model for data from these participants.
Fig. 6.
Fig. 6.
Memory repulsion emerges for intermediate distances between close-by items. A: subject-averaged memory bias (materials and methods) for trials with different distances between memorized close-by items (x-axis). Shading indicates bootstrap-derived 95% confidence intervals. *Significant difference as evaluated with 1-tailed paired t-test at P < 0.05. B: no. of subjects with significant (t-test P < 0.05) attractive and repulsive memory bias in trials with different interitem distance.

References

    1. Akaike H. A new look at the statistical model identification. IEEE Trans Automat Contr 19: 716–723, 1974.
    1. Alvarez G, Cavanagh P. The capacity of visual short-term memory is set both by visual information load and by number of objects. Psychol Sci 15: 106–111, 2004. - PubMed
    1. Amari SI. Dynamics of pattern formation in lateral-inhibition type neural fields. Biol Cybern 27: 77–87, 1977. - PubMed
    1. Anderson D, Vogel E, Awh E. Precision in visual working memory reaches a stable plateau when individual item limits are exceeded. J Neurosci 31: 1128–1138, 2011. - PMC - PubMed
    1. Baddeley A. Working Memory. New York: Oxford Univ. Press, 1986.

Publication types