. 2015 Jul 16;11(7):e1005044.
doi: 10.1371/journal.ppat.1005044. eCollection 2015 Jul.

Macrophages Subvert Adaptive Immunity to Urinary Tract Infection

Affiliations

Macrophages Subvert Adaptive Immunity to Urinary Tract Infection

Gabriela Mora-Bau et al. PLoS Pathog. .

Abstract

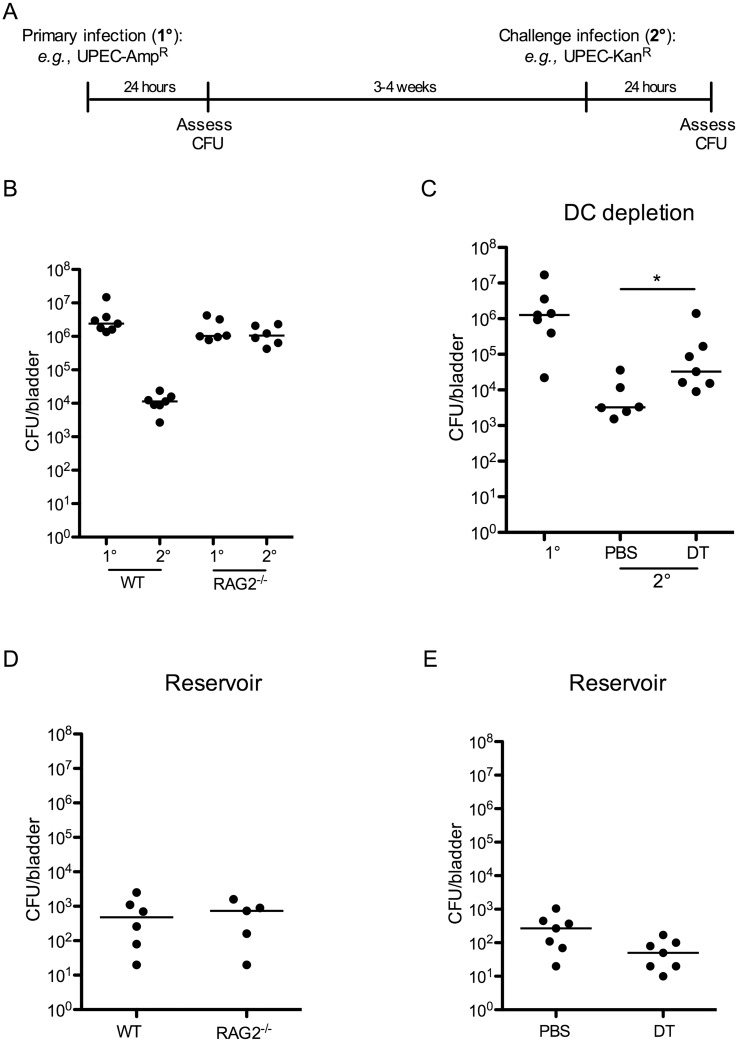
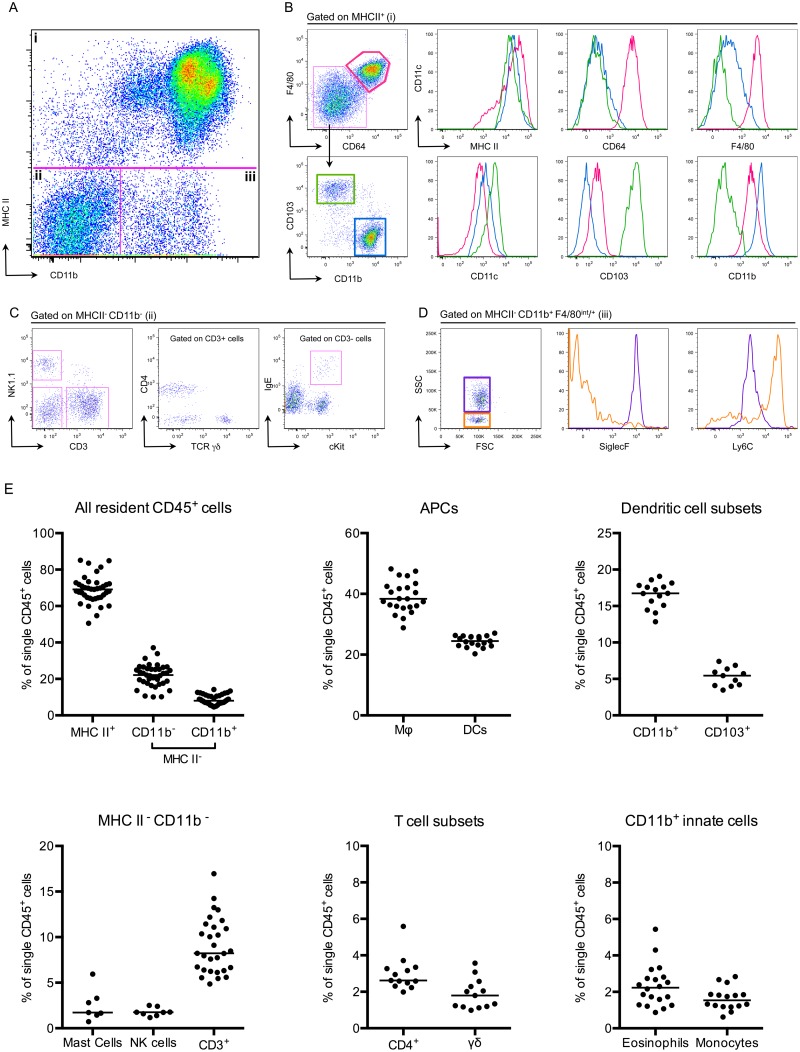
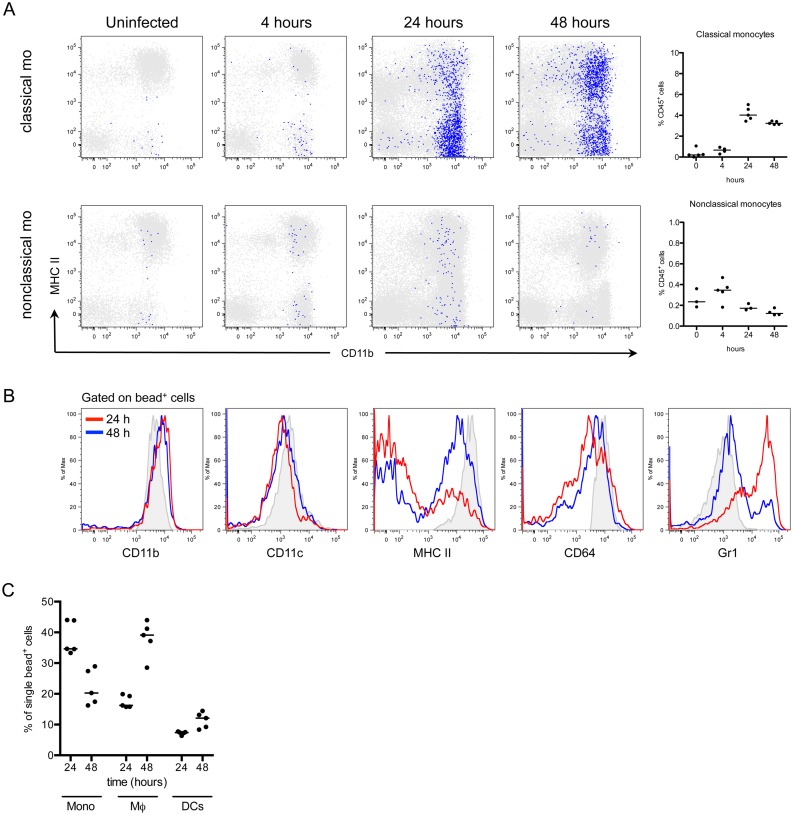
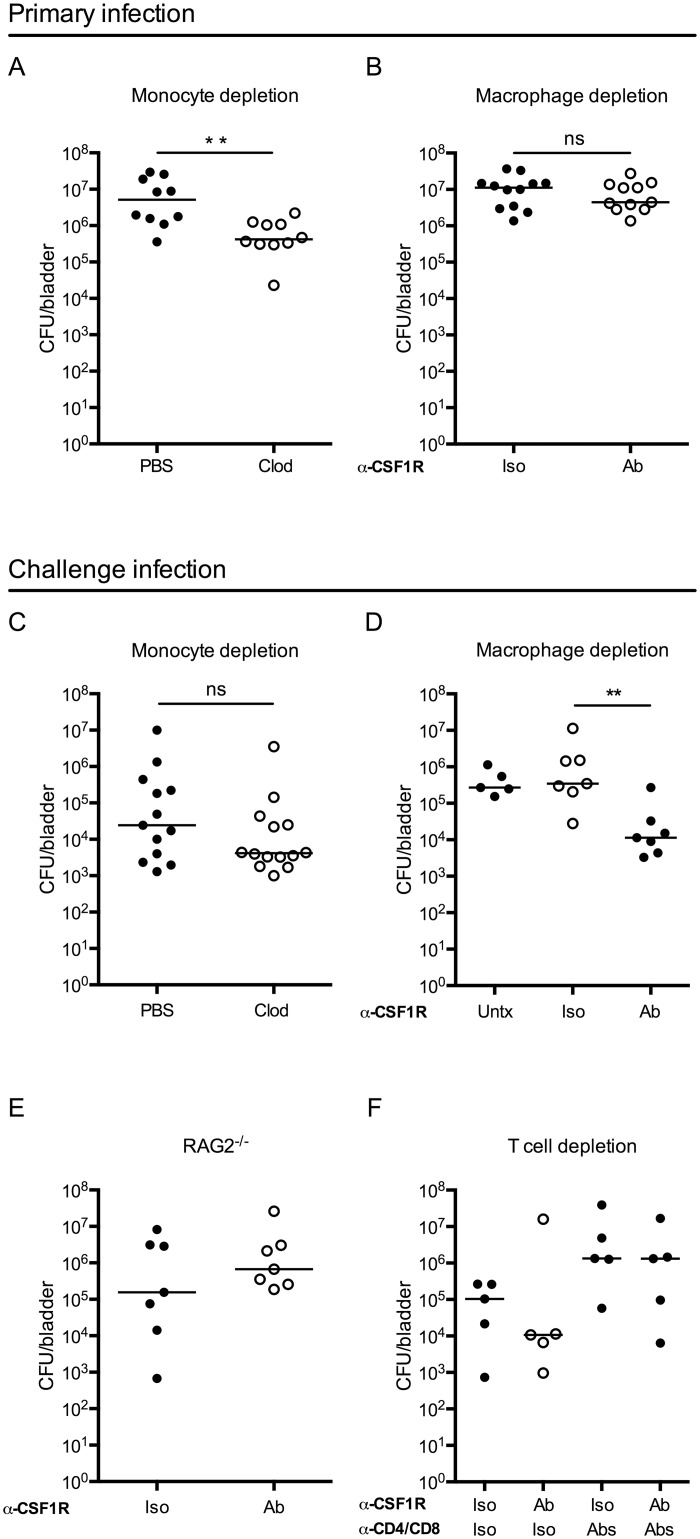
Urinary tract infection (UTI) is one of the most common bacterial infections with frequent recurrence being a major medical challenge. Development of effective therapies has been impeded by the lack of knowledge of events leading to adaptive immunity. Here, we establish conclusive evidence that an adaptive immune response is generated during UTI, yet this response does not establish sterilizing immunity. To investigate the underlying deficiency, we delineated the naïve bladder immune cell compartment, identifying resident macrophages as the most populous immune cell. To evaluate their impact on the establishment of adaptive immune responses following infection, we measured bacterial clearance in mice depleted of either circulating monocytes, which give rise to macrophages, or bladder resident macrophages. Surprisingly, mice depleted of resident macrophages, prior to primary infection, exhibited a nearly 2-log reduction in bacterial burden following secondary challenge compared to untreated animals. This increased bacterial clearance, in the context of a challenge infection, was dependent on lymphocytes. Macrophages were the predominant antigen presenting cell to acquire bacteria post-infection and in their absence, bacterial uptake by dendritic cells was increased almost 2-fold. These data suggest that bacterial uptake by tissue macrophages impedes development of adaptive immune responses during UTI, revealing a novel target for enhancing host responses to bacterial infection of the bladder.


Conflict of interest statement

The authors have declared that no competing interests exist.

Figures

Fig 1
Fig 1. An adaptive immune response is necessary for bacterial clearance during UPEC challenge infection.
(A) Experimental scheme used in the study. (B) Female C57Bl/6 (WT) or RAG2-/- mice were instilled with UTI89 and sacrificed 24 hours P.I. (1°) or challenged with an isogenic UPEC strain carrying a different antibiotic marker and sacrificed 24 hours P.I. (2°) to evaluate bacterial burden. (C) 12 weeks post-reconstitution, chimeric CD11c-DTR mice were treated with PBS or diphtheria toxin (DT) to eliminate DCs and infected with UTI89 24 hours post treatment. Mice were challenged with the isogenic UPEC strain and sacrificed 24 hours P.I. to measure CFU/bladder (2°). At the time of the challenge infection in (C), an additional group of naïve CD11c-DTR chimeric mice was infected with UTI89 to evaluate CFU after a primary UPEC infection (1°). (D-E) Graphs depict CFU/bladder of the primary strain from the infections in (B) and (C), respectively. Each dot represents one mouse, lines are medians. Experiments were performed 2 times with 5–7 mice per group in each experiment. *p = 0.0221, Mann-Whitney.
Fig 2
Fig 2. The bladder contains a diverse immune cell repertoire.
Naïve bladders from female C57Bl/6 mice were digested for flow cytometry. Single cell preparations were stained with antibodies indicated in Table 2. (A) Single, CD45+ cells were gated into 3 groups (i-iii) according to their CD11b and MHC II expression levels. (B) MHC II+ cells from gate (i) were divided into 3 populations, F480+ CD64+ macrophages (pink gate), CD11b+ DCs (blue gate) and CD103+ DCs (green gate). The expression levels of MHC II, CD64, F4/80, CD11c, CD103, and CD11b are depicted in the histograms (macrophages—pink lines, CD11b+ DCs—blue lines, CD103+ DCs—green lines). (C) MHC II- CD11b- cells from gate (ii) were subdivided by their expression of CD3 and NK1.1. CD3+ cells were divided into CD4+ and TCR γδ+ and the CD3- gate shows cKit+ IgE+ mast cells. (D) The dot plot, from gate (iii) depicts MHC II- CD11b+ F480int/+ eosinophils (purple gate) and monocytes (orange gate). Histograms depict expression levels of SiglecF and Ly6C from gate (iii) (eosinophils—purple lines, monocytes—orange lines). (E) Graphs depict immune cell populations in the naïve bladder as percentage of all CD45+ cells. Representative cytometry dot plots and histograms from different individual bladders are depicted, with the exception of the mast cell plot in (C), which depicts three pooled bladders due to the low number of mast cells. In (E), each dot represents one bladder, lines are medians, plots are pooled from three or more experiments.
Fig 3
Fig 3. Classical monocytes robustly enter the bladder and become macrophages.
In naïve C57Bl/6 mice, monocyte subsets were labeled in vivo as described in Materials and Methods. The designation “classical mo” and “nonclassical mo” indicates the monocyte subset labeled. Mice were infected with UTI89 24 hours after monocyte labeling and sacrificed at 4, 24, and 48 hours P.I. for flow cytometry. (A) Representative cytometry plots are shown, where gated bead+ cells (blue) are overlaid on all CD45+ bladder cells (gray). Graphs depict the quantitation of infiltrating monocytes over time, note difference in y-axis. (B) Histograms show the bead+ cell phenotype in the bladder over time after classical monocyte labeling (red lines—24 hours P.I., blue lines—48 hours P.I., and gray histograms—resident macrophages at 4 hours P.I., for reference). (C) Graphs show the percentage of all bead+ CD45+ cells after classical monocyte labeling in infected bladders by immune cell subset at 24 and 48 hours P.I. Each dot is one mouse, lines are medians. In (A) and (B), single representative bladders are displayed. Experiments were performed 3 times with 3–5 mice per group.
Fig 4
Fig 4. Macrophage depletion improves the adaptive response to UPEC infection.
Graphs show CFU per bladder 24 hours post primary infection (A) in mice treated with PBS or clodronate liposomes (Clod) to deplete monocytes 15–18 hours prior to infection and (B) in mice treated 24 hours prior to primary infection with isotype control (Iso) or CSF1R antibody (Ab). (C-F) Mice were given a primary infection, allowed to resolve, and 3 to 4 weeks P.I., mice were challenged with an isogenic UPEC strain, as in Fig 1A. Graphs show CFU per bladder 24 hours post challenge infection in (C) wildtype mice treated with PBS or clodronate-loaded liposomes (Clod) to deplete monocytes 15–18 hours prior to primary infection, (D) isotype (Iso) or CSF1R antibody (Ab) treated mice to deplete resident macrophages 24 hours prior to primary infection, or left untreated (Untx), (E) RAG2-/- mice treated with isotype (Iso) or CSF1R antibody (Ab) prior to primary infection or, (F) wildtype mice treated with isotype (Iso) or CSF1R antibody (Ab) to deplete resident macrophages and isotype (Iso) or anti-CD4 and anti-CD8 antibodies (Abs) to deplete T cells, prior to primary infection. Each dot is one mouse, lines are medians. Experiments were performed 2–4 times with 4–7 mice per group. **p = 0.0021, Mann-Whitney; ns: not significant.
Fig 5
Fig 5. Macrophage depletion does not impact effector cell infiltration or cytokine expression.
(A-B) Female C57Bl/6 mice were infected and then challenged with UPEC after resolution of their primary infection, as in Fig 1A. Twenty-four hours post-challenge, cellular infiltration into the bladder was evaluated by flow cytometry. Graphs depict cell number per bladder of the indicated populations. Experiment was repeated 3 times with 5–7 mice per group. (C) Mice were depleted with anti-CSF1R antibody and infected with 1x10⁷ CFU of UTI89 24 hours after depletion. Mice were sacrificed 24 hours P.I. and bladders were homogenized. Samples were stored at -80°C until all samples could be assessed together by Luminex multi-analyte profiling. Graphs depict the expression levels of selected cytokines in isotype antibody treated (black dots) and depleting-antibody treated (open circles) mice. Analytes are grouped by high expression (left graph) and low or no expression (right graph). Each dot represents a mouse, experiment performed 2 times with 5 mice per group and pooled, lines are medians. Additional analytes are shown in S6 Fig.
Fig 6
Fig 6. Macrophages preferentially take up UPEC at early times post-infection.
Female C57Bl/6 mice were instilled with UTI89-RFP and bladders were processed for flow cytometry at 4, 24, and 48 hours. (A) Representative plots, gated on CD45+ cells, depict the fluorescence level of UTI89-RFP in bladders, as compared to bladders infected with the nonfluorescent parental UTI89 strain. (B) Graphs depict the distribution of UPEC between MHC II+ and MHC II- cell populations (gated first on CD45+ cells) over time. (C) Representative flow plots display the distribution of bacteria in the MHC II+ cell populations by overlay of bacteria+ cells (blue) on top of all CD45+ cells (gray). (D) Graph depicts the number of UPEC+ macrophages and DCs over time. (E) Graphs show the distribution of UPEC in CD45+ MHC II+ macrophages and DCs as a percentage of UPEC acquired by all MHC II+ cells. In (B) and (E), each dot represents one mouse, lines are medians. In (A) and (C), single representative bladders are depicted. Experiments were performed 4 times with 4–7 mice per group and results pooled in (B), (D), (E).
Fig 7
Fig 7. Dendritic cells acquire more bacteria in the absence of macrophages.
Macrophages were depleted or not and mice were infected. Twenty-four hours post-primary infection, bladders were analyzed by flow cytometry to determine distribution of UPEC in (A) the MHC II- and MHC II+ compartments, (B) neutrophils and monocytes. (C) Plot depicts the total number of DCs present in the bladder 24 hours post-primary infection. (D-E) Plots depict the percentage distribution of UPEC in the MHC II+ compartment by cell population (D) DCs and (E) resident macrophages and monocyte-derived macrophages. Each dot represents one mouse, lines are medians. Experiments were repeated 3 times with 4–7 mice per group in each experiment and results pooled. p-values indicated on graphs, Mann-Whitney test.

References

    1. Foxman B (2010) The epidemiology of urinary tract infection. Nature reviews Urology 7: 653–660. 10.1038/nrurol.2010.190 - DOI - PubMed
    1. Russo TA, Johnson JR (2003) Medical and economic impact of extraintestinal infections due to Escherichia coli: focus on an increasingly important endemic problem. Microbes Infect 5: 449–456. - PubMed
    1. Johnson CC (1991) Definitions, classification, and clinical presentation of urinary tract infections. Med Clin North Am 75: 241–252. - PubMed
    1. Anderson GG, Dodson KW, Hooton TM, Hultgren SJ (2004) Intracellular bacterial communities of uropathogenic Escherichia coli in urinary tract pathogenesis. Trends Microbiol 12: 424–430. - PubMed
    1. Mysorekar IU, Hultgren SJ (2006) Mechanisms of uropathogenic Escherichia coli persistence and eradication from the urinary tract. Proc Natl Acad Sci U S A 103: 14170–14175. - PMC - PubMed

Publication types