. 2015 Jul 15;87(2):326-40.
doi: 10.1016/j.neuron.2015.06.028.

Single-Cell mRNA Profiling Reveals Cell-Type-Specific Expression of Neurexin Isoforms

Affiliations

Single-Cell mRNA Profiling Reveals Cell-Type-Specific Expression of Neurexin Isoforms

Marc V Fuccillo et al. Neuron. .

Abstract

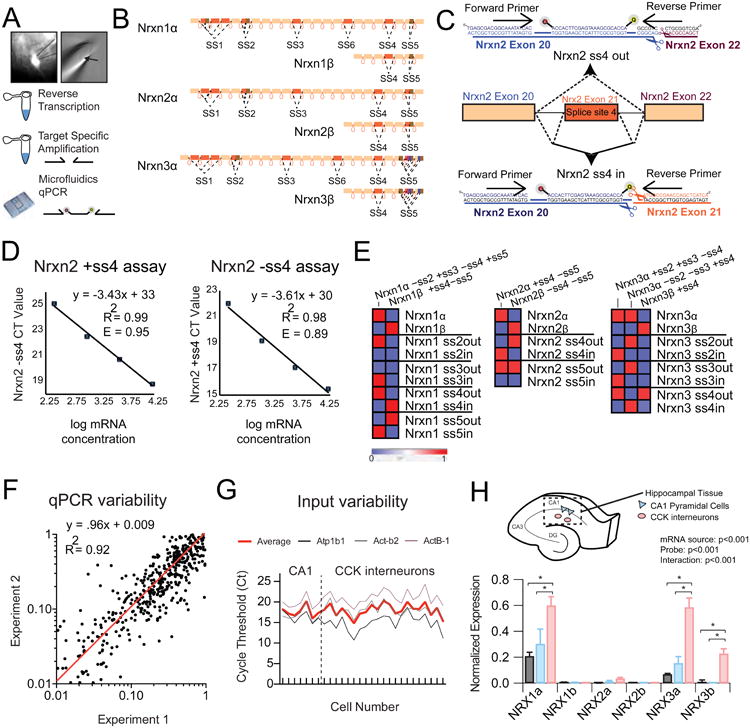
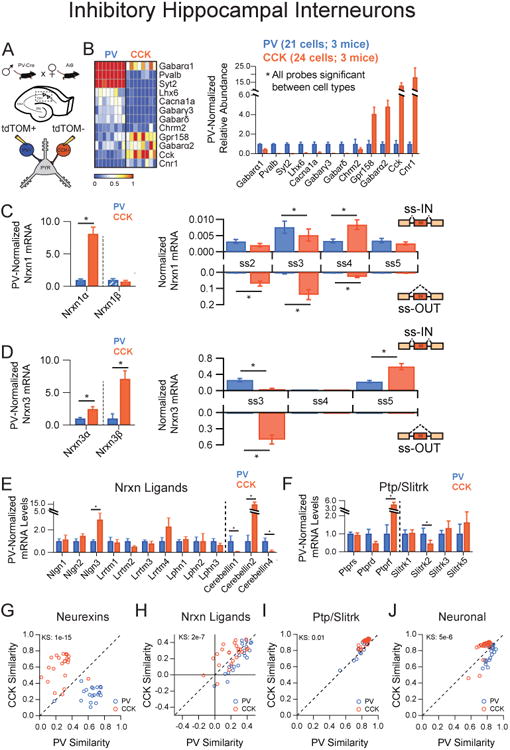
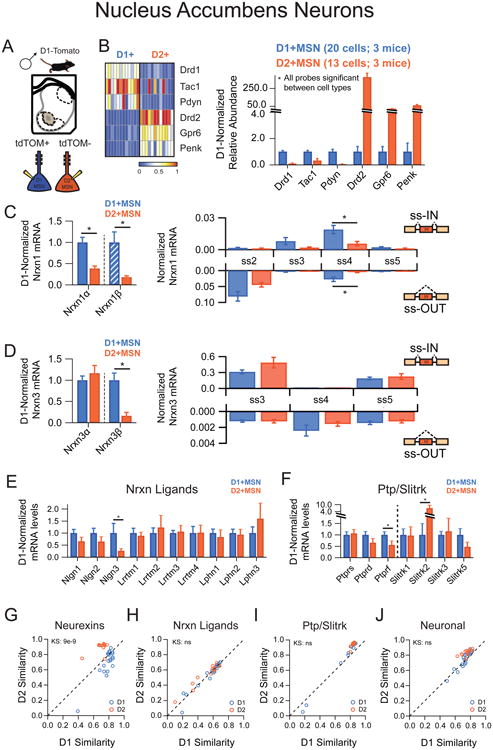
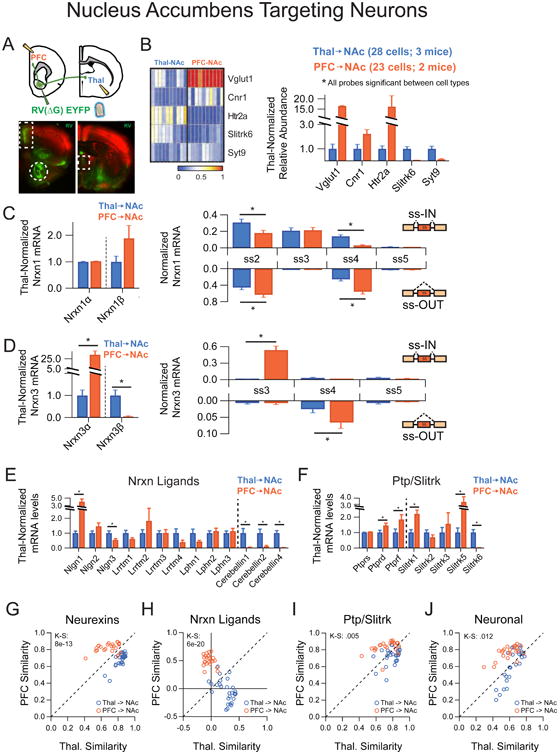
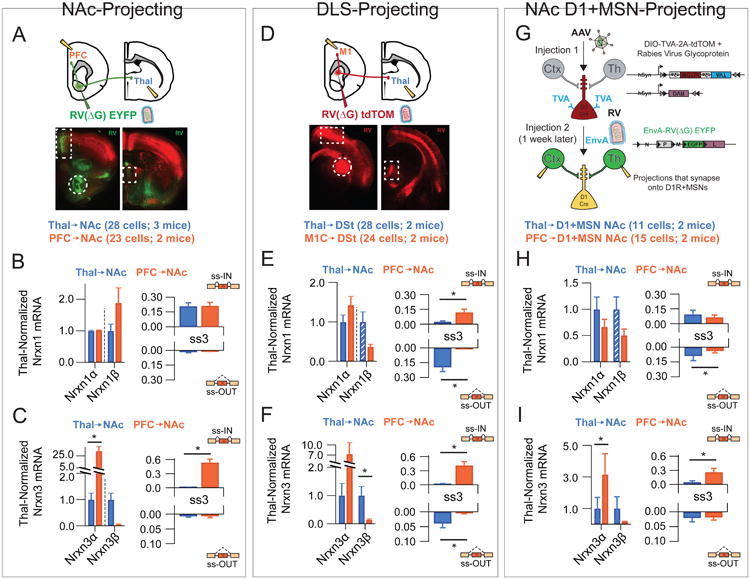
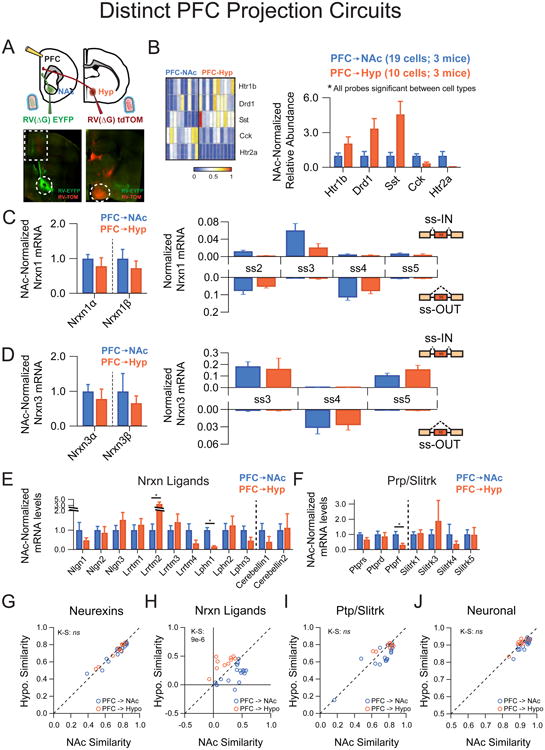
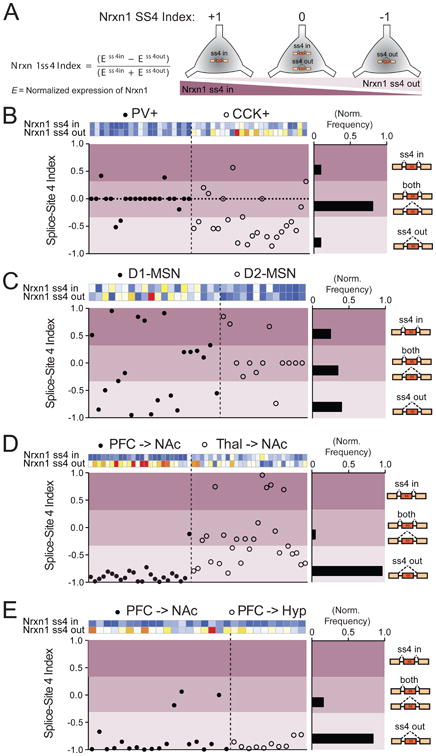
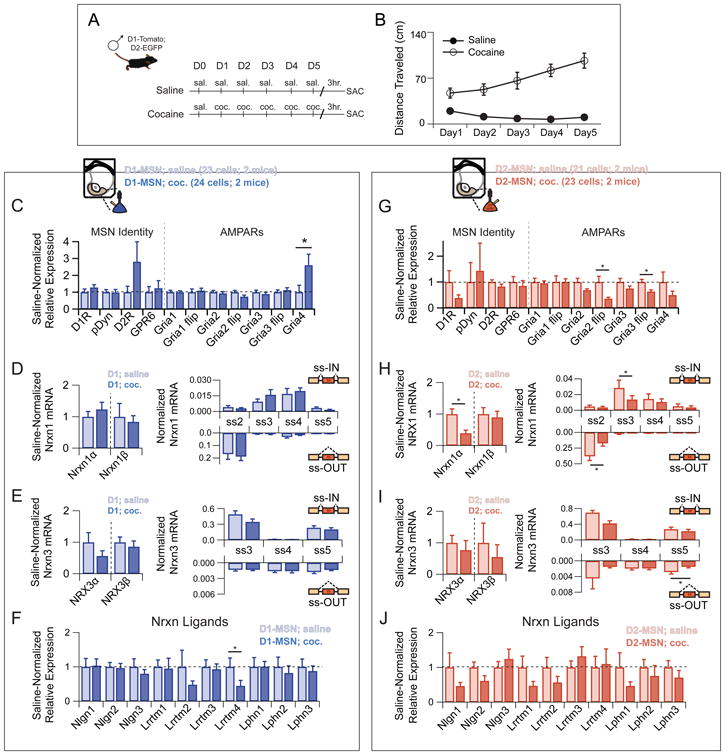
Neurexins are considered central organizers of synapse architecture that are implicated in neuropsychiatric disorders. Expression of neurexins in hundreds of alternatively spliced isoforms suggested that individual neurons might exhibit a cell-type-specific neurexin expression pattern (a neurexin code). To test this hypothesis, we quantified the single-cell levels of neurexin isoforms and other trans-synaptic cell-adhesion molecules by microfluidics-based RT-PCR. We show that the neurexin repertoire displays pronounced cell-type specificity that is remarkably consistent within each type of neuron. Furthermore, we uncovered region-specific regulation of neurexin transcription and splice-site usage. Finally, we demonstrate that the transcriptional profiles of neurexins can be altered in an experience-dependent fashion by exposure to a drug of abuse. Our data provide evidence of cell-type-specific expression patterns of multiple neurexins at the single-cell level and suggest that expression of synaptic cell-adhesion molecules overlaps with other key features of cellular identity and diversity.


Figures

Figure 1
Figure 1. Single-cell Neurexin transcriptional profiles are distinct from those observed in tissue samples
(A) Left: Image of 40x fluorescent field showing pipette extraction (solid outline) of GFP+ positive cell (dotted outline) from adult striatum. Right: Cellular contents and nucleus (arrow) within the extraction pipette. Bottom: General workflow from single cell extraction to target specific amplification of reverse-transcribed cDNA. (B) Schematic depicting the genomic architecture of Nrxn1-3. (C) An example strategy for the design of Nrxn2 ss4-specific primers is shown, which employs common forward primer and internal probe with unique reverse primer to differentiate inclusion or skipping of exon 21. (D) Primer efficiency determination through plotting of cycle threshold (Ct) versus mRNA concentration in serial dilution. (E) Heat map representation of cycle threshold for plasmid DNA with known splice-site content. (F) Measurement of trial-to-trial qPCR variability (experiment 1 versus experiment 2) for all probes across single cell cDNAs (n=24) demonstrates a near linear fit (red line). (G) Assessment of input variability for CA1 pyramidal cells and CCK+ interneurons by plotting of cycle threshold for 3 normalization probes across all collected single cells (3 probe average=red). (H) Top: Schematic depicting mRNA isolation from hippocampal CA1 field for transcriptional analysis of hippocampal tissue (n=6) and individual CA1 pyramidal cells (n=7) or stratum radiatum CCK interneurons (n=22). (Bottom) Averaged normalized expression for the long and short neurexin transcriptional isoforms for hippocampal tissue and single cell populations. Data are means + SEM; *significant difference between groups (ANOVA) with Tukey's multiple comparison post-hoc test.
Figure 2
Figure 2. Hippocampal interneurons exhibit cell-type specific neurexin expression patterns
(A) Illustration of the genetic cross employed to label hippocampal interneurons for pipette extraction. (B) Left: Heat map representation of normalized expression of PV+ and CCK+ interneurons for genes known to mark these subtypes. Right: Averaged single cell normalized expression for PV+ (n=21) and CCK+ (n=24). (C,D) Left: Nrxn α/β isoform expression, normalized to the average level in PV+ cells (hatched PV bars designate expression value <1%). Right: Splice site graph showing averaged single cell splice isoform expression values for ss-IN (upward bars) and ss-OUT (downward bars). (E,F) Averaged single cell normalized expression values for neurexin ligands (E, dotted line separates putative postsynaptic and secreted protein products) and the Ptp/Slitrk family (F, dotted line separates receptors from putative postsynaptic ligands). (G-J) Pearson coefficient correlation plots demonstrating the similarity of individual neurons to the two cell classes being compared for neurexin (G), neurexin ligands (H), Ptp/Slitrk family (I) and general neuronal transcripts (J). Cells are color coded according to their known genetic identity. The dashed unity line represents cells that are equally similar to both cell types. Data are means + SEM; *significant difference between groups (Mann Whitney U-test). Kolmogorav-Smirnov (KS) values are given for comparison of single cell groups in G-J.
Figure 3
Figure 3. Nucleus accumbens medium spiny neurons exhibit cell-type specific neurexin expression patterns
(A) Illustration of picking strategy to isolate D1R+ and D2R+ MSN subtypes (B) Left: Heat map representation of normalized expression of D1R+ and D2R+ MSNs for genes known to mark these subtypes. Right: Averaged single cell normalized expression for D1R+ (n=20) and D2R+ (n=13). (C,D) Left: Nrxnα/β isoform expression, normalized to the average level in D1R+ cells (hatched D1+MSN bars designate expression value <1%). Right: Splice site graph showing averaged single cell splice isoform expression values for ss-IN (upward bars) and ss-OUT (downward bars). (E,F) Averaged single cell normalized expression values for neurexin ligands (E) and the Ptp/Slitrk family (F). (G-J) Pearson coefficient correlation plots demonstrating the similarity of individual neurons to the two cell classes being compared for neurexins (G), neurexin ligands (H), Ptp/Slitrk family (I) and general neuronal transcripts (J). Cells are color coded according to D1R+ and D2R+ identity. Data are means + SEM; *significant difference between groups (Mann Whitney U-test). Kolmogorav-Smirnov (KS) values are given for comparison of single cell groups in G-J.
Figure 4
Figure 4. Two NAc-targeting neuronal populations do not share neurexin expression Patterns
(A) Top: Strategy for single-cell isolation of NAc inputs by injection of RV(AG)-EYFP into the NAc core. Bottom: Retrograde synaptic uptake of RV by neurons in the PFC (boxed, left picture) and midline thalamic nuclei (boxed, right picture) following injection into NAc core (circle, left picture). (B)Left: Heat map representation of normalized expression of Thal→NAc and PFC→NAc for genes known to mark these subtypes. Right: Averaged single cell expression for Thal→NAc (n=28) and PFC→NAc (n=23), normalized to Thal→NAc values. (C,D) Left: Nrxn α/β isoform expression, normalized to the average level in Thal→NAc cells. Right: Splice site graph showing averaged single cell splice isoform expression values for ss-IN (upward bars) and ss-OUT (downward bars). (E,F) Averaged single cell normalized expression values for neurexin ligands (E) and the Ptp/Slitrk family (F). (G-J) Pearson coefficient correlation plots demonstrating the similarity of individual neurons to the two cell classes being compared for neurexins (G), neurexin ligands (H), Ptp/Slitrk family (I) and general neuronal transcripts (J). Cells are color coded according to Thal→NAc and Thal→NAc identity. Data are means + SEM; *significant difference between groups (Mann Whitney U-test). Kolmogorav-Smirnov (KS) values are given for comparison of single cell groups in G-J.
Figure 5
Figure 5. Comparison of neurexin expression profiles across diverse striatal circuits
(A-C) Data for NAc RV injection have been reproduced from Figure 4 for comparison purposes. (D) Top: Strategy for single-cell isolation of DLS inputs by injection of RV(ΔG)-tdTOM into the DLS. Bottom: Retrograde synaptic uptake of RV by neurons in M1 (boxed, left picture) and midline thalamic nuclei (boxed, right picture) following injection into DLS (circle, left picture). Thalamus normalized expression of Nrxn1a/p (E, left) and Nrxn3a/p (F, left) in thalamo-(n=28) and cortico-(n=24) accumbal projection neurons and normalized expression of Nrx1α, splice-site 3 (E, right) and Nrxn3 a, splice-site 3 (F, right). (G) Top: Strategy for single-cell isolation of NAc D1R+MSN synaptic inputs by sequential injection procedure. Thalamus-normalized expression of Nrxn1α/β (H, left) and Nrxn3α/β (I, left) in thalamo-(n=11) and cortico-(n=15) accumbal projection neurons and normalized expression of Nrx1α, splice-site 3 (H, right) and Nrxn3 α, splice-site 3 (I, right). Data are means + SEM; *significant difference between groups (Mann Whitney U-test).
Figure 6
Figure 6. Neurexins do not display target-region specificity in two prefrontal circuits
(A) Top: Strategy for single-cell isolation of PFC neurons that project to nucleus accumbens (NAc) and hypothalamus (Hyp) by coinjection of RV(ΔG)-EYFP into the NAc core and RV(ΔG)-tdTOM into the Hyp. Bottom: Retrograde synaptic uptake of RVs injected into NAc (left, circle) and hypothalamus (right, circle) by neurons in adjacent portions of the PFC (left, boxed region). (B) Left: Heat map representation of normalized expression of PFC→NAc and PFC→Hyp for genes significantly different between these populations. Right: Averaged single cell expression for PFC→NAc (n=19) and PFC→Hyp (n=10), normalized to PFC→NAc values for each probe. (C,D) Left: Nrxn α/β isoform expression, normalized by probe to the average level in PFC→NAc cells. Right: Splice site graph showing averaged single cell splice isoform expression values for ss-IN (upward bars) and ss-OUT (downward bars). (E,F) Averaged single cell expression values for neurexin ligands (E) and the Ptp/Slitrk family (F), normalized to PFC→NAc values for each probe. (G-J) Pearson coefficient correlation plots demonstrating the similarity of individual neurons to the two cell classes being compared for neurexins (G), neurexin ligands (H), Ptp/Slitrk family (I) and general neuronal transcripts (J). Cells are color coded according to PFC→NAc and PFC→Hyp identity. Data are means + SEM; *significant difference between groups (Mann Whitney U-test). Kolmogorav-Smirnov (KS) values are given for comparison of single cell groups in G-J.
Figure 7
Figure 7. Single-cell regulation of Nrxn1 ss4 selection is dependent on brain region
(A) Description of Nrxn1 splice-site 4 index, which assesses exclusive presence of single splice isoforms or coexpression of Nrxn1ss4-IN and Nrxn1ss4-OUT transcripts. An index=0 represents roughly equal normalized expression values for both Nrx1ss4-IN and Nrxn1ss4-OUT probes. (B-E) Plot of splice-site 4 index for all single neurons collected in hippocampal interneuron (B, n=45 cells), NAc MSN (C, n=33 cells), NAc-projecting (D, n=51 cells), and divergent PFC projection (E, n=29 cells) experiments. Each plot shows the heat maps of both Nrx1ss4 probes for each cell, with the ss4 index plotted below. Splice-site territories were arbitrarily subdivided into ss4 in (index=0.33-1.00), both (index=-0.33– 0.33) and ss4 out (index=-1.0– -0.33) and normalized frequencies were calculated for each region (right histograms).
Figure 8
Figure 8. Neurexin transcriptional profiles undergo cell type-specific changes during the development of cocaine-evoked behavioral sensitization
(A) Behavioral paradigm for 5-day non-contingent cocaine administration. D1-Tom/D2-EGFP transgenic mice were sacrificed 3 hours after final cocaine injection. (B) Behavioral sensitization as manifest by steady increase in locomotor activity in the cocaine group as compared with saline controls over sequential days of cocaine administration. (C,G) Averaged single cell expression of markers of MSN identity and AMPA subtype glutamate receptors for saline versus cocaine treated mice of D1R+ (C) and D2R+ (G) MSN subtype, with expression values normalized to the saline controls for each probe. (D,H) Left: Averaged single cell expression of Nrxn1 isoforms for saline versus cocaine treated mice of D1R+ (D) and D2R+ (H) MSN subtype, with expression values normalized to the saline controls for each probe. Right: Splice site graph showing averaged single cell splice isoform expression values for ss-IN (upward bars) and ss-OUT (downward bars) for saline versus cocaine treated mice of D1R+ (D) and D2R+ (H) MSN subtype. (E,I) Left: Averaged single cell expression of Nrxn3 isoforms for saline versus cocaine treated mice of D1R+ (E) and D2R+ (I) MSN subtype, with expression values normalized to saline controls for each probe. Right: Splice site graph showing averaged single cell splice isoform expression values for ss-IN (upward bars) and ss-OUT (downward bars) for saline versus cocaine treated mice of D1R+ (E) and D2R+ (I) MSN subtype. (F,J) Averaged single cell expression of neurexin ligands for saline versus cocaine treated mice of D1R+ (C) and D2R+ (G) subtype, with expression values normalized to the saline controls for each probe. Data are means + SEM; *significant difference between groups (Mann Whitney U-test).

References

    1. Aoto J, Martinelli DC, Malenka RC, Tabuchi K, Südhof TC. Presynaptic neurexin-3 alternative splicing trans-synaptically controls postsynaptic AMPA receptor trafficking. Cell. 2013;154:75–88. - PMC - PubMed
    1. Araç D, Boucard AA, Ozkan E, Strop P, Newell E, Südhof TC, Brunger AT. Structures of neuroligin-1 and the neuroligin-1/neurexin-1 beta complex reveal specific protein-protein and protein-Ca2+ interactions. Neuron. 2007;56:992–1003. - PubMed
    1. Boucard AA, Chubykin AA, Comoletti D, Taylor P, Südhof TC. A splice code for trans-synaptic cell adhesion mediated by binding of neuroligin 1 to alpha- and beta-neurexins. Neuron. 2005;48:229–236. - PubMed
    1. Boucard AA, Maxeiner S, Südhof TC. Latrophilins function as heterophilic cell-adhesion molecules by binding to teneurins: regulation by alternative splicing. The Journal of Biological Chemistry. 2014;289:387–402. - PMC - PubMed
    1. Bowers MS, Chen BT, Bonci A. AMPA Receptor Synaptic Plasticity Induced by Psychostimulants: The Past, Present, and Therapeutic Future. Neuron. 2010;67:11–24. - PMC - PubMed

Publication types

MeSH terms

LinkOut - more resources