

Absence of catalytic domain in a putative protein kinase C (PkcA) suppresses tip dominance in Dictyostelium discoideum
- PMID: 26183108
- PMCID: PMC5371432
- DOI: 10.1016/j.ydbio.2015.05.021
Absence of catalytic domain in a putative protein kinase C (PkcA) suppresses tip dominance in Dictyostelium discoideum
Abstract
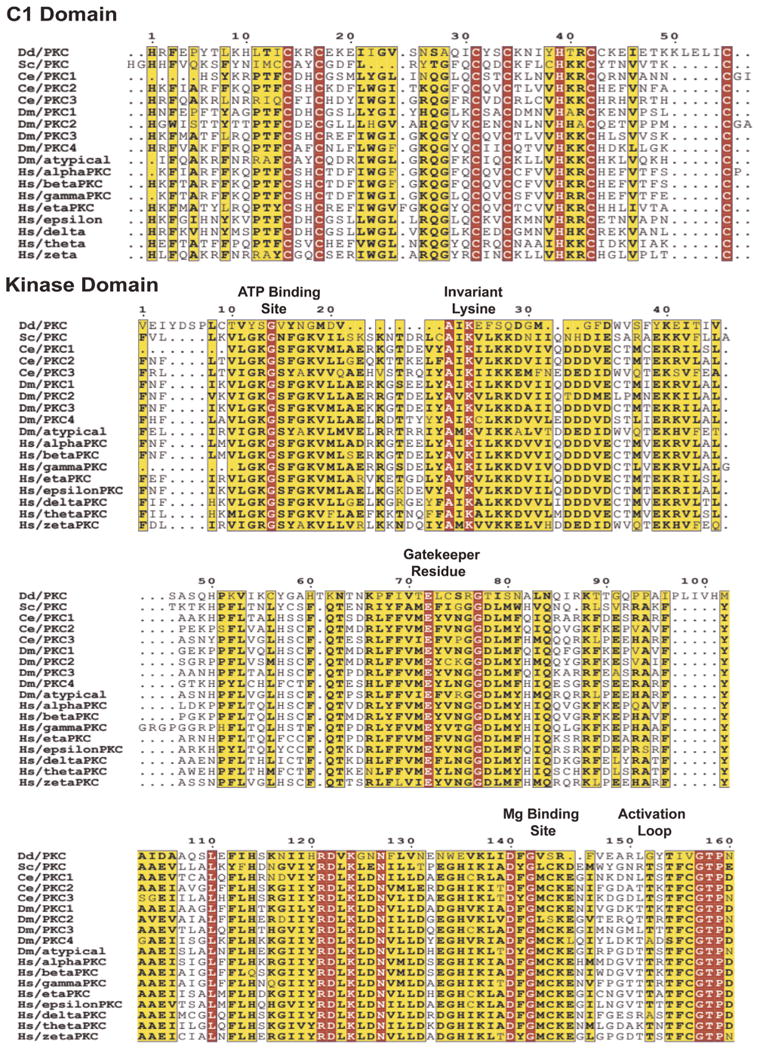
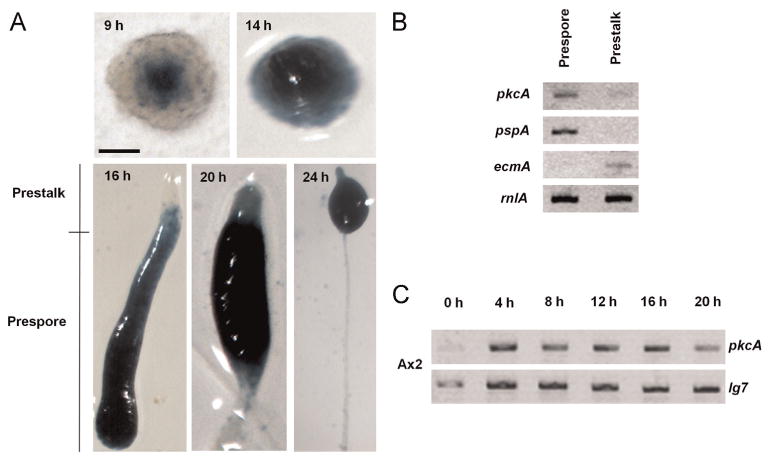
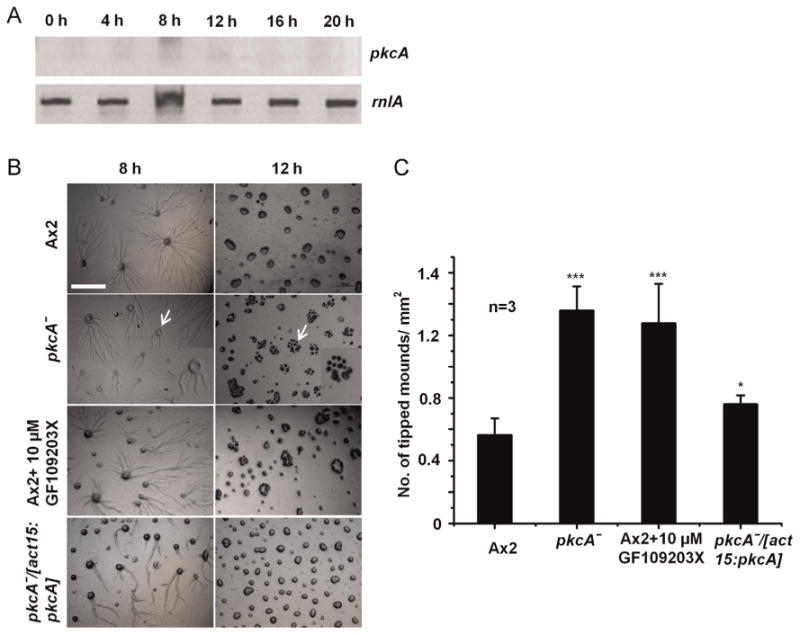
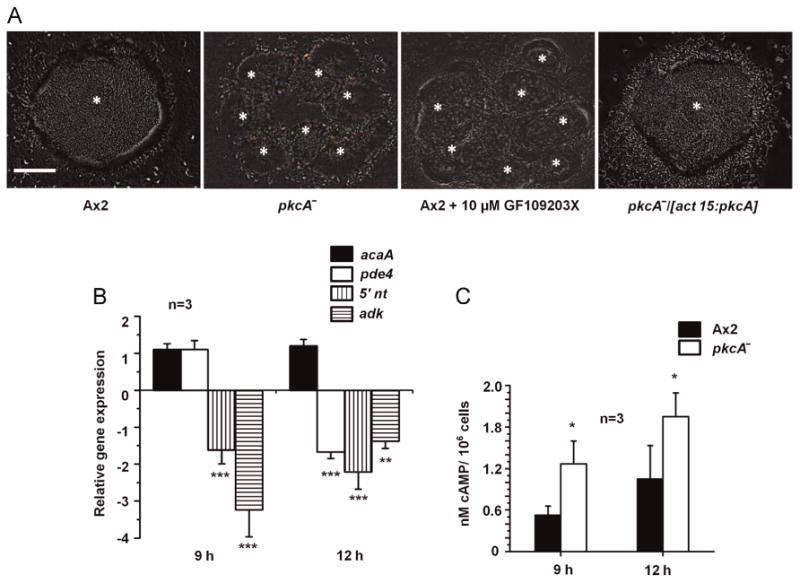
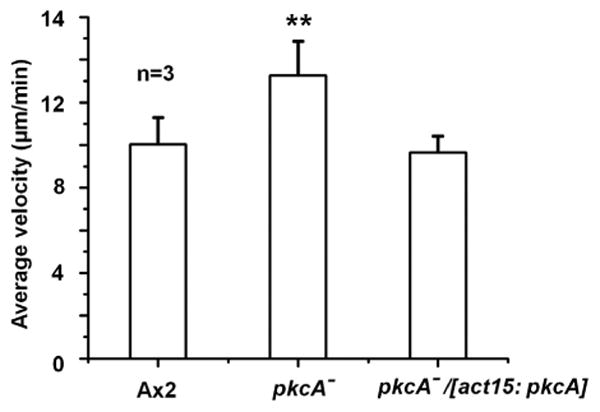
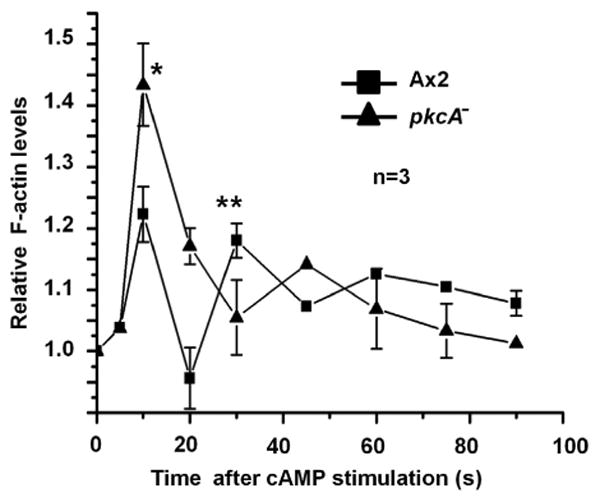
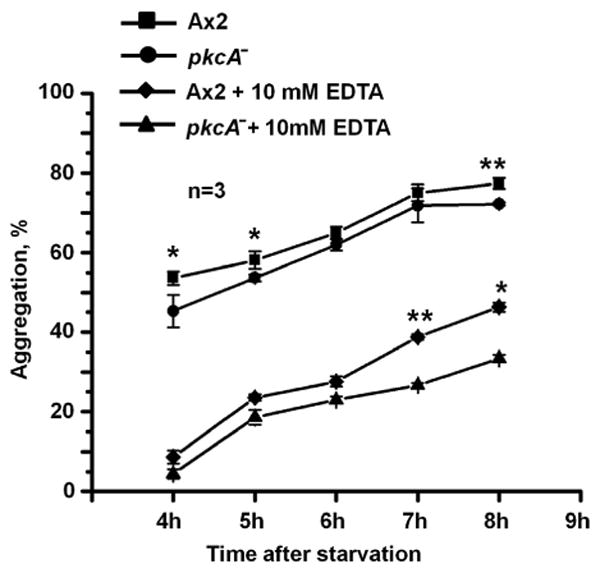
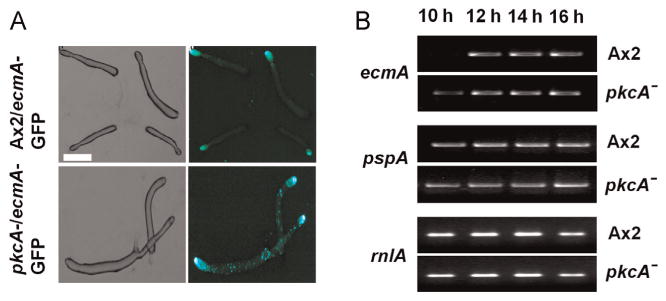
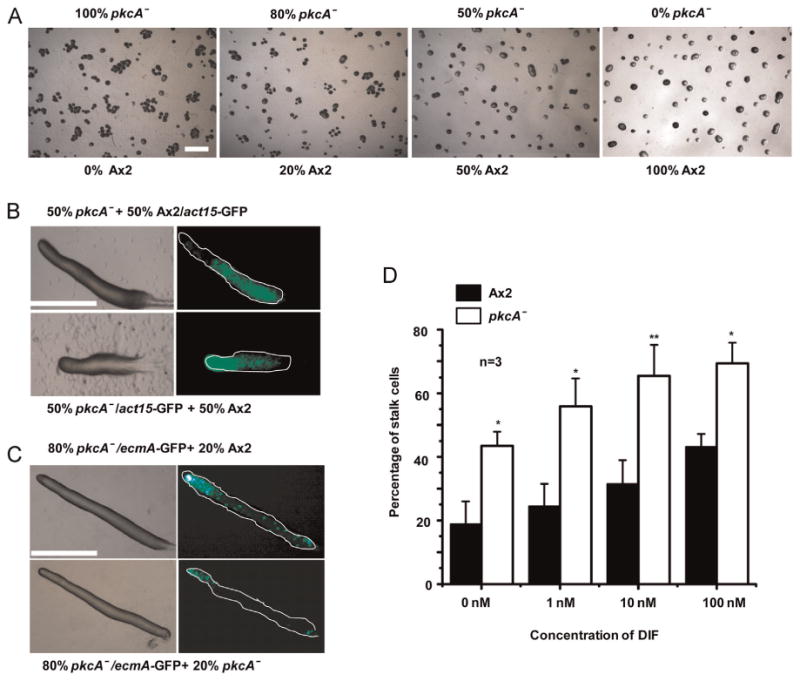
A number of organisms possess several isoforms of protein kinase C but little is known about the significance of any specific isoform during embryogenesis and development. To address this we characterized a PKC ortholog (PkcA; DDB_G0288147) in Dictyostelium discoideum. pkcA expression switches from prestalk in mound to prespore in slug, indicating a dynamic expression pattern. Mutants lacking the catalytic domain of PkcA (pkcA(-)) did not exhibit tip dominance. A striking phenotype of pkcA- was the formation of an aggregate with a central hollow, and aggregates later fragmented to form small mounds, each becoming a fruiting body. Optical density wave patterns of cAMP in the late aggregates showed several cAMP wave generation centers. We attribute these defects in pkcA(-) to impaired cAMP signaling, altered cell motility and decreased expression of the cell adhesion molecules - CadA and CsaA. pkcA(-) slugs showed ectopic expression of ecmA in the prespore region. Further, the use of a PKC-specific inhibitor, GF109203X that inhibits the activity of catalytic domain phenocopied pkcA(-).
Keywords: Dictyostelium; Differentiation; Morphogenesis; PKC; Tip dominance.
Copyright © 2015 Elsevier Inc. All rights reserved.
Conflict of interest statement
Figures
Similar articles
-
Functional interaction of PkcA and PldB regulate aggregation and development in Dictyostelium discoideum.Cell Signal. 2017 Jun;34:47-54. doi: 10.1016/j.cellsig.2017.02.022. Epub 2017 Feb 28. Cell Signal. 2017. PMID: 28257811 Free PMC article.
-
The thyroxine inactivating gene, type III deiodinase, suppresses multiple signaling centers in Dictyostelium discoideum.Dev Biol. 2014 Dec 15;396(2):256-68. doi: 10.1016/j.ydbio.2014.10.012. Epub 2014 Oct 24. Dev Biol. 2014. PMID: 25446527
-
cAMP-dependent protein kinase differentially regulates prestalk and prespore differentiation during Dictyostelium development.Development. 1993 Sep;119(1):135-46. doi: 10.1242/dev.119.1.135. Development. 1993. PMID: 8275851
-
The control of chemotactic cell movement during Dictyostelium morphogenesis.Philos Trans R Soc Lond B Biol Sci. 2000 Jul 29;355(1399):983-91. doi: 10.1098/rstb.2000.0634. Philos Trans R Soc Lond B Biol Sci. 2000. PMID: 11128992 Free PMC article. Review.
-
Regulation of cell differentiation and pattern formation in Dictyostelium development.Int J Dev Biol. 1994 Jun;38(2):311-9. Int J Dev Biol. 1994. PMID: 7981039 Review.
Cited by
-
A telomerase with novel non-canonical roles: TERT controls cellular aggregation and tissue size in Dictyostelium.PLoS Genet. 2019 Jun 25;15(6):e1008188. doi: 10.1371/journal.pgen.1008188. eCollection 2019 Jun. PLoS Genet. 2019. PMID: 31237867 Free PMC article.
-
An Autocrine Negative Feedback Loop Inhibits Dictyostelium discoideum Proliferation through Pathways Including IP3/Ca2.mBio. 2021 Jun 29;12(3):e0134721. doi: 10.1128/mBio.01347-21. Epub 2021 Jun 22. mBio. 2021. PMID: 34154396 Free PMC article.
-
Functional interaction of PkcA and PldB regulate aggregation and development in Dictyostelium discoideum.Cell Signal. 2017 Jun;34:47-54. doi: 10.1016/j.cellsig.2017.02.022. Epub 2017 Feb 28. Cell Signal. 2017. PMID: 28257811 Free PMC article.
-
An endogenous chemorepellent directs cell movement by inhibiting pseudopods at one side of cells.Mol Biol Cell. 2019 Jan 15;30(2):242-255. doi: 10.1091/mbc.E18-09-0562. Epub 2018 Nov 21. Mol Biol Cell. 2019. PMID: 30462573 Free PMC article.
-
Two endogenous Dictyostelium discoideum chemorepellents use different mechanisms to induce repulsion.Proc Natl Acad Sci U S A. 2025 Jun 3;122(22):e2503168122. doi: 10.1073/pnas.2503168122. Epub 2025 May 27. Proc Natl Acad Sci U S A. 2025. PMID: 40424125
References
-
- Abeliovich A, Chen C, Goda Y, Silva AJ, Stevens CF, Tonegawa S. Modified hippocampal long-term potentiation in PKCγ-mutant mice. Cell. 1993;75:1253–1262. - PubMed
-
- Bertholdt G, Stadler J, Bozzaro S, Fichtner B, Gerisch G. Carbohydrate and other epitopes of contact site A glycoprotein of Dictyostelium discoideum as characterized by monoclonal antibodies. Cell Differ. 1985;16:187–202. - PubMed
-
- Blagg SL, Stewart M, Sambles C, Insall RH. PIR121 regulates pseudopod dynamics and SCAR activity in Dictyostelium. Curr Biol. 2003;13:1480–1487. - PubMed
Publication types
MeSH terms
Substances
Grants and funding
LinkOut - more resources
Full Text Sources
Other Literature Sources
Molecular Biology Databases
Research Materials
Miscellaneous
