

Gains and losses of coral skeletal porosity changes with ocean acidification acclimation
- PMID: 26183259
- PMCID: PMC4518299
- DOI: 10.1038/ncomms8785
Gains and losses of coral skeletal porosity changes with ocean acidification acclimation
Abstract
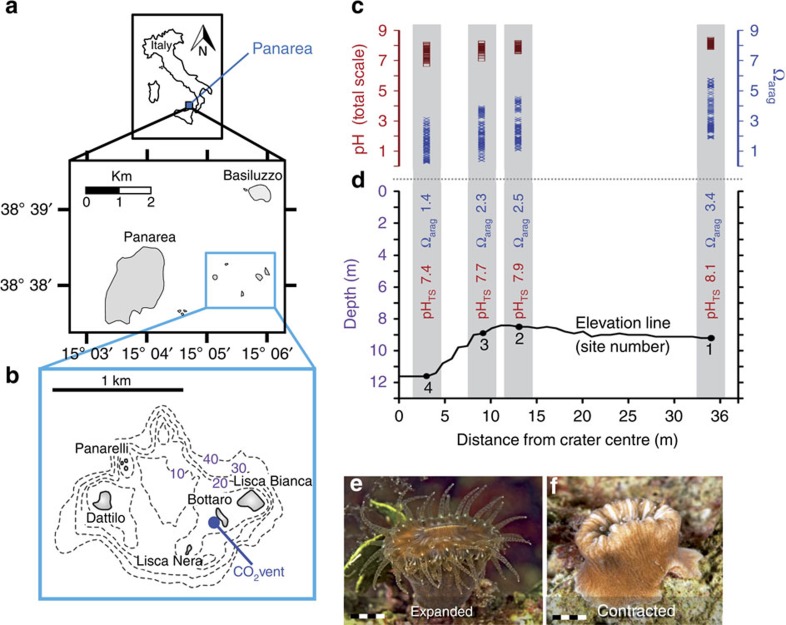
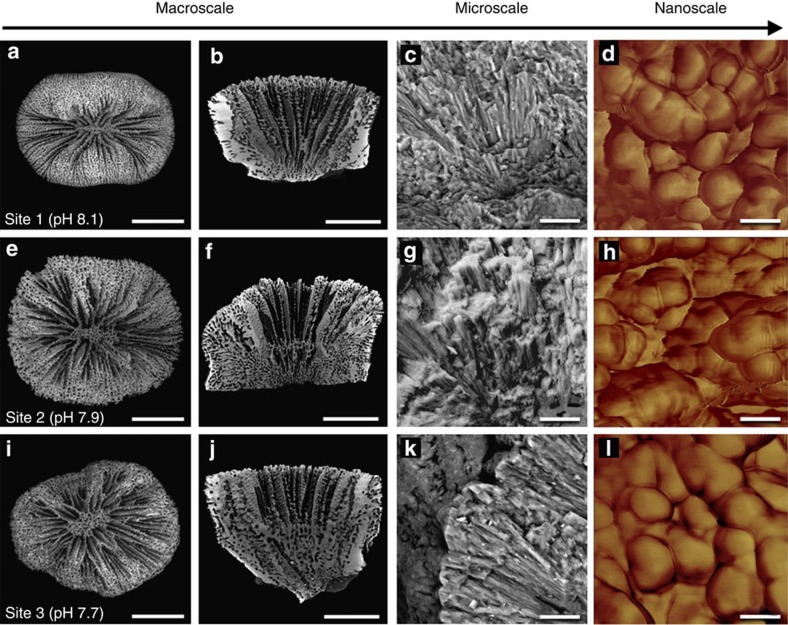
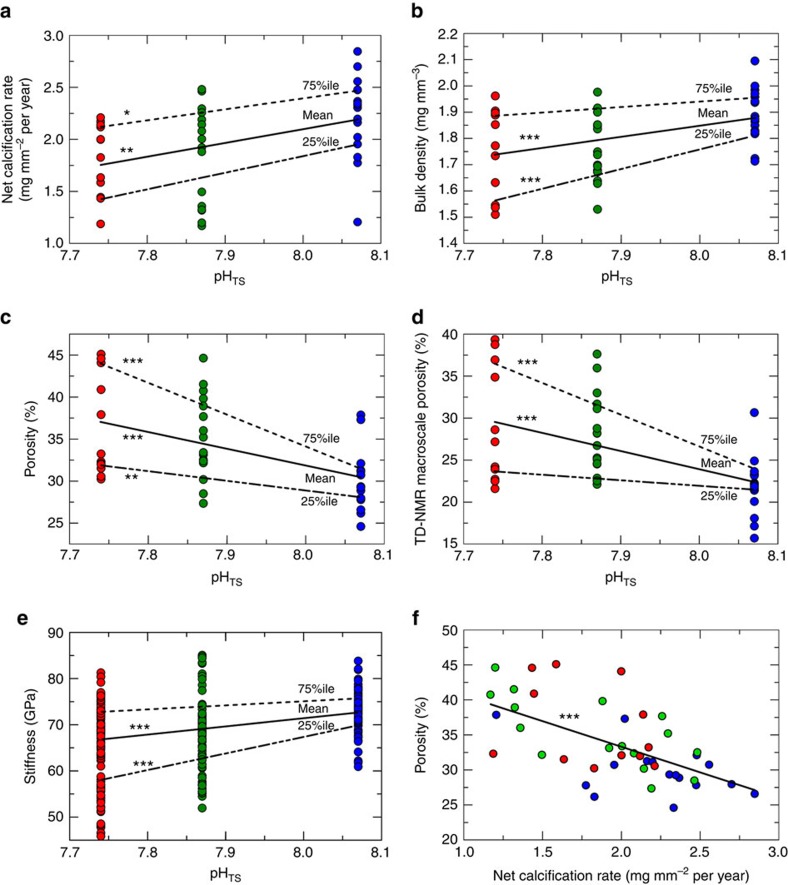
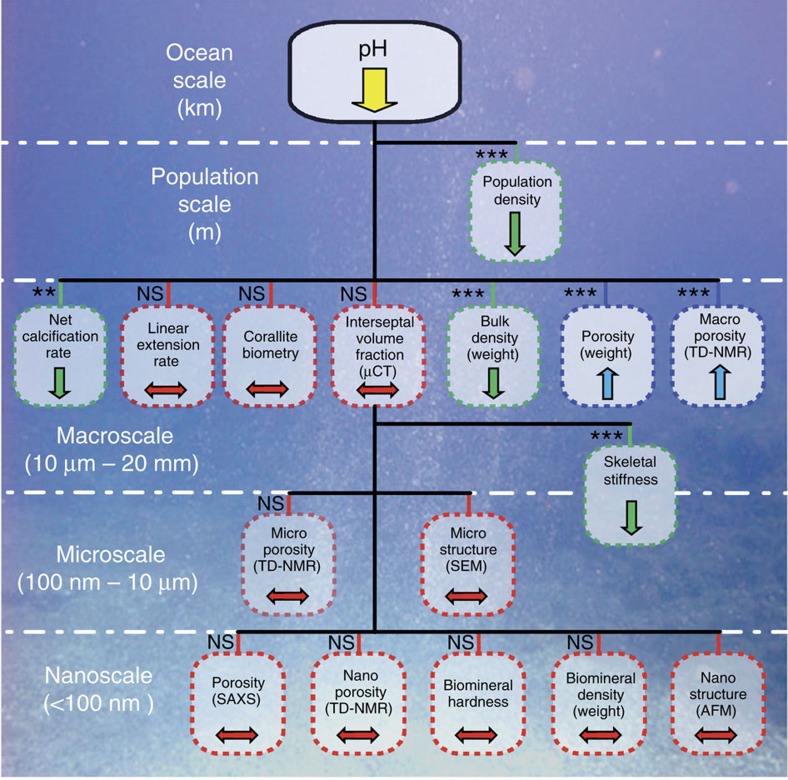
Ocean acidification is predicted to impact ecosystems reliant on calcifying organisms, potentially reducing the socioeconomic benefits these habitats provide. Here we investigate the acclimation potential of stony corals living along a pH gradient caused by a Mediterranean CO2 vent that serves as a natural long-term experimental setting. We show that in response to reduced skeletal mineralization at lower pH, corals increase their skeletal macroporosity (features >10 μm) in order to maintain constant linear extension rate, an important criterion for reproductive output. At the nanoscale, the coral skeleton's structural features are not altered. However, higher skeletal porosity, and reduced bulk density and stiffness may contribute to reduce population density and increase damage susceptibility under low pH conditions. Based on these observations, the almost universally employed measure of coral biomineralization, the rate of linear extension, might not be a reliable metric for assessing coral health and resilience in a warming and acidifying ocean.
Figures
Similar articles
-
Seawater temperature and buffering capacity modulate coral calcifying pH.Sci Rep. 2019 Feb 4;9(1):1189. doi: 10.1038/s41598-018-36817-y. Sci Rep. 2019. PMID: 30718522 Free PMC article.
-
pH variability at volcanic CO2 seeps regulates coral calcifying fluid chemistry.Glob Chang Biol. 2022 Apr;28(8):2751-2763. doi: 10.1111/gcb.16093. Epub 2022 Feb 4. Glob Chang Biol. 2022. PMID: 35119159
-
Ocean warming and acidification synergistically increase coral mortality.Sci Rep. 2017 Jan 19;7:40842. doi: 10.1038/srep40842. Sci Rep. 2017. PMID: 28102293 Free PMC article.
-
Climate change impacts on coral reefs: synergies with local effects, possibilities for acclimation, and management implications.Mar Pollut Bull. 2013 Sep 30;74(2):526-39. doi: 10.1016/j.marpolbul.2013.06.011. Epub 2013 Jun 28. Mar Pollut Bull. 2013. PMID: 23816307 Review.
-
Projecting coral reef futures under global warming and ocean acidification.Science. 2011 Jul 22;333(6041):418-22. doi: 10.1126/science.1204794. Science. 2011. PMID: 21778392 Review.
Cited by
-
Potential local adaptation of corals at acidified and warmed Nikko Bay, Palau.Sci Rep. 2021 May 27;11(1):11192. doi: 10.1038/s41598-021-90614-8. Sci Rep. 2021. PMID: 34045589 Free PMC article.
-
Coral micro- and macro-morphological skeletal properties in response to life-long acclimatization at CO2 vents in Papua New Guinea.Sci Rep. 2021 Oct 7;11(1):19927. doi: 10.1038/s41598-021-98976-9. Sci Rep. 2021. PMID: 34620911 Free PMC article.
-
Applying model approaches in non-model systems: A review and case study on coral cell culture.PLoS One. 2021 Apr 8;16(4):e0248953. doi: 10.1371/journal.pone.0248953. eCollection 2021. PLoS One. 2021. PMID: 33831033 Free PMC article. Review.
-
Uncovering the Role of Bicarbonate in Calcium Carbonate Formation at Near-Neutral pH.Angew Chem Int Ed Engl. 2021 Jul 19;60(30):16707-16713. doi: 10.1002/anie.202104002. Epub 2021 Jun 18. Angew Chem Int Ed Engl. 2021. PMID: 33973691 Free PMC article.
-
The impact of environmental acidification on the microstructure and mechanical integrity of marine invertebrate skeletons.Conserv Physiol. 2019 Nov 11;7(1):coz062. doi: 10.1093/conphys/coz062. eCollection 2019. Conserv Physiol. 2019. PMID: 31737270 Free PMC article. Review.
References
-
- Stocker T. F. et al.. in Climate Change 2013: The Physical Science Basis Cambridge Univ. Press (2013).
-
- Sabine C. L. et al.. The oceanic sink for anthropogenic CO2. Science 305, 367–371 (2004). - PubMed
-
- Six K. D. et al.. Global warming amplified by reduced sulphur fluxes as a result of ocean acidification. Nat. Clim. Change 3, 975–978 (2013).
-
- Rodolfo-Metalpa R. et al.. Coral and mollusc resistance to ocean acidification adversely affected by warming. Nat. Clim. Change 1, 308–312 (2011).
-
- Hoegh-Guldberg O. et al.. Coral reefs under rapid climate change and ocean acidification. Science 318, 1737–1742 (2007). - PubMed
Publication types
MeSH terms
Substances
Grants and funding
LinkOut - more resources
Full Text Sources
Other Literature Sources
