. 2015 Sep 4;290(36):22127-42.
doi: 10.1074/jbc.M115.652222. Epub 2015 Jul 16.

Fibroblast Growth Factor 9 Imparts Hierarchy and Vasoreactivity to the Microcirculation of Renal Tumors and Suppresses Metastases

Affiliations

Fibroblast Growth Factor 9 Imparts Hierarchy and Vasoreactivity to the Microcirculation of Renal Tumors and Suppresses Metastases

Hao Yin et al. J Biol Chem. .

Abstract

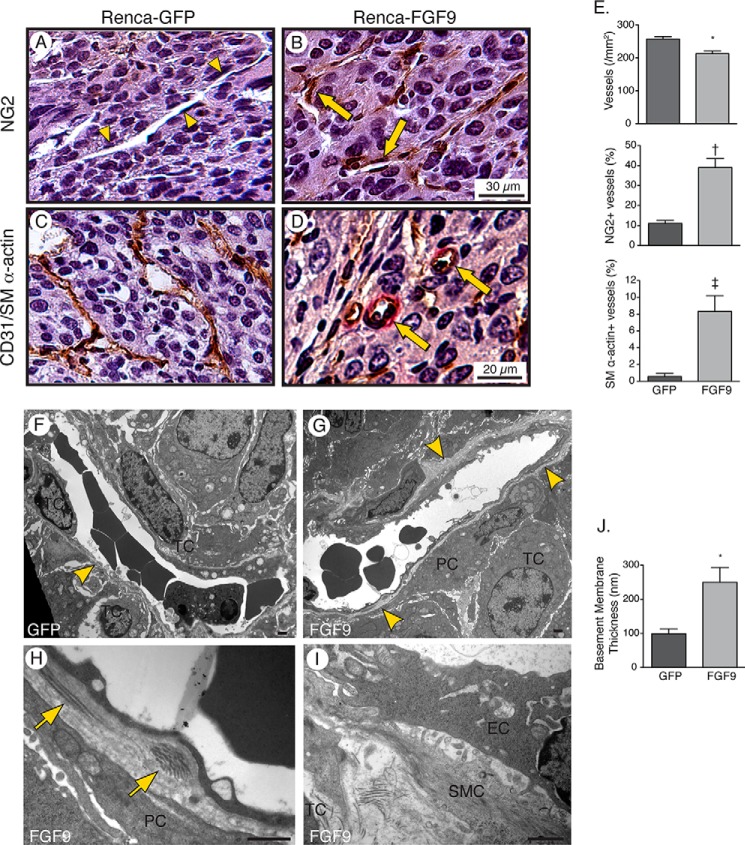
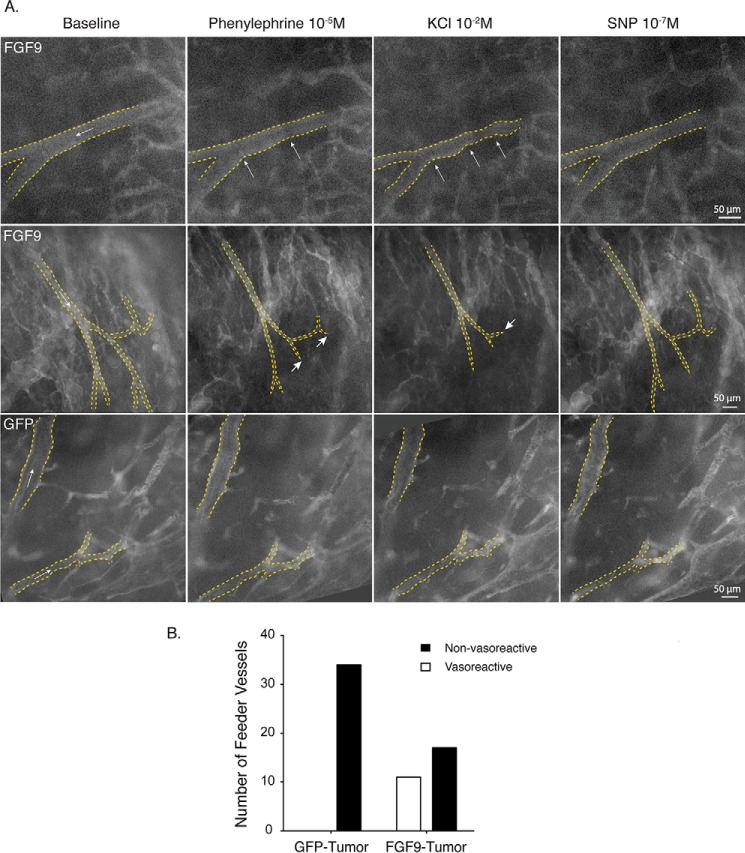
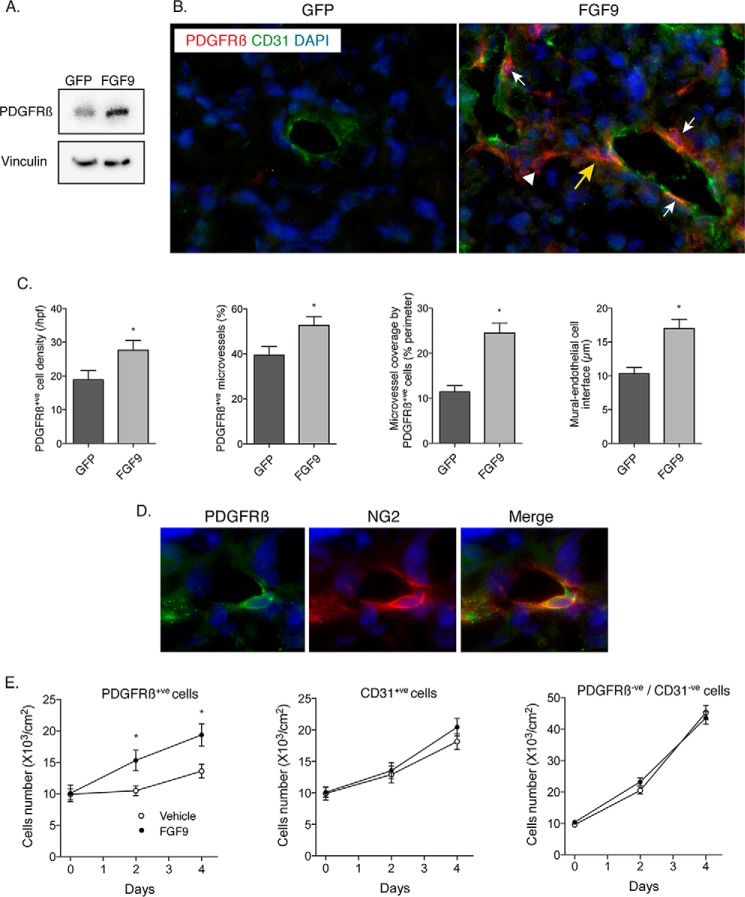
Tumor vessel normalization has been proposed as a therapeutic paradigm. However, normal microvessels are hierarchical and vasoreactive with single file transit of red blood cells through capillaries. Such a network has not been identified in malignant tumors. We tested whether the chaotic tumor microcirculation could be reconfigured by the mesenchyme-selective growth factor, FGF9. Delivery of FGF9 to renal tumors in mice yielded microvessels that were covered by pericytes, smooth muscle cells, and a collagen-fortified basement membrane. This was associated with reduced pulmonary metastases. Intravital microvascular imaging revealed a haphazard web of channels in control tumors but a network of arterioles, bona fide capillaries, and venules in FGF9-expressing tumors. Moreover, whereas vasoreactivity was absent in control tumors, arterioles in FGF9-expressing tumors could constrict and dilate in response to adrenergic and nitric oxide releasing agents, respectively. These changes were accompanied by reduced hypoxia in the tumor core and reduced expression of the angiogenic factor VEGF-A. FGF9 was found to selectively amplify a population of PDGFRβ-positive stromal cells in the tumor and blocking PDGFRβ prevented microvascular differentiation by FGF9 and also worsened metastases. We conclude that harnessing local mesenchymal stromal cells with FGF9 can differentiate the tumor microvasculature to an extent not observed previously.

Keywords: angiogenesis; fibroblast growth factor (FGF); hypoxia; metastasis; microvascular flow; tumor microenvironment; vascular biology; vasoreactivity.


Figures

FIGURE 1.
FIGURE 1.
FGF9 does not affect the proliferation or migration of Renca cells. A, SYBRSafe-stained agarose gel depicting RT-PCR transcripts in Renca cells (R) and primary mouse dermal fibroblasts (F) for FGF receptors. B, Western blots of phosphorylated and total ERK1/2 in mouse dermal fibroblasts, mouse embryonic fibroblasts, 10T1/2 cells, and Renca cells subjected to 50 ng/ml of recombinant FGF9 or vehicle for 10 min. C, Western blots of phosphorylated and total ERK1/2 in Renca cells subjected to 50 ng/ml of recombinant FGF2 or FGF9 for 10 min. D, left, population growth of Renca cells in RPMI 1640 incubated with FGF9 (50 ng/ml) and 0.5% FBS, with PBS and 0.5% FBS, or with 10% FBS. p < 0.001. Middle, population growth of Renca cells transduced with adenovirus containing cDNA encoding either human FGF9 or GFP and cultured in medium with 0.5 or 10% FBS. Cell numbers were quantified in triplicate wells over 7 days. Western blots of cells harvested 48 h after transduction are shown. Right, proliferation response to FGF9 of Renca cells, dermal fibroblasts, and 10T1/2 cells, relative to that of vehicle. *, p < 0.001 versus Renca cells; †, p = 0.004 versus Renca cells. E, apoptosis of Renca cells and mouse dermal fibroblasts in 0.5% FBS-containing medium for 2 days, as assessed by TUNEL assay. *, p < 0.001 versus vehicle. F, migration speed of Renca cells transduced with adenovirus encoding GFP or FGF9 (left) and of Renca cells and mouse dermal fibroblasts in vehicle or recombinant FGF9 (50 ng/ml) (right), as assessed by time-lapse microscopy. *, p = 0.036 versus vehicle.
FIGURE 2.
FIGURE 2.
FGF9 suppresses metastasis of Renca cell-derived renal tumors. A, photographs of kidney tumors harvested 14 days after renal subcapsular injection of Renca cells expressing either GFP or FGF9 in growth factor-reduced Matrigel. The corresponding, non-injected contralateral kidney is shown on the right of each photograph. Western blot showing detectable FGF9 expression Renca-FGF9 tumor is shown on the right. B, graph of kidney weights. *, p = 0.010 for GFP-expressing tumor versus right kidney; *, p = 0.003 for FGF9-expressing tumor versus right kidney; p = 0.89 for GFP- versus FGF9-expressing tumor (n = 6). C, graphs depicting the proliferation (left) and apoptosis (right) in renal tumors, as assessed by immunostaining for Ki-67 and TUNEL assay, respectively. D, micrographs of lungs harvested from mice 14 days after renal injection of Renca cells expressing GFP or FGF9. Macrometastases are evident as translucent distensions on the lung surface, with selected lesions in a digitally magnified region (box) depicted by the arrows. E, photomicrographs of 5-μm formalin-fixed lung sections stained with hematoxylin and eosin showing metastatic foci within lung parenchyma. F, graphs depicting the mean number of surface macro-metastases (*, p = 0.029), the density of intrapulmonary metastases (*, p = 0.004), and the size of metastatic foci (*, p = 0.019) in control and FGF9-expressing tumors.
FIGURE 3.
FIGURE 3.
FGF9 stimulates recruitment of vascular mural cells and deposition of a reinforced basement membrane. A–D, photomicrographs of 5-μm Tris-buffered zinc-fixed renal tumor sections harvested 14 days after renal injection of Renca cells expressing GFP and FGF9 and immunostained for NG2-positive pericytes (A and B) or CD31 (brown) and SM α-actin (red) (C and D). Arrowheads depict microvessel devoid of NG2-positive pericytes and arrows depict microvessels invested by pericytes. Some SM α-actin-positive microvessels have an arteriolar morphology (arrows). E, graphs depicting the density of microvessels (*, p = 0.003), percentage of microvessels invested with NG2-postive pericytes (†, p = 0.015), and percentage of microvessels associated with SM α-actin expressing cells (‡, p = 0.002), n = 6. F–I, transmission electron micrographs of microvessels showing an incomplete endothelial basement membrane (BM, arrowhead), with encroaching tumor cells (TC), in a 14-day GFP-expressing tumor (F). A circumferential basement membrane exists in the FGF9-expressing tumor (G, arrowheads) with pericytes (PC) and SMCs separating tumor cells from the vessel (G–I). Arrows depict fibrillar collagen deposits in the basement membrane. EC, endothelial cell. Bar, 1 μm. J, graph depicting the mean thickness of the basement membrane of tumor microvessels, measured from 25 microvessels in GFP-expressing tumors and 20 vessels in FGF9-expressing tumors (*, p = 0.017).
FIGURE 4.
FIGURE 4.
FGF9 imparts hierarchy to the tumor vasculature. A and B, ultraviolet fluorescence intravital microscopy images of red blood cells flowing within the vasculature of GFP-expressing (A) and FGF9-expressing (B) renal tumors 14 days after injection of Renca cells. GFP-expressing tumors (A) show a densely packed network of highly branched vessels. The network in FGF9-expressing tumors (B) is less dense and less branched. There is also a “smooth” appearance to some vessels in FGF9-expressing tumors, consistent with faster flow in an arterialized vessel (A), and a more irregular appearance in other vessels, with cell-free spaces in the lumen, consistent with slower flow in a venous structure (V). C, graphs depicting vascular length density (*, p = 0.034), lumen diameter (*, p < 0.001), and branch point density (*, p = 0.019). At least 10 fields of view were averaged for each mouse, with 3 GFP-expressing tumors and 4 FGF9-expressing tumors. D–F, higher magnification intravital images illustrating chaotic and serpentine flow routes (D, yellow arrows) and orphaned capillaries (E, white arrows) in GFP-expressing tumors, but ordered flow through an arterial-capillary-venous microcirculatory unit in an FGF9-expressing tumor (F). Arrows depict flow routes. C, capillary. G, graphs depicting the density of simple and complex microcirculatory units of arterial to capillary to venous flow (*, p < 0.001; †, p = 0.007), capillary density defined as vessels with single file red blood cell flow (p = 0.233), and percentage of capillaries positioned within a microcirculatory unit (*, p = 0.028). Movies corresponding to images in panels D, E, and F can be found in supplemental Videos S1, S3, and S4, respectively. Supplemental Video S2 depicts another example of bizarre step changes in lumen diameter and absence of flow hierarchy.
FIGURE 5.
FIGURE 5.
FGF9 imparts tumor vessels with vasoreactivity. A, intravital microscopy images of vessels within orthotopic renal tumors 10 days after injection of Renca cells, imaged live by intravital microscopy following injection of FITC-labeled dextran. Images depict the vascular lumen before and after subfusion of phenylephrine (10−5 m), KCl (10−2 m), and SNP (10−7 m), for a minimum of 3 min as indicated. Arrows within the lumen depict the direction of flow. Top panel, vessel within an FGF9-expressing tumor showing focal vasoconstriction (arrows) in response to phenylephrine subfusion, and both focal and diffuse constriction following KCl subfusion. The lumen diameter widens after subfusion with SNP. Middle panel, vessels within an FGF9-expressing tumor showing flow down a network with progressively smaller branches. Following phenylephrine subfusion, diffuse vessel constriction can be seen as well as complete cessation of flow in some of the distal vessel branches (short arrows). This is accompanied by a loss of fluorescence signal throughout the tumor, indicating widespread reduction in tumor perfusion. Diffuse vessel constriction, cessation of flow in distal vessels (short arrow), and generalized hypoperfusion are even more pronounced following KCl administration. These changes are partially reversed following delivery of SNP. Bottom panel, vessels within a GFP-expressing tumor showing no change in luminal diameter or flow indicators following delivery of vasomotor agents. B, plot of all vessels segments imaged, 20–70 μm in diameter and with continuous flow into progressively smaller branches, which displayed vasoreactivity. n = 34 and 28 vessels in GFP- and FGF9-expressing tumors, respectively. p = 0.0085. Movie corresponding to the middle row of images in panel A can be seen in supplemental Video S5.
FIGURE 6.
FIGURE 6.
FGF9 reduces tumor hypoxia. A, photomicrographs of formalin-fixed sections of orthotopic mouse renal tumors harvested 14 days after Renca cell injection and 30 min after intravenous infusion of Hydroxyprobe-1. Sections were immunostained for pimonidazole adducts. To optimize contrast, the image intensity range was compressed in Photoshop (Adobe), using an identical scale (83–223) for control and FGF9-expressing tumor samples. Line profiles of the raw yellow color channel signal intensity extracted from a line across the tumors with the starting location (0 mm) at the edge of each tumor, depicting hypoxia signal intensity, are shown below the respective images. B, graphs depicting the hypoxic area (*, p = 0.031), mean hypoxic intensity signal (*, p = 0.755), and hypoxia gradient from the non-hypoxic region to the edge of the maximally hypoxic zone (*, p = 0.010), n = 6.
FIGURE 7.
FIGURE 7.
FGF9 selectively amplifies PDGFRβ-positive stromal cells, which invest the tumor vasculature. A, Western blots showing the abundance of PDGFRβ in GFP- and FGF9-expressing tumors. B, fluorescence micrographs of renal tumors harvested 14 days after Renca cell injection and double-immunostained for CD31 (green) and PDGFRβ (red), with nuclear detection using DAPI (blue). There are scant PDGFRβ-positive cells in the control, GFP tumor. In the FGF9-expressing tumor, PDGFRβ-positive cells can be seen wrapping blood vessels (white arrows), in the tumor stroma unassociated with vessels (arrowhead), and in a pattern suggesting directed migration toward the blood vessel wall (yellow arrow). C, graphs indicating the total content of PDGFRβ-positive cells (*, p = 0.045), the proportion of PDGFRβ-positive blood vessels within the tumors (*, p = 0.028), the fractional coverage of blood vessels by PDGFRβ-positive cells (*, p < 0.001), and the length of individual PDGFRβ-positive cells that have invested the blood vessel (*, p < 0.001). D, fluorescence micrographs of renal tumors double-immunolabeled for PDGFRβ (green) and NG2 (red), with nuclei stained with DAPI (blue). Distinct patterns of PDGFRβ and NG2 immunoreactivities in the same perivascular cell are evident. E, graphs depicting the proliferation of PDGFRβ-expressing cells (left) CD31+ endothelial cells (middle), and PDGFRβ-negative/CD31-negative cells (right) harvested from renal tumors by magnetic bead isolation and incubated with FGF9 (50 ng/ml) or vehicle (*, p = 0.002).
FIGURE 8.
FIGURE 8.
PDGFRβ blockade abrogates the effects of FGF9 on tumor vessels and metastasis. A, micrographs of zinc-fixed renal tumor sections harvested 10 days after orthotopic injection of Renca cell and immunostained for NG2 (red) and VE-cadherin (brown) or SM α-actin (red) and CD31 (brown). PDGFRβ-blocking antibody or isotype-matched IgG was applied on day 7. On the right are graphs depicting the percentage of microvessels invested with NG2-positive pericytes or SM α-actin-positive mural cells (top, *, p = 0.026 versus GFP + IgG; †, p = 0.006 versus FGF9 + IgG) (lower, *, p = 0.027 versus GFP + IgG; †, p = 0.038 versus FGF9 + IgG). B, data from FGF9-incubated tumors exposed to anti-PDGFRβ antibody or control IgG, depicting vascular lumen diameter (*, p < 0.001), branch point density (*, p = 0.003), length density (p = 0.094) or capillary density (*, p = 0.046). Data are derived from analysis of intravital microscopy videos. C, hematoxylin and eosin-sections of lungs, harvested 10 days after orthotopic injection of FGF9-Renca cells with subsequent exposure of primary tumors to anti-PDGFRβ antibody or control IgG. On the right are graphs depicting the density and size of intrapulmonary metastases (*, p = 0.002; *, p < 0.001, respectively).

Similar articles

Cited by

References

    1. Folkman J. (1971) Tumor angiogenesis: therapeutic implications. N. Engl. J. Med. 285, 1182–1186 - PubMed
    1. Chung A. S., Lee J., Ferrara N. (2010) Targeting the tumour vasculature: insights from physiological angiogenesis. Nat. Rev. Cancer 10, 505–514 - PubMed
    1. Ebos J. M., Kerbel R. S. (2011) Antiangiogenic therapy: impact on invasion, disease progression, and metastasis. Nat. Rev. Clin. Oncol. 8, 210–221 - PMC - PubMed
    1. Jain R. K. (2005) Normalization of tumor vasculature: an emerging concept in antiangiogenic therapy. Science 307, 58–62 - PubMed
    1. Nagy J. A., Chang S. H., Dvorak A. M., Dvorak H. F. (2009) Why are tumour blood vessels abnormal and why is it important to know? Br. J. Cancer 100, 865–869 - PMC - PubMed

Publication types

MeSH terms

Substances