. 2016 Feb;23(2):279-90.
doi: 10.1038/cdd.2015.96. Epub 2015 Jul 17.

Sirtuin 1 suppresses mitochondrial dysfunction of ischemic mouse livers in a mitofusin 2-dependent manner

Affiliations

Sirtuin 1 suppresses mitochondrial dysfunction of ischemic mouse livers in a mitofusin 2-dependent manner

T G Biel et al. Cell Death Differ. 2016 Feb.

Abstract

Ischemia/reperfusion (I/R) injury is a major cause of morbidity and mortality after liver surgery. The role of Sirtuin 1 (SIRT1) in hepatic I/R injury remains elusive. Using human and mouse livers, we investigated the effects of I/R on hepatocellular SIRT1. SIRT1 expression was significantly decreased after I/R. Genetic overexpression or pharmacological activation of SIRT1 markedly suppressed defective autophagy, onset of the mitochondrial permeability transition, and hepatocyte death after I/R, whereas SIRT1-null hepatocytes exhibited increased sensitivity to I/R injury. Biochemical approaches revealed that SIRT1 interacts with mitofusin-2 (MFN2). Furthermore, MFN2, but not MFN1, was deacetylated by SIRT1. Moreover, SIRT1 overexpression substantially increased autophagy in wild-type cells, but not in MFN2-deficient cells. Thus, our results demonstrate that the loss of SIRT1 causes a sequential chain of defective autophagy, mitochondrial dysfunction, and hepatocyte death after I/R.


Figures

Figure 1
Figure 1
I/R causes SIRT1 loss. (a) Human liver tissue was collected before and during inflow occlusion and SIRT1 was immunoblotted. SIRT1 expression was normalized against β-actin and its expression relative to the value before ischemia was determined. (b) Mouse livers and (c) isolated mouse hepatocytes were subjected to in vivo and in vitro I/R, respectively, and SIRT1 was immunoblotted (n=3). SIRT1 levels were normalized against β-actin and its expression relative to the value at 0 min of ischemia was determined. (d) Hepatocytes were subjected to various periods of ischemia and necrosis was measured at 5, 60, and 120 min after reperfusion (n=5). **P<0.01 versus 1 h ischemia. (e) Hepatocytes were subfractionated into the cytosolic (C) and membrane (M) fraction during ischemia, and SIRT1 levels were immunoblotted (n=3). (f) After I/R, the changes in SIRT1 of hepatocytes were determined by immunoblotting (n=3). **P<0.01, and ***P<0.005
Figure 2
Figure 2
SIRT1 overexpression prevents MPT onset and necrosis after I/R in hepatocytes. (a) Hepatocytes were infected with AdGFP or AdSIRT1 (10 multiplicity of infection (MOI)), and exposed to 4 h of ischemia. Reperfusion-induced cell death was measured at 5, 60, and 120 min after reperfusion (n=3). **P<0.01. (b) Confocal images were collected with and without SIRT1 overexpression to evaluate MPT, ΔΨm, and necrosis after I/R. (c) Electron micrographs of the mitochondria with and without SIRT1 overexpression during I/R. Right panels represent magnified images of square inserts in left panels. Scale bar: 2 mm. (d) Cells were treated with resveratrol (RSV, 0.1 μM) or SRT1720 (0.1 μM) for 16 or 1 h, respectively, before ischemia. After 4 h of ischemia, reperfusion-induced cell death was measured (n=3). **P<0.01 versus RSV or SRT1720. (e) Cells from SIRT1 WT and KO mice were subjected to 2 or 4 h of ischemia and cell death was assessed after reperfusion (n=3). **P<0.01 versus WT after 2 h ischemia. (f) MPT onset and cell death (arrows) of WT and KO hepatocytes were visualized with confocal microscopy of TMRM, calcein, and PI after 2 h of ischemia
Figure 3
Figure 3
Calpain inhibition suppresses SIRT1 loss in hepatocytes. (a) The changes in SIRT1 mRNA were evaluated with RT-PCR. (b) Normoxic cells were treated with 35 μM of cycloheximide (CHX) for up to 24 h and SIRT1 was immunoblotted (n=3). SIRT1 levels were normalized against β-actin and its expression relative to the value at 0 h was determined. (c) SIRT1 expression after I/R was assessed at various titers of AdSIRT1. (d) Cells were treated with ALLM for 16 h before ischemia. After I/R, SIRT1 was immunoblotted. The changes in SIRT1 relative to the level at 0 h of reperfusion were plotted after normalization against β-actin (n=3). Necrosis in (e) WT and (f) SIRT1 KO cells with and without 10 μM of ALLM was measured after 4 h of ischemia (n=3). *P<0.05 and **P<0.01
Figure 4
Figure 4
SIRT1 induces autophagy. (a) Hepatocytes were subjected to I/R with and without chloroquine (CQ) to determine autophagic flux (n=4). The expression of LC3-II relative to the level at 0 h of ischemia (no CQ) was determined after normalization against β-actin. (b) After 4 h of ischemia, confocal images of GFP-LC3, TMRM, and PI were collected in three different cells at 1 h of reperfusion. Note cell death (arrows) in control cells and the onset of mitophagy (arrowheads) in the SIRT1-overexpressed cell. The number of autophagosomes was counted per cell after 20 images were randomly collected per analysis. (c) Confocal images of a tandem mCherry-GFP-LC3 after 4 h of ischemia. (d) Electron micrographs of hepatocytes during normoxia (top panels) and after 1 h of reperfusion following 4 h of ischemia (bottom panels). Arrowheads indicate autophagic vesicles. Scale bar: 2 μm. (e) WT and SIRT1 KO cells were treated with RSV or SRT1720 under normoxia, and autophagic flux was determined (n=3). The expression of LC3-II relative to the level of no treatment in WT was determined. (f) Autophagic flux after 2 h of ischemia was evaluated (n=3). The changes in LC3-II were plotted relative to the level at 0 h of ischemia in WT. *P<0.05 and **P<0.01
Figure 5
Figure 5
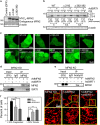
SIRT1 interacts with MFN2. (a) Protein expression before and after SIRT1 overexpression. **P<0.01. (b) Normoxic hepatocytes with different titers of AdSIRT1 were subfractionated into the cytosolic (C) and membrane (M) fraction, and SIRT1 was immunoblotted. (c) Immunoblotting of subcellular fractions with SIRT1, cytosolic (α-tubulin), mitochondrial (MFN1, MFN2, VDAC COX IV), endoplasmic reticulum (calnexin), and nuclear (Lamin B) markers. (d) The membrane fraction was immunoprecipitated (IP) with SIRT1 and subsequently immunoblotted with MFN or VDAC. (e) The membrane fraction was IP with MFN or acetyl-K, and immunoblotting with acetyl-K or MFN antibody, respectively. (f) IP and immunoblotting of human liver extracts
Figure 6
Figure 6
N-terminal deletion of MFN2 abrogates SIRT1-induced autophagy. (a) Validation of MFN2 mutant expression in HEK293T cells by immunoblotting. (b) Densitometric analysis of the LC3-II before and after CQ addition was performed to determine autophagic flux (n=5). *P<0.05. NS=nonsignificant. (c) Confocal images of GFP-LC3 with and without CQ. (d) After MFN2 KO MEFs were treated with AdMFN2 alone or both AdMFN2 and AdSIRT1, cell lysates were immunoprecipitated with MFN2, and immunoblotted subsequently with MFN2 or SIRT1. (e) The cell lysates from MFN2 KO MEF were immunoprecipitated with acetyl-K, followed by immunoblotting with MFN2. (f) Confocal images of mitochondrial morphology with TMRM. Bottom panels are magnified images of the square inserts. Mitochondrial morphology was scored by counting individual cell that has either elongated or fragmented mitochondria. **P<0.01
Figure 7
Figure 7
SIRT1-mediated autophagy and cytoprotection requires MFN2. (a) After 4 h of ischemia, cell death was determined with and without MFN2 knockdown (n=3). **P<0.01 and ***P<0.005 versus AdGFP+AdshSCR. (b) The changes in MFN2 levels with AdshMFN2 (n=3). (c) After 4 h of ischemia, autophagic flux was analyzed with and without MFN2 knockdown (n=3). (d) The effects of MFN2 knockdown on cell death were determined after 2 h of ischemia (n=3). (e) After 2 h of ischemia, the changes in protein levels were assessed with and without MFN2 knockdown (n=3). NS=nonsignificant. The effects of MFN2 knockdown on autophagic flux were evaluated (f) after 2 h of ischemia and (g) during normoxia (n=3). *P<0.05
Figure 8
Figure 8
SIRT1 overexpression suppresses mitochondrial and autophagic dysfunction after I/R in vivo in mouse livers. (a) SIRT1 and (b) LC3 were immunoblotted after 20 min of reperfusion with and without SIRT1 overexpression (n=3). *P<0.05 and **P<0.01. (c) Multiphoton images of Rd-123 were collected after reperfusion. The bottom panels are twice enlarged images of the top panels. Multiphoton microscopy of mCherry-GFP-LC3 was conducted (d) during normoxia and (e) after reperfusion. Yellow and red puncta represent autophagosomes and autolysosomes, respectively. The bottom panels represent magnified images of the square inserts at the top panels

References

    1. 1Kim J-S, He L, Qian T, Lemasters JJ. Role of the mitochondrial permeability transition in apoptotic and necrotic death after ischemia/reperfusion injury to hepatocytes. Curr Mol Med 2003; 3: 527–535. - PubMed
    1. 2Kim J-S, He L, Lemasters JJ. Mitochondrial permeability transition: a common pathway to necrosis and apoptosis. Biochem Biophys Res Commun 2003; 304: 463–470. - PubMed
    1. 3Mizushima N, Levine B, Cuervo AM, Klionsky DJ. Autophagy fights disease through cellular self-digestion. Nature 2008; 451: 1069–1075. - PMC - PubMed
    1. 4Kim J-S, Nitta T, Mohuczy D, O'Malley KA, Moldawer LL, Dunn WA Jr et al. Impaired autophagy: a mechanism of mitochondrial dysfunction in anoxic rat hepatocytes. Hepatology 2008; 47: 1725–1736. - PMC - PubMed
    1. 5Wang JH, Ahn IS, Fischer TD, Byeon JI, Dunn WA Jr, Behrns KE et al. Autophagy suppresses age-dependent ischemia and reperfusion injury in livers of mice. Gastroenterology 2011; 141: 2188–2199. - PMC - PubMed

Publication types

LinkOut - more resources