. 2015 Jul 17;349(6245):316-20.
doi: 10.1126/science.aaa8064. Epub 2015 Jul 16.

Inflammation. Neutrophil extracellular traps license macrophages for cytokine production in atherosclerosis

Affiliations

Inflammation. Neutrophil extracellular traps license macrophages for cytokine production in atherosclerosis

Annika Warnatsch et al. Science. .

Abstract

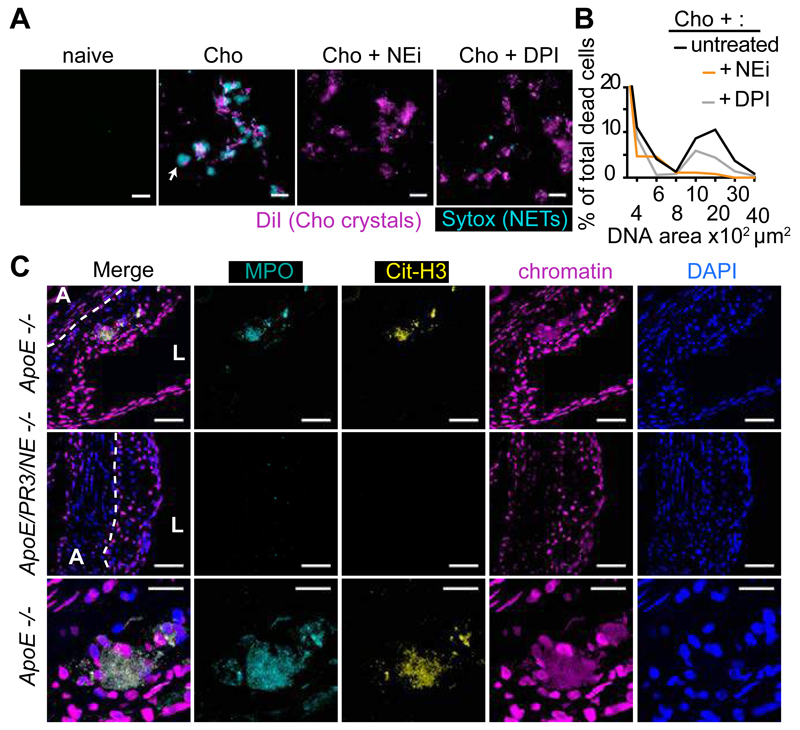
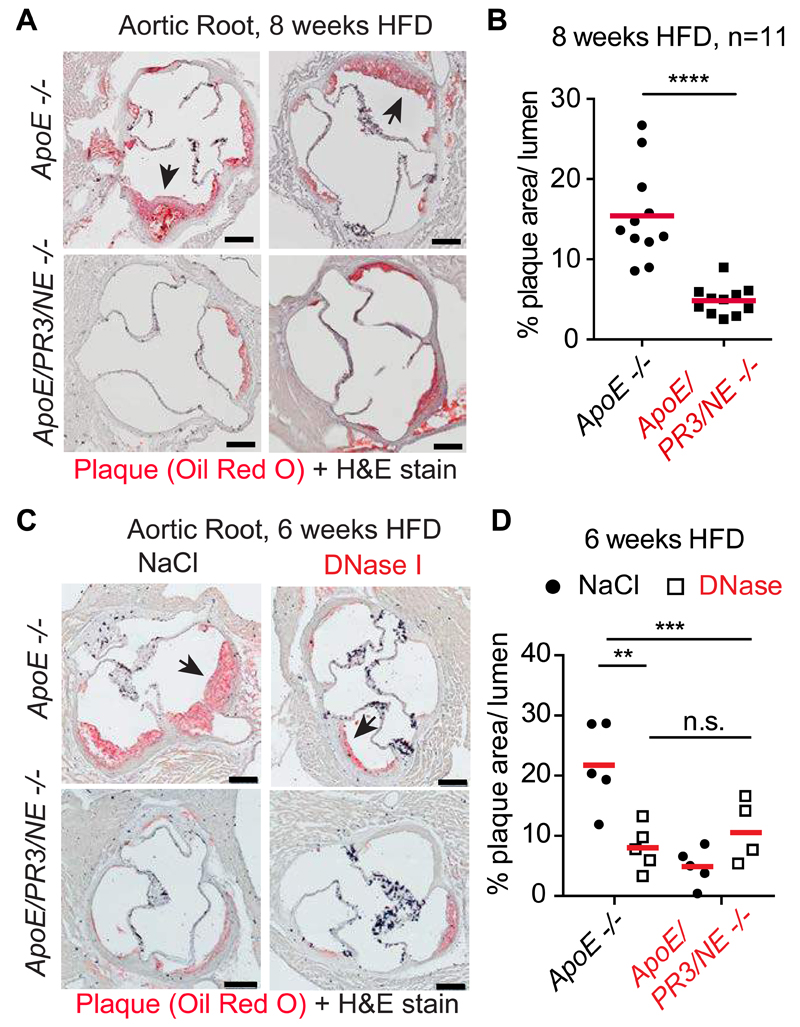
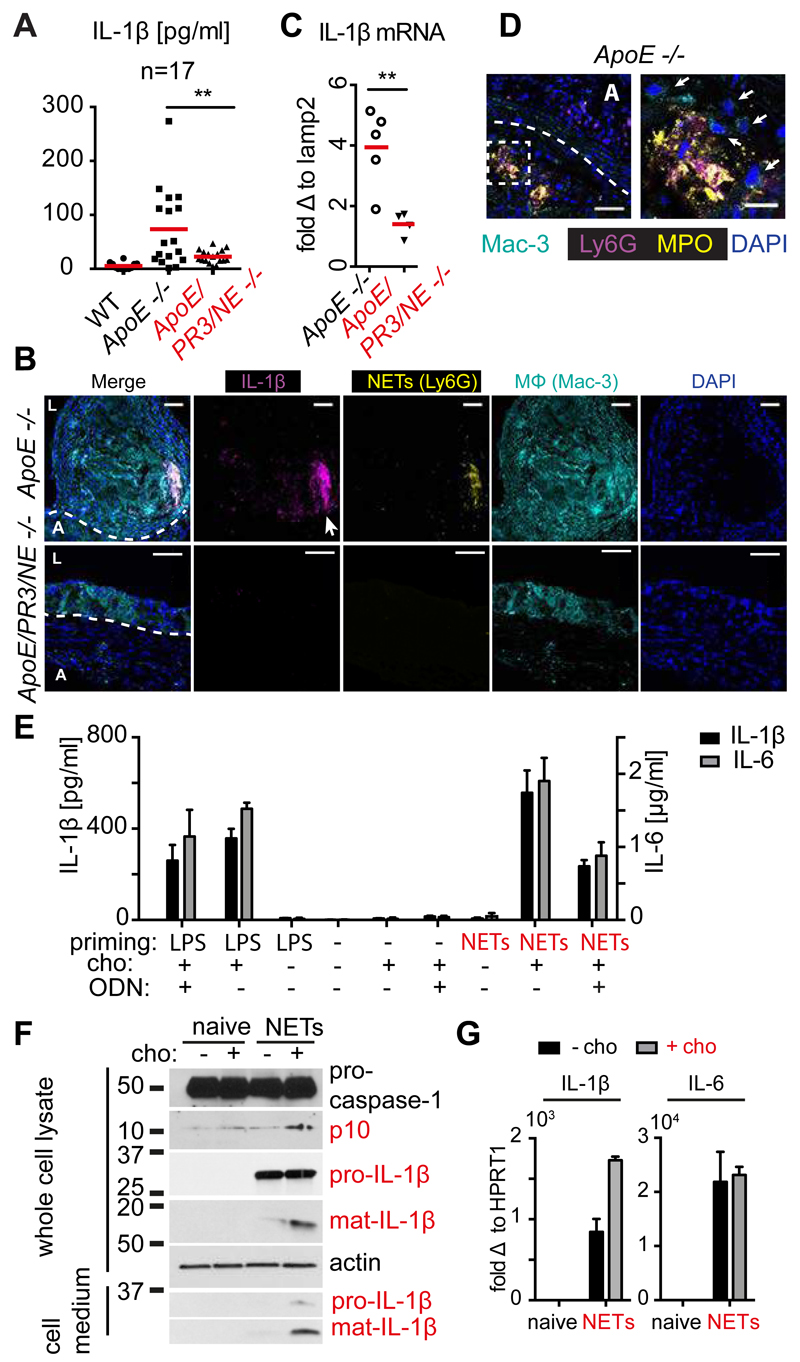
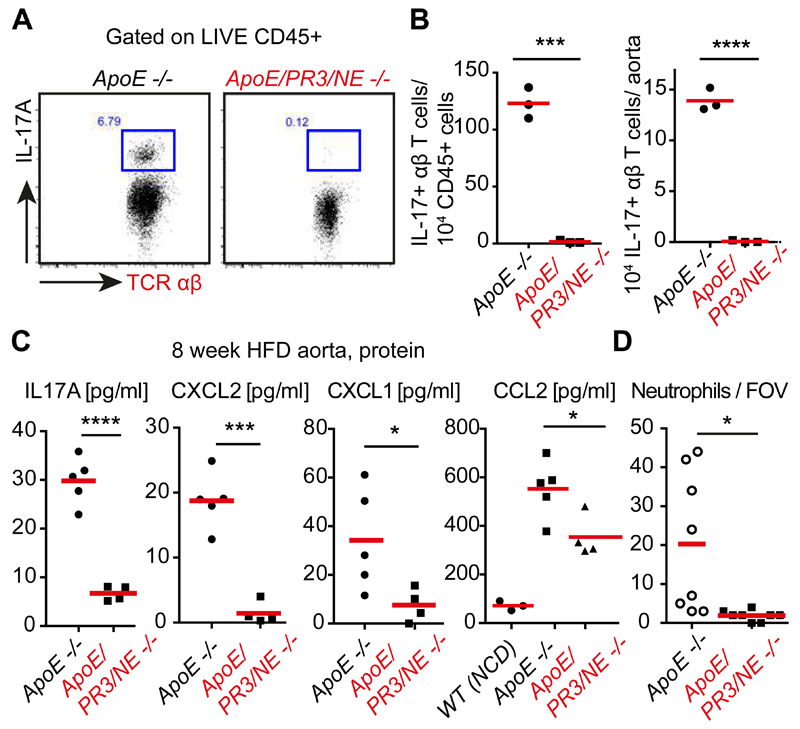
Secretion of the cytokine interleukin-1β (IL-1β) by macrophages, a major driver of pathogenesis in atherosclerosis, requires two steps: Priming signals promote transcription of immature IL-1β, and then endogenous "danger" signals activate innate immune signaling complexes called inflammasomes to process IL-1β for secretion. Although cholesterol crystals are known to act as danger signals in atherosclerosis, what primes IL-1β transcription remains elusive. Using a murine model of atherosclerosis, we found that cholesterol crystals acted both as priming and danger signals for IL-1β production. Cholesterol crystals triggered neutrophils to release neutrophil extracellular traps (NETs). NETs primed macrophages for cytokine release, activating T helper 17 (TH17) cells that amplify immune cell recruitment in atherosclerotic plaques. Therefore, danger signals may drive sterile inflammation, such as that seen in atherosclerosis, through their interactions with neutrophils.


Figures

Figure 1.
Figure 1.. Cholesterol crystals trigger NETosis.
(A) Fluorescence micrograph of neutrophils incubated with cholesterol crystals and stained with the lipid dye Dil (red) and extracellular DNA (Sytox, green). Neutrophils were left untreated or treated with NE inhibitor (NEi) or the NADPH oxidase inhibitor DPI. Scale bar: 100 μm. (B) Quantitation of NETosis in (A). Data are representative of 3 independent experiments. (C) Representative confocal immunofluorescence microscopy images of aortic root sections from ApoE -/- and ApoE/NE/PR3 -/- mice placed on HFD for 8 weeks and stained for MPO (cyan), citrullinated histone 3 (cit-H3, yellow), chromatin (magenta) and DNA (DAPI, blue). Border between the adventitia (A) and the lesion (dotted line) and lumen (L) are shown. Scale bar: 50 μm. The third row shows detail of the white boxed area showing NETs (arrow) Scale bar: 20 μm. Representative data of 8 mice analyzed per strain from 2 independent experiments.
Figure 2.
Figure 2.. NETs promote atherosclerosis.
(A) Two representative microscopy images of aortic root sections from ApoE -/- and ApoE/NE/PR3 -/- mice placed on HFD for 8 weeks and stained for lipid (Oil Red O, red) and Haematoxylin. (B) Quantitation of plaque area relative to the area of the aortic lumen from (A). Representative data of 11 mice per strain pooled from 2 independent experiments. Each point is the mean from multiple sections per animal (C) Representative microscopy images of aortic root sections from ApoE -/- and ApoE/NE/PR3 -/- mice placed on HFD for 6 weeks and regularly injected intravenously with 120U DNase or vehicle control 0.9% NaCl. Stained for lipid (Oil Red O, red) and Haematoxylin. (D) Quantitation of (C) as in (B). Representative data of 4 or 5 mice analysed per strain and condition. A power analysis revealed 92% power for the difference of means between 0.9% NaCl- and DNase-treated ApoE -/- mice. Statistics by Student’s t-test for single comparison and two-way ANOVA, followed by Sidak’s multiple comparison post test for multiple comparisons: * p<0.05, ** p<0.01, *** p<0.001, **** p<0.0001.
Figure 3.
Figure 3.. NETs prime macrophages for cytokine release.
(A) Plasma levels of IL-1β from WT, ApoE -/- and ApoE/NE/PR3/ -/- on HFD for 8 weeks, measured by ELISA in n=17 mice per strain pooled from three independent experiments. (B) Representative confocal immunofluorescence microscopy images of aortic root sections from 8 ApoE -/- and 5 ApoE/NE/PR3 -/- mice in 2 independent experiments placed on HFD for 8 weeks and stained with the macrophage marker Mac-3 (cyan), IL-1β (magenta), the neutrophil marker Ly6G (yellow) and DNA (DAPI, blue). Dotted line denotes the adventitia (A) / lesion boundary and (L) the lumen. Scale bars: 50 μm (C) Representative IL-1β mRNA levels in aorta of 5 ApoE -/- and 4 ApoE/NE/PR3/ -/- mice repeated in 2 independent experiments where fed on HFD for 8 weeks measured by qPCR. mRNA levels were normalized to the monocyte/macrophage specific gene lamp2 and expressed relative to levels measured in WT mice. A power analysis measured 89% power for the difference of means between ApoE -/- and ApoE/PR3/NE -/- mice. (D) Representative confocal immunofluorescence microscopy images of aortic root sections from 5 ApoE -/- mice placed on HFD for 8 weeks and stained with the macrophage marker Mac-3 (cyan), MPO (magenta), citrullinated histone 3 (Cit-H3, yellow) and DNA (DAPI, blue). Scale bars: 50 μm. Right panel is a close-up of the highlighted area of the left panel and arrows point to macrophages. Scale bars: 20 μm. (E) Mature IL-1β (black bars, left y axis) or IL-6 (grey bars, right y-axis) protein released by CD-14 blood-derived human monocytes untreated or treated with LPS or NETs alone or in the presence of cholesterol crystals. Where indicated, cells were treated with 10µg/ml oligonucleotide inhibitor (ODN).(F) Whole cell lysates or cell culture medium from naïve CD-14 blood-derived human monocytes or treated with NETs alone (black bars) or in the presence of cholesterol crystals (grey bars) analyzed by SDS-PAGE electrophoresis and immunoblotted for IL-1β, caspase-1 and actin. (G) IL-1β (left panel) or IL-6 (right panel) mRNA in naïve CD-14 blood-derived human monocytes or treated with NETs alone (black bars) or in the presence of cholesterol crystals (grey bars). (E-G) Representative data of 3 independent experiments with standard error across 3 technical replicates. Statistics by Student’s t-test for single comparison and two-way ANOVA, followed by Sidak’s multiple comparison post test for multiple comparisons: * p<0.05, ** p<0.01, *** p<0.001, **** p<0.0001.
Figure 4.
Figure 4.. NETs drive IL-17 and neutrophil chemokine production in atherosclerosis.
(A) Representative FACS plot of IL-17 intracellular staining in αβ and γδ T cells from PMA-restimulated digested aortas of ApoE -/- or ApoE/PR3/NE -/- mice on HFD for 8 weeks. (B) Representative number of cells relative to CD45+ populations and whole aortas from (A) for 3 animals per group repeated in two independent experiments. (C) IL-17A, CXCL1, CXCL2 and CCL2 concentrations from whole aorta samples measured by ELISA. N=5 ApoE -/- and n=4 ApoE/PR/NE -/- mice. (D) Number of total intact Ly6G-stained neutrophils per aortic root section field of view (FOV) measured in immunostained micrographs. 8 mice per strain in 2 independent experiments. Statistics by two-tailed, unpaired Student’s t-test: * p<0.05, ** p<0.01, *** p<0.001, **** p<0.0001.

Comment in

References

    1. Lamkanfi M, Dixit VM. Mechanisms and functions of inflammasomes. Cell. 2014;157:1013–1022. doi: 10.1016/j.cell.2014.04.007. published online EpubMay 22. - DOI - PubMed
    1. Schroder K, Tschopp J. The inflammasomes. Cell. 2010;140:821–832. doi: 10.1016/j.cell.2010.01.040. published online EpubMar 19. - DOI - PubMed
    1. Latz E, Xiao TS, Stutz A. Activation and regulation of the inflammasomes. Nature reviews. Immunology. 2013;13:397–411. doi: 10.1038/nri3452. published online EpubJun. - DOI - PMC - PubMed
    1. Lessner SM, Prado HL, Waller EK, Galis ZS. Atherosclerotic lesions grow through recruitment and proliferation of circulating monocytes in a murine model. Am J Pathol. 2002;160:2145–2155. doi: 10.1016/S0002-9440(10)61163-7. published online EpubJun. - DOI - PMC - PubMed
    1. Swirski FK, Pittet MJ, Kircher MF, Aikawa E, Jaffer FA, Libby P, Weissleder R. Monocyte accumulation in mouse atherogenesis is progressive and proportional to extent of disease. Proc Natl Acad Sci U S A. 2006;103:10340–10345. doi: 10.1073/pnas.0604260103. published online EpubJul 5. - DOI - PMC - PubMed

Publication types

MeSH terms