. 2015:2015:747645.
doi: 10.1155/2015/747645. Epub 2015 Jun 22.

IFI16 Expression Is Related to Selected Transcription Factors during B-Cell Differentiation

Affiliations

IFI16 Expression Is Related to Selected Transcription Factors during B-Cell Differentiation

Pier Paolo Piccaluga et al. J Immunol Res. 2015.

Abstract

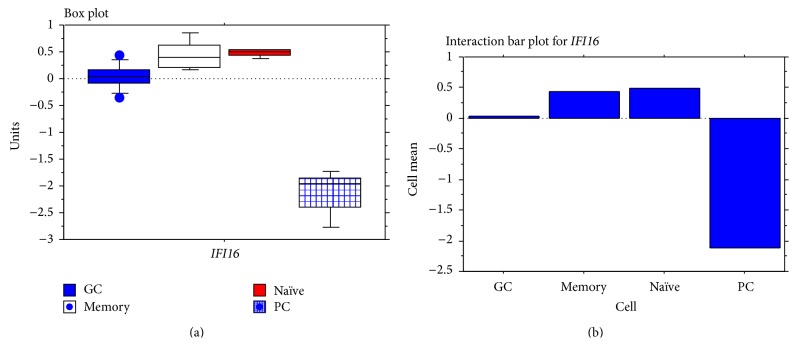
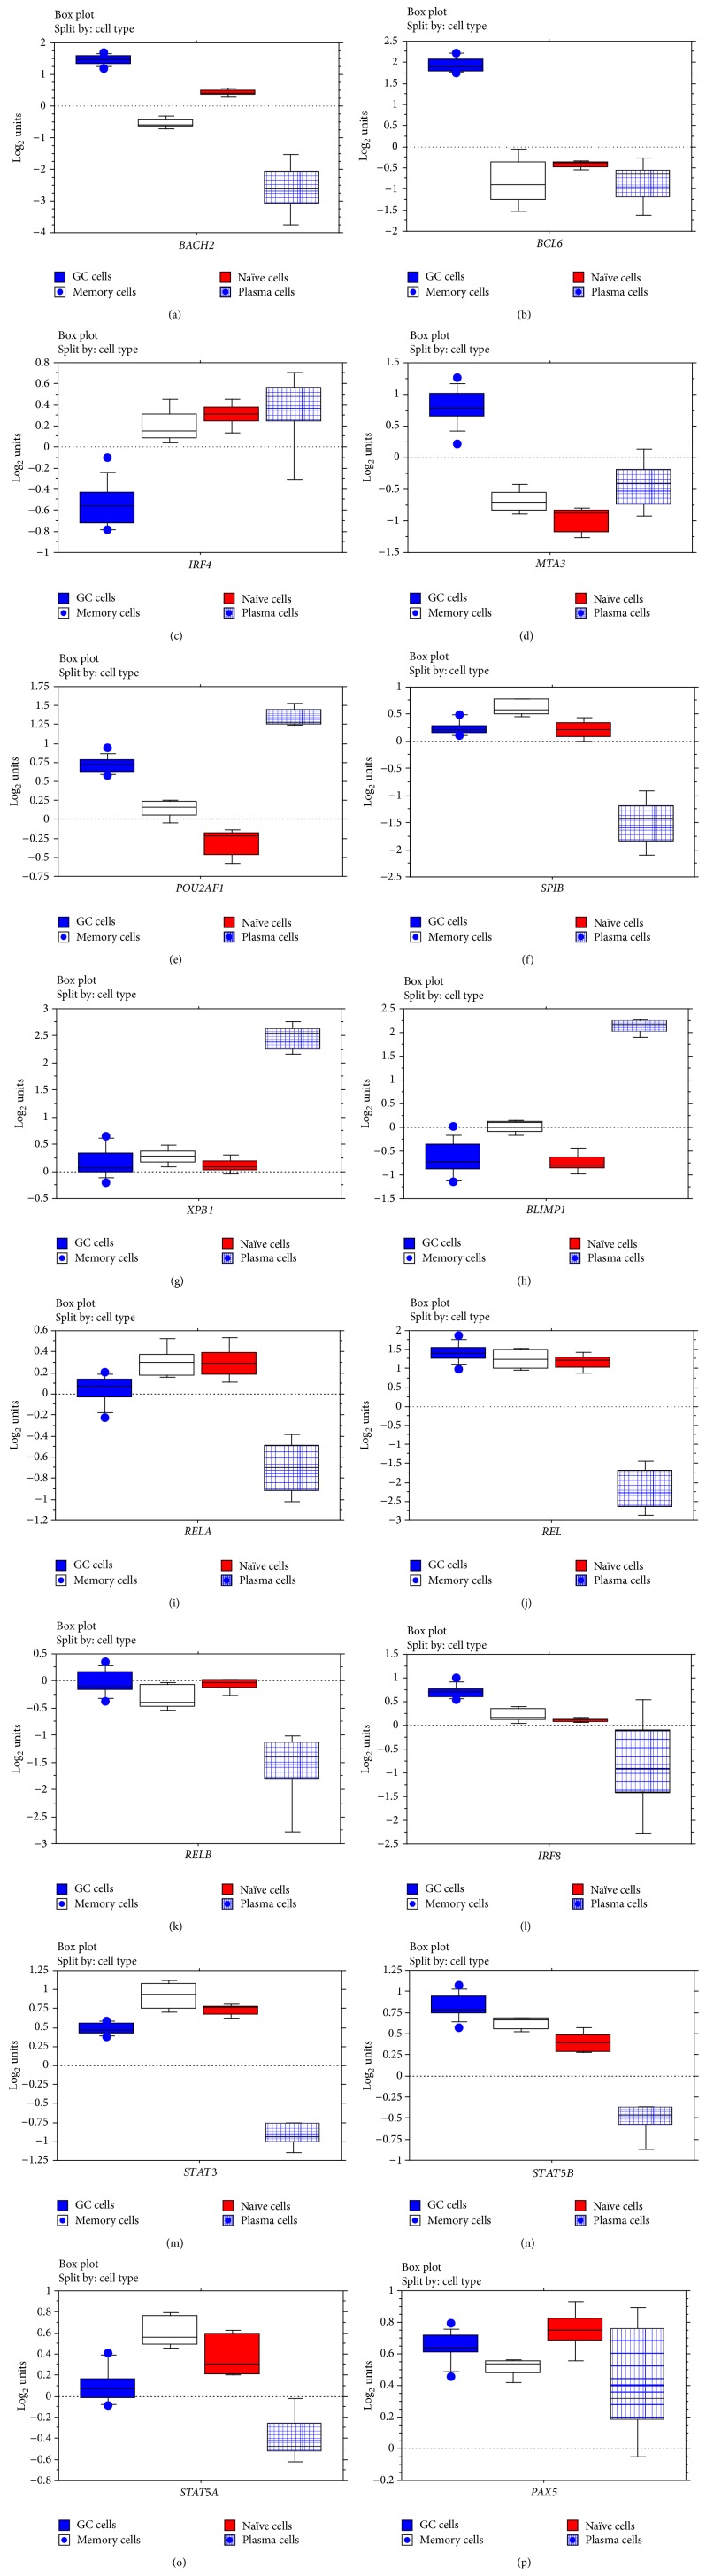
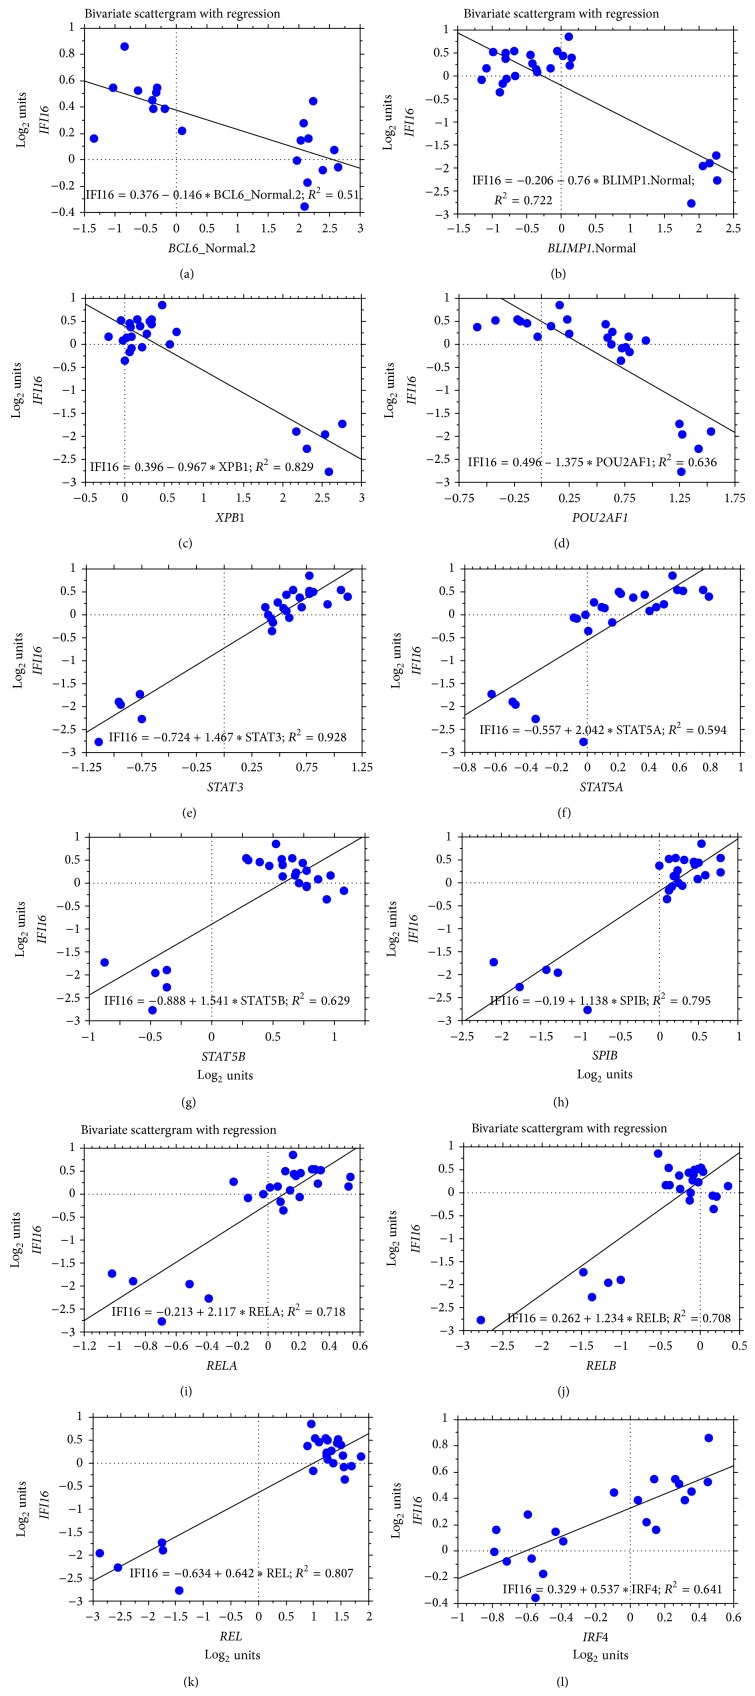
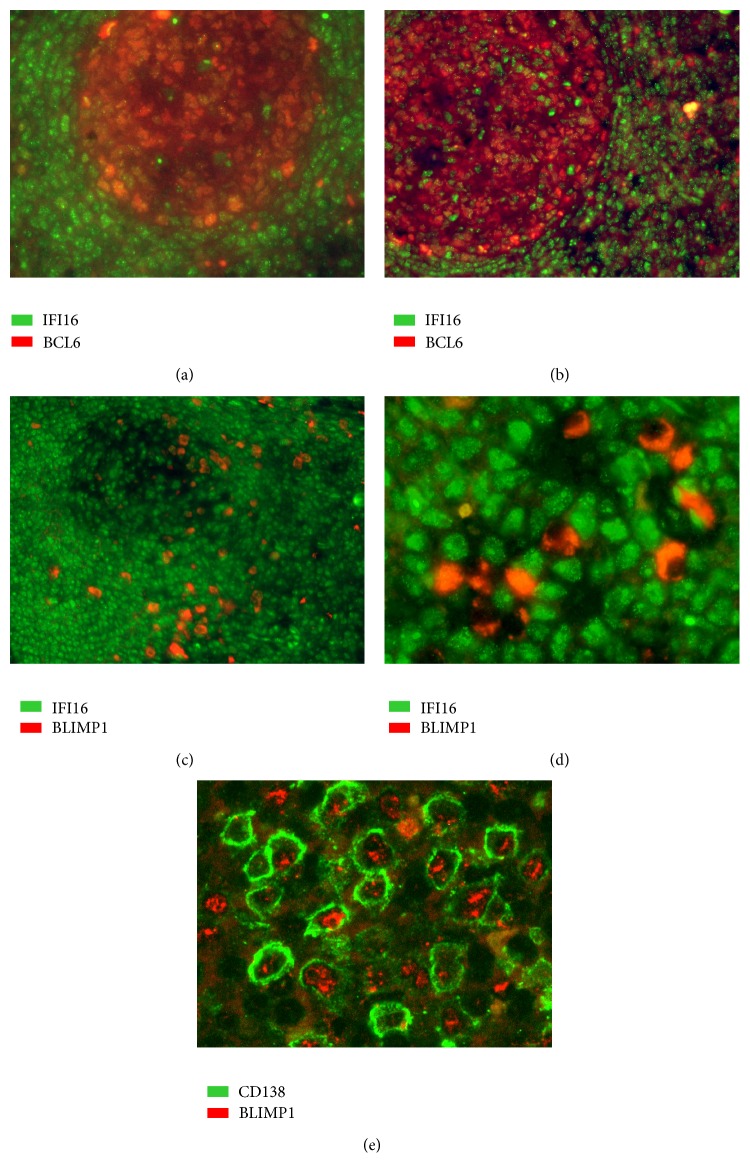
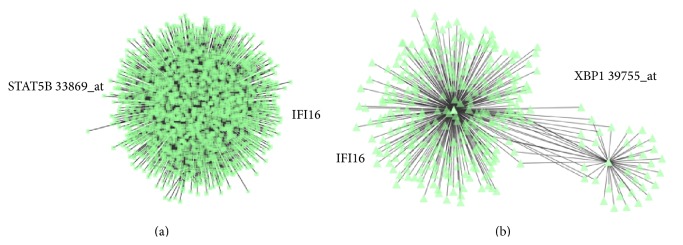
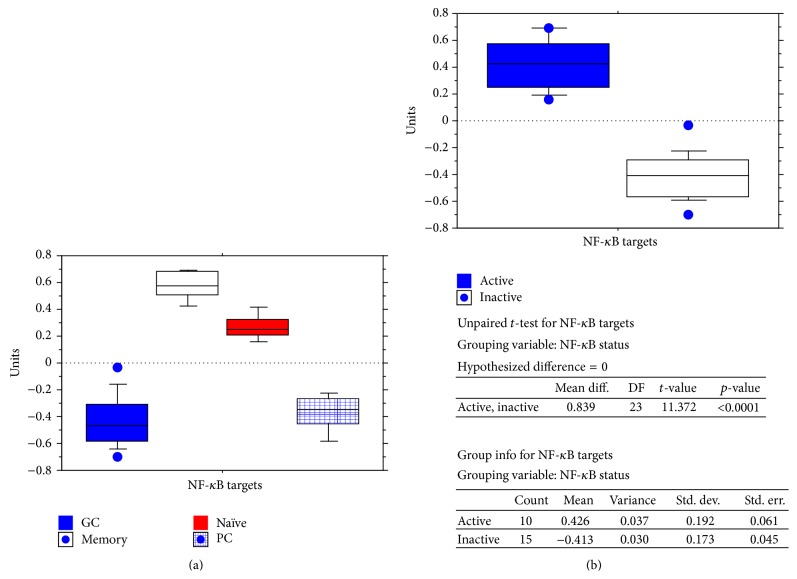
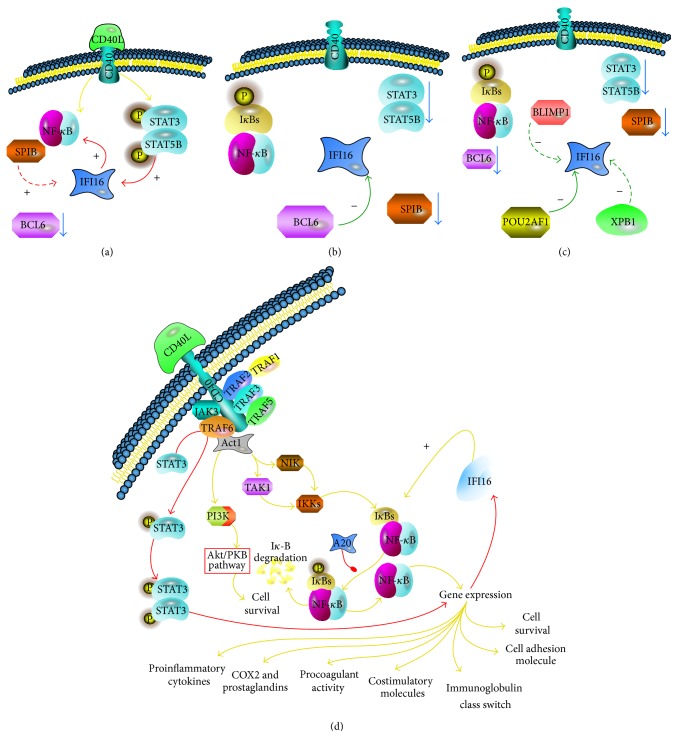
The interferon-inducible DNA sensor IFI16 is involved in the modulation of cellular survival, proliferation, and differentiation. In the hematopoietic system, IFI16 is consistently expressed in the CD34+ stem cells and in peripheral blood lymphocytes; however, little is known regarding its regulation during maturation of B- and T-cells. We explored the role of IFI16 in normal B-cell subsets by analysing its expression and relationship with the major transcription factors involved in germinal center (GC) development and plasma-cell (PC) maturation. IFI16 mRNA was differentially expressed in B-cell subsets with significant decrease in IFI16 mRNA in GC and PCs with respect to naïve and memory subsets. IFI16 mRNA expression is inversely correlated with a few master regulators of B-cell differentiation such as BCL6, XBP1, POU2AF1, and BLIMP1. In contrast, IFI16 expression positively correlated with STAT3, REL, SPIB, RELA, RELB, IRF4, STAT5B, and STAT5A. ARACNE algorithm indicated a direct regulation of IFI16 by BCL6, STAT5B, and RELB, whereas the relationship between IFI16 and the other factors is modulated by intermediate factors. In addition, analysis of the CD40 signaling pathway showed that IFI16 gene expression directly correlated with NF-κB activation, indicating that IFI16 could be considered an upstream modulator of NF-κB in human B-cells.


Figures

Figure 1
Figure 1
IFI16 mRNA expression in normal B-cell subsets. IFI16 mRNA expression evaluated by GEP and presented in box plot (a) and interaction bar plot (b). Naïve and memory B-cells showed a significantly higher IFI16 mRNA level with respect to GC B-cells (naïve versus GC p = 0.0062; memory versus GC p = 0.0131; Mann-Whitney test) and PCs (naïve versus plasma cells p < 0.0001; memory versus PCs p < 0.0001; Mann-Whitney test) but no differences were noted between naïve and memory B-cell subsets (p = 0.78; Mann-Whitney test). GC cells showed a significant increase with respect to plasma cells (p < 0.0001; Mann-Whitney test).
Figure 2
Figure 2
IFI16 protein expression in normal lymphoid tissues. (a) IFI16 staining of GC and mantle zones. (b) Double staining with CD20 and IFI16 antibodies. IFI16 protein expression in reactive lymphoid follicles; the expression pattern was largely restricted to B-lymphocytes of the mantle zone (M) and germinal centers (GC). (c) Particular of panel (b). Higher fluorescence in B-cells of the mantle zone (M) indicates a higher expression in this compartment compared with GC cells. These micrographs were obtained using an Olympus BX61 microscope equipped with an Olympus DP70 digital camera (magnification 100–400x); image acquisition, evaluation, and color balance were performed with CellF software.
Figure 3
Figure 3
IFI16 protein and mRNA expression analysis in naïve and memory B-cells purified from peripheral blood. In (a), IFI16 mRNA levels were determined using qRT-PCR. The IFI16 mRNA expression relative quantification was calculated with the ΔΔCt method [34, 35]. The results are shown for the naïve B-cell subset relative to the memory B subset. The data represent the mean (±SD) of three independent experiments performed in duplicate. In (b), flow cytometry analysis of intracellular IFI16 protein was performed in naïve and memory B-cell subsets purified from peripheral blood. Naïve (light grey histogram) and memory (grey histogram) B-cells were stained by indirect immunofluorescence with a rabbit anti-IFI16 antibody (1 : 40 in 0.2% saponin/PBS) and, subsequently, with a FITC-conjugated sheep anti-rabbit IgG (1 : 100 in 0.2% saponin/PBS). The white histograms are the negative controls (dotted line, memory cells, solid line, and naïve cells) represented by naïve and memory B-cells stained with indirect immunofluorescence with a rabbit anti-HIV-1 p24 antibody (1 : 40 in 0.2% saponin/PBS) and, subsequently, with a FITC-conjugated sheep anti-rabbit IgG (1 : 100 in 0.2% saponin/PBS). A representative experiment is shown. In (c), western blot analysis of protein extract from peripheral blood memory and naïve B-cell subsets (n = 3). Cell lysates were separated by gel electrophoresis and transferred to nitrocellulose membrane. The proteins were probed with rabbit anti-IFI16 polyclonal antibody and then incubated with an AP-conjugated anti-rabbit IgG and detected by colorimetric procedure. Tubulin protein was assayed as control. IFI16 A, B, and C isoform proteins were expressed similarly in memory and naïve B-cell subsets. A representative experiment is shown.
Figure 4
Figure 4
Gene expression levels of B-cell development associated transcription factors in normal B-lymphocytes. Normalized mRNA expression evaluated by GEP is presented in box plots.
Figure 5
Figure 5
The correlation between IFI16 and selected transcription factors was determined by GEP in normal B-cell subsets. The data are shown in a bivariate scattergram with a regression line. IFI16 is plotted on the y-axes, while BCL6, BLIMP1, XBP1, POU2AF1, STAT3, STAT5A, STAT5B, SPIB, RELA, RELB, REL, and IRF4 are plotted on the x-axes in panels (a) to (l), respectively. Note that plasma cells were eventually excluded from the analyses between IFI16-BCL6 and IFI16-IRF4. In fact, based on our analysis, IFI16 expression was suppressed by other molecules in plasma cells, making them not suitable for an appropriate evaluation of the relationship between IFI16 and BCL6 or between IFI16 and IRF4.
Figure 6
Figure 6
Double-staining immunofluorescence analysis of IFI16/BCL-6 and IFI16/BLIMP1 protein expression levels. Double-staining immunofluorescence analysis demonstrated the inverse relationship between IFI16 (green) and either BCL6 (red; (a-b) magnification 200x and 100x, resp.), or BLIMP1 (red; (c-d), magnification 100x and 400x, resp.). The latter, in particular, showed a mutually exclusive expression patterns with IFI16. Specifically, plasma cells in panel (d) were BLIMP1+/IFI16−, while the surrounding lymphocytes were BLIMP1−/IFI16+. In (e) (magnification 400x) double-staining immunofluorescence analysis showed the coexpression of BLIMP1 (red) and plasma cell marker CD138 (green). These micrographs were obtained using an Olympus BX61 microscope equipped with an Olympus DP-70 digital camera; image acquisition, evaluation, and color balance were performed using CellF software.
Figure 7
Figure 7
Relationship between IFI16 and select transcription factors as defined by ARACNe. Examples of direct interaction ((a) STAT5b-IFI16) and indirect interaction ((b) XBP1-IFI16) are plotted. In each panel, the green triangles represent molecules interacting with IFI16 (chosen as the centroid of the analysis).
Figure 8
Figure 8
Correlation between IFI16 and NF-κB target gene expression in normal B-cell subsets. Expression of NF-κB target genes was studied in the different B-cell populations (a). A mean of the normalized expression values of the considered target genes was calculated and defined as the NF-κB signature. Cases with NF-κB signature values below 0 were considered to have an inactive pathway; cases with values above 0 were considered as having an active pathway. IFI16 mRNA expression levels were then analyzed in the two groups (b). Significantly higher IFI16 mRNA levels were detected in normal samples with an active NF-κB signature (p < 0.0001). Specifically, germinal center cells and plasma cells (low NF-κB signature) were compared to naïve and memory cells (high NF-κB signature).
Figure 9
Figure 9
Hypothetical regulation of IFI16 during mature B-cell differentiation based on the present study. Interactions in naïve and memory (a), germinal center (b), and plasma cells (c) are described. In panel (d), details regarding the effects of CD40 signaling on IFI16 are depicted. Solid arrows indicate possible direct effects while dashed arrows indicate possible indirect effects.

Similar articles

Cited by

References

    1. Akashi K., Kondo M., Cheshier S., et al. Lymphoid development from stem cells and the common lymphocyte progenitors. Cold Spring Harbor Symposia on Quantitative Biology. 1999;64:1–12. doi: 10.1101/sqb.1999.64.1. - DOI - PubMed
    1. Berek C., Berger A., Apel M. Maturation of the immune response in germinal centers. Cell. 1991;67(6):1121–1129. doi: 10.1016/0092-8674(91)90289-B. - DOI - PubMed
    1. MacLennan I. C. M. Germinal centers. Annual Review of Immunology. 1994;12:117–139. doi: 10.1146/annurev.iy.12.040194.001001. - DOI - PubMed
    1. Klein U., Dalla-Favera R. Germinal centres: role in B-cell physiology and malignancy. Nature Reviews Immunology. 2008;8(1):22–33. doi: 10.1038/nri2217. - DOI - PubMed
    1. Dent A. L., Shaffer A. L., Yu X., Allman D., Staudt L. M. Control of inflammation, cytokine expression, and germinal center formation by BCL-6. Science. 1997;276(5312):589–592. doi: 10.1126/science.276.5312.589. - DOI - PubMed

Publication types

MeSH terms