. 2015 Jul 17;10(7):e0132977.
doi: 10.1371/journal.pone.0132977. eCollection 2015.

Different Effects of BORIS/CTCFL on Stemness Gene Expression, Sphere Formation and Cell Survival in Epithelial Cancer Stem Cells

Affiliations

Different Effects of BORIS/CTCFL on Stemness Gene Expression, Sphere Formation and Cell Survival in Epithelial Cancer Stem Cells

Loredana Alberti et al. PLoS One. .

Abstract

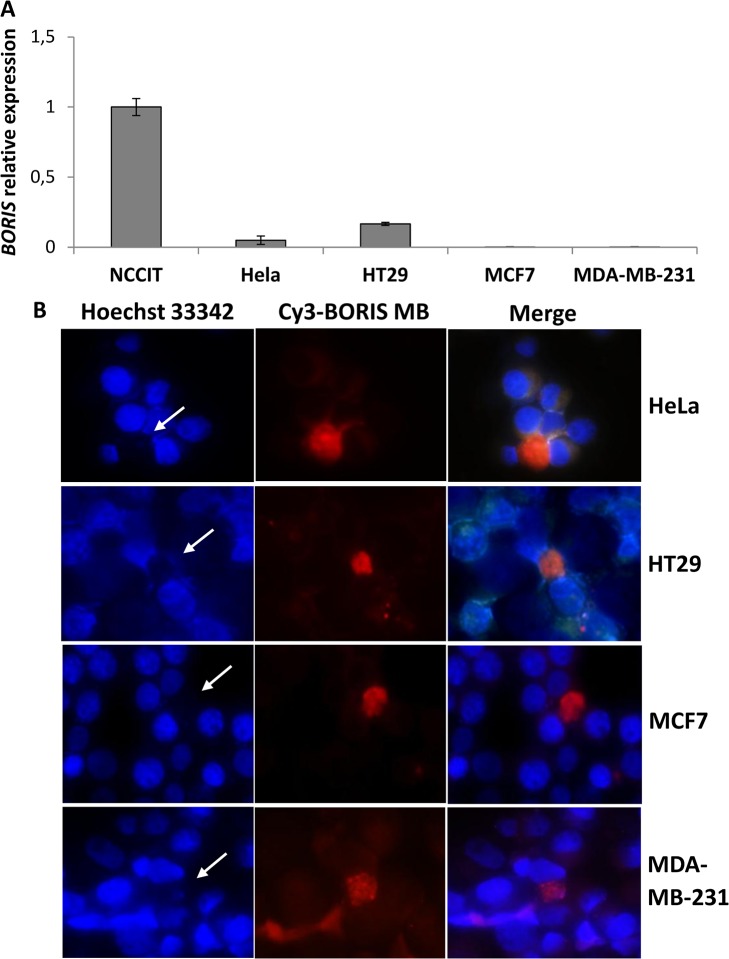
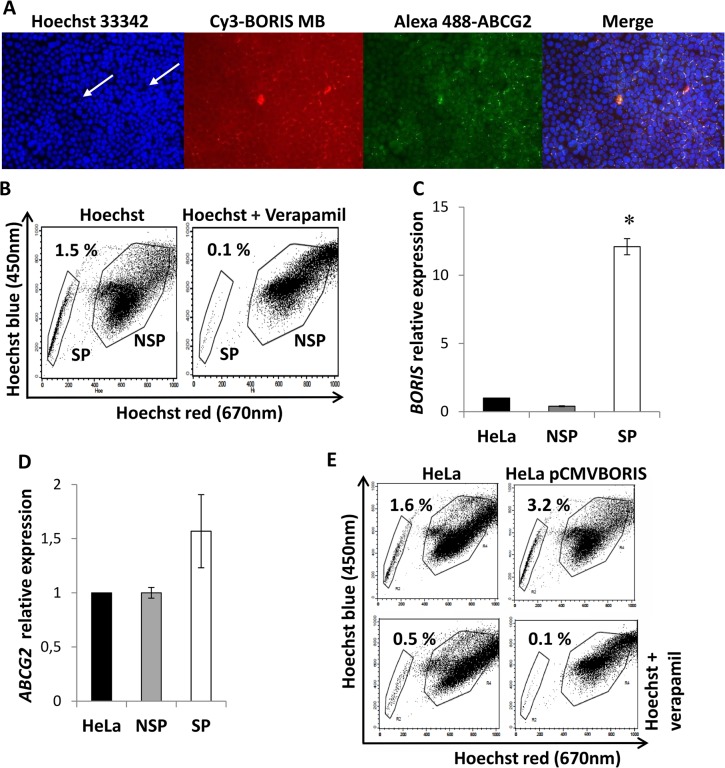
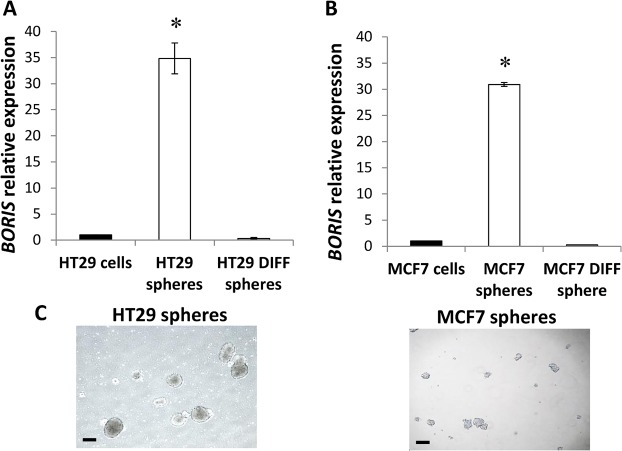
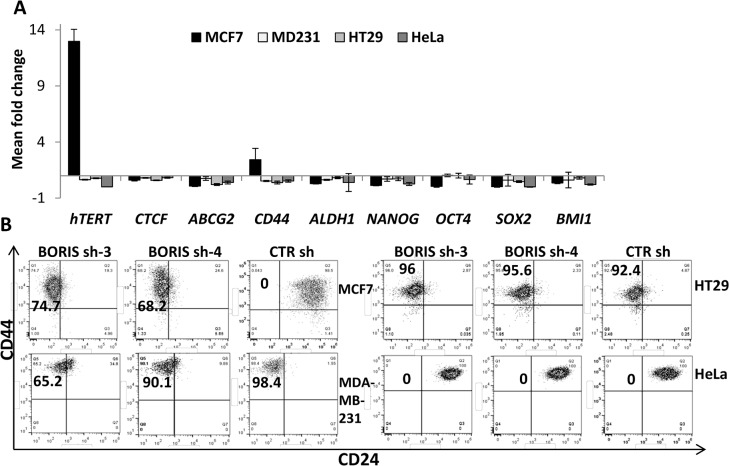
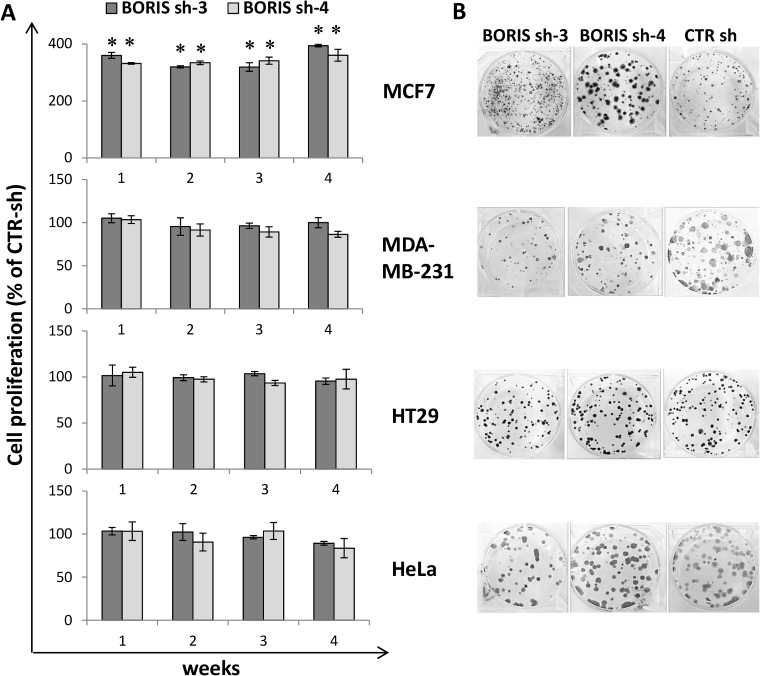
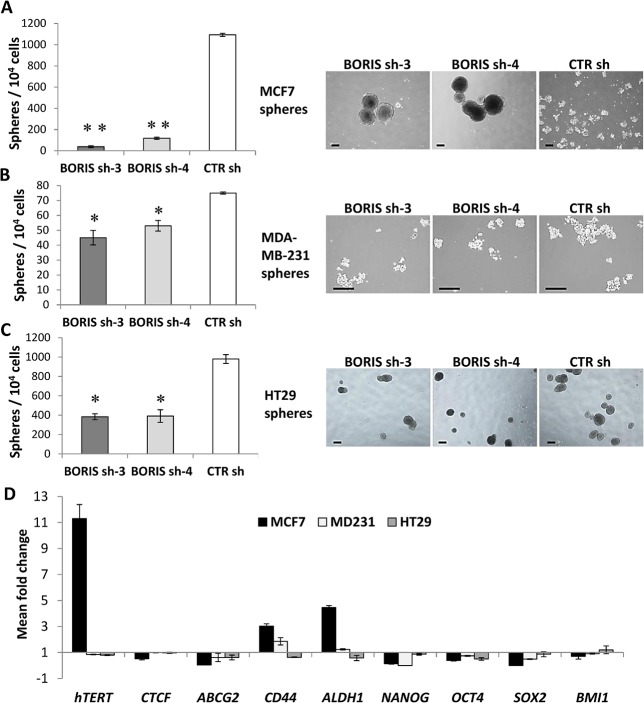
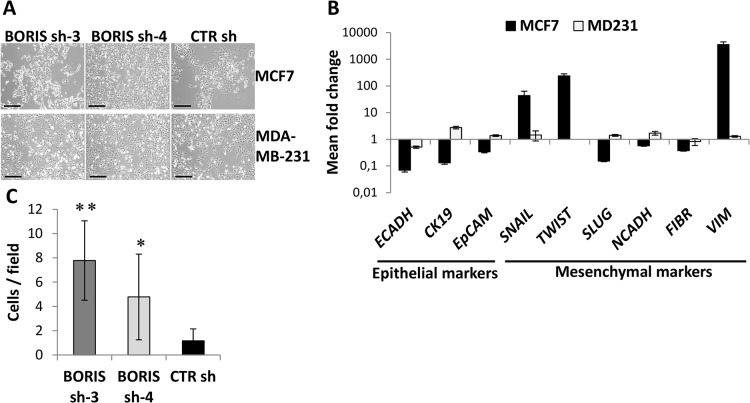
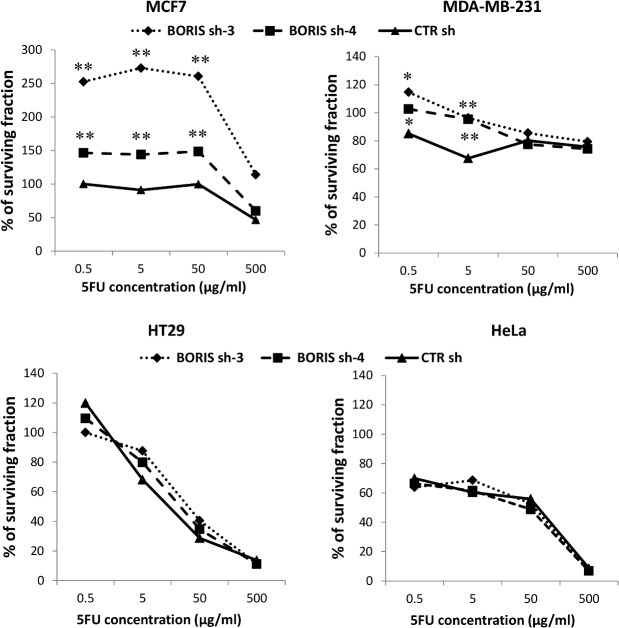
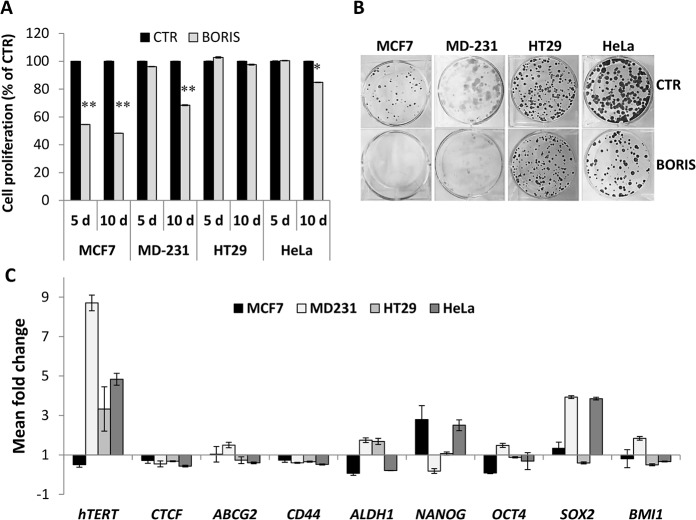
Cancer stem cells are cancer cells characterized by stem cell properties and represent a small population of tumor cells that drives tumor development, progression, metastasis and drug resistance. To date, the molecular mechanisms that generate and regulate cancer stem cells are not well defined. BORIS (Brother of Regulator of Imprinted Sites) or CTCFL (CTCF-like) is a DNA-binding protein that is expressed in normal tissues only in germ cells and is re-activated in tumors. Recent evidences have highlighted the correlation of BORIS/CTCFL expression with poor overall survival of different cancer patients. We have previously shown an association of BORIS-expressing cells with stemness gene expression in embryonic cancer cells. Here, we studied the role of BORIS in epithelial tumor cells. Using BORIS-molecular beacon that was already validated, we were able to show the presence of BORIS mRNA in cancer stem cell-enriched populations (side population and spheres) of cervical, colon and breast tumor cells. BORIS silencing studies showed a decrease of sphere formation capacity in breast and colon tumor cells. Importantly, BORIS-silencing led to down-regulation of hTERT, stem cell (NANOG, OCT4, SOX2 and BMI1) and cancer stem cell markers (ABCG2, CD44 and ALDH1) genes. Conversely, BORIS-induction led to up-regulation of the same genes. These phenotypes were observed in cervical, colon and invasive breast tumor cells. However, a completely different behavior was observed in the non-invasive breast tumor cells (MCF7). Indeed, these cells acquired an epithelial mesenchymal transition phenotype after BORIS silencing. Our results demonstrate that BORIS is associated with cancer stem cell-enriched populations of several epithelial tumor cells and the different phenotypes depend on the origin of tumor cells.


Conflict of interest statement

Competing Interests: One of the authors (JB) is employed by a molecular pathology laboratory (Biopath Lab). This does not alter the authors’ adherence to PLOS ONE policies on sharing data and materials.

Figures

Fig 1
Fig 1. BORIS expression and SP analysis in human epithelial tumor cell lines.
(A) BORIS expression in human tumor cell lines. Total RNA from NCCIT (embryonic), HeLa (cervical), HT29 (colon), MCF7 (non-invasive breast) and MDA-MB-231 (invasive breast) tumor cells were extracted and BORIS expression was analyzed by qRT-PCR. The results were normalized to GAPDH and related to NCCIT cells. Error bars represent the mean ± SD (n = 3). (B) BORIS expression as detected using BORIS-MB. Representative images of HeLa, HT29, MCF7 and MB-MDA 231 cells, 40X magnification. Cells were incubated with Cy3-BORIS MB (200 nM) and Hoechst 33342 (5 μg/mL) at 37°C for 1.5 hour in serum-free medium and then examined under fluorescent microscopy. White arrows indicate Hoechst negative cells which are also BORIS mRNA positive as detected by BORIS-MB.
Fig 2
Fig 2. BORIS and ABCG2 expression in isolated SP HeLa cells.
(A) Immunofluorescence analysis of ABCG2 in HeLa cells. The cells were incubated with BORIS-MB and Hoechst 33342 at 37°C for 1.5 h in serum-free medium. After cytocentrifugation the slides were fixed with cold acetone and then incubated with rabbit polyclonal ABCG2 antibody. The BORIS positive/ABCG2 positive/Hoechst negative cells are indicated with white arrows. 10X magnification. (B) Representative dot plot of flow cytometry analysis of SP. HeLa cells were incubated with Hoechst 33342 (12.5 μg/mL) either alone or in combination with verapamil (50 μM). The analysis was performed using LSRII and the sorting using FACS Aria. The gates indicate the sorted SP and NSP cells. (C) BORIS mRNA and (D) ABCG2 mRNA expression in SP and NSP isolated from HeLa cells. Total RNA was extracted and analyzed by qRT-PCR. Graphs indicate the mRNA levels of BORIS and ABCG2 genes normalized to GAPDH and related to the parental HeLa cells. Data are represented as mean ± SD from 3 independent experiments. Asterisk indicates p<0.05. (E) SP analysis in BORIS overexpressed cells. HeLa cells were transiently transfected with a BORIS expression vector (HeLa pCMVBORIS). After 2 days, 1 x 10⁶ cells were incubated with Hoechst 33342 (12.5 μg/mL) either alone (top) or in combination (bottom) with 50 μM verapamil. The analysis was performed using LSRII flow cytometry and one representative experiment of 3 independent experiments is shown.
Fig 3
Fig 3. BORIS expression in colon-spheres and mammo-spheres.
Cells were seeded at low density (1,000 cells/ml) in sphere culture medium in low attachment plates. After 10–15 days spheres were collected for RNA extraction and an aliquot of spheres was seeded in normal medium with serum to allow the differentiation (differentiated-spheres). BORIS expression was analyzed by qRT PCR in (A) colon-spheres (HT29 spheres) and differentiated-spheres (HT29 DIFF spheres) and in (B) mammo-spheres (MCF7 spheres) and differentiated-spheres (MCF7 DIFF spheres). Data were normalized to GAPDH and related to parental cells (cells). One representative experiment of 4 independent experiments is shown. Asterisks indicate statistically significant difference (p<0.05) between spheres and parental cells. (C) Representative images of colon-spheres and mammo-spheres are shown, 4X magnification. Black scale bars indicate 250 μm.
Fig 4
Fig 4. Impact of BORIS-knockdown on gene expression and CSC profile.
(A) MCF7, MDA-MB-231, HT29 and HeLa cells were engineered to stably exhibit knocked-down BORIS mRNA. BORIS sh-3, sh-4 and CTR sh (control shRNA containing scrambled sequence) lentiviruses were used to infect these cells. Each transduced cells were cultured with doxycycline to induce BORIS shRNA expression. Medium containing doxycycline was replaced every 3 days. After 2 weeks, RNA was isolated from BORIS sh-3, sh-4 and CTR sh of each transduced cell line. mRNA levels of the indicated genes were analyzed by qRT-PCR. Graphs represent for each gene the means of fold induction of both BORIS shRNA (BORIS sh-3 and sh-4) related to that of control of any cells. Standard errors were calculated considering error propagation of both BORIS shRNA analyses. Graphs show one representative experiment. (B) Representative flow cytometry dot plots of CD44 and CD24 expression in MCF7, MDA-MB-231, HT29 and HeLa cells engineered to stably exhibit knocked-down BORIS mRNA. CD44 and CD24 expression patterns of the two BORIS shRNA (BORIS sh-3 and sh-4) and the control (CTR sh) are shown. Anti-CD24 antibody labeled with AlexaFluor 647 and anti-CD44 antibody labeled with APC-H7 were used. The percentage of CD44+/CD24- population was estimated after gating on eGFP and tRFP positive cells (transduced and dox-induced shRNA, respectively) and the final gates are based on the isotype control corresponding to each cell line. All experiments were conducted independently three times and one representative experiment is shown for each group of cells.
Fig 5
Fig 5. Impact of BORIS knockdown on cell survival in epithelial tumor cells.
(A) Cell proliferation, over 1 month of dox-induced BORIS- and CTR- shRNA cells, was analyzed each week by MTT assay. Results of the two specific BORIS-shRNA (BORIS sh-3 and sh-4) are indicated as a percentage compared to the cell proliferation of control cells (scrambled shRNA, CTR sh). Error bars represent the mean ± SD (n = 3). Asterisks indicate statistically significant difference (p<0.05) between BORIS sh and CTR sh. (B) Representative images of colony formation assay after 1 month of BORIS knockdown. Three hundred cells were seeded in each well of 6-well plates with medium containing doxycycline, each cell group were prepared in triplicate. Cells were cultured for 2 weeks, then were fixed and stained with crystal violet.
Fig 6
Fig 6. Knockdown of BORIS reduces the ability to form spheres and down-regulates the expression of stem cell genes.
(A) MCF7, (B) MDA-MB-231 and (C) HT29 cells were engineered to stably exhibit knocked-down BORIS mRNA. After 2 weeks of dox-induction of BORIS- and CTR- shRNA cells were seeded at low density (1000 cells/ml) in sphere serum-free medium into ultra-low attachment 6-well plates in triplicates. Doxycycline was added every 3 days to maintain shRNA induction. Formed spheres were counted after 10 days. Error bars represent the mean ± SD (n = 3). One asterisk (p<0.05) or two asterisks (p<0.001) indicate statistically significant difference between BORIS sh and CTR sh spheres. On the right are shown representative images of spheres. MCF7-spheres and HT29-spheres, 4X magnification. MDA-MB-231-spheres, 10X magnification. Black scale bars indicate 250 μm. (D) Expression analysis of BORIS-depleted spheres. Total RNA was isolated from BORIS sh-3, sh-4 and CTR sh formed spheres. mRNA levels of the indicated genes were analyzed by qRT-PCR. Graphs represent for each gene the means of fold induction of both BORIS shRNA (BORIS sh-3 and sh-4) related to that of control. Standard errors were calculated considering error propagation of both BORIS shRNA analyses. Graphs show one representative experiment.
Fig 7
Fig 7. Acquisition of EMT phenotype and gene signature of MCF7 cells after BORIS silencing.
(A) Representative images of MCF7- and MDA-MB-231- derived cells after dox-induction of BORIS- and CTR- shRNA, 10X magnification. Black scale bars indicate 250 μm. (B) After 2 weeks of BORIS knockdown, mRNA levels of the indicated genes were analyzed by qRT-PCR. Graphs represent for each gene the means of fold induction of both BORIS shRNA (BORIS sh-3 and sh-4) related to the control. Standard errors were calculated considering error propagation of both BORIS shRNA. Graphs show one representative experiment. Results are shown in logarithmic scale. (C) Cell migration assay of MCF7 cells after BORIS knockdown. Graph shows the mean of cell number visualized in 10 different fields ± SD (n = 3). One asterisk (p<0.05) or two asterisks (p<0.001) indicate statistically significant difference between BORIS sh and CTR sh. On the right, representative images, 10X magnification.
Fig 8
Fig 8. Effect of 5-FU on cell proliferation of BORIS-depleted tumor cell lines.
After 2 weeks of BORIS knockdown cells were seeded (1 x 10⁴ cells/well) in 96-well plates in doxycycline-containing medium. The day after was added 5-FU at different concentrations: 0.5, 5, 50 and 500 μg/ml. Cells were incubated for 2 days and then cell viability was measured by MTT assay. The percentage of viable cells (% of surviving fraction) is shown relative to that of the untreated control. Error bars represent the mean ± SD (n = 3). One asterisk (p<0.05) or two asterisks (p<0.01) indicate statistically significant difference between BORIS sh and CTR sh cells.
Fig 9
Fig 9. Inhibition of cell growth and up-regulation of hTERT and stem cell genes expression, after BORIS-induction in epithelial cancer cells.
MCF7, MDA-MB-231, HT29 and HeLa cells were engineered to stably express BORIS cDNA. After transduction with either lentivirus harboring BORIS cDNA (BORIS) or control lentivirus (CTR), cells were selected by incubation with the antibiotic G418 for at least 2 weeks. (A) Cell proliferation was analyzed by MTT assay after 5 and 10 days of dox-induction of BORIS expression. Results are indicated as a percentage compared to the control cells (CTR). Error bars represent the mean ± SD (n = 3). One asterisk (p<0.05) or two asterisks (p<0.01) indicate statistically significant difference between BORIS and CTR cells. (B) Representative images of colony formation assay. Three hundred cells were seeded in each well of 6-well plates with medium containing doxycycline, each assay was performed in triplicate. Cells were cultured for 2 weeks, then were fixed and stained with crystal violet. (C) After 2 weeks of dox-induction of BORIS and CTR cells, mRNA levels of the indicated genes were analyzed by qRT-PCR. Graph represents for each gene the fold induction of BORIS-induced cells related to control cells. Error bars represent the mean ± SD (n = 3).

References

    1. Reya T, Morrison SJ, Clarke MF, Weissman IL. Stem cells, cancer, and cancer stem cells. Nature. 2001. November 1;414(6859):105–11. - PubMed
    1. Dalerba P, Cho RW, Clarke MF. Cancer stem cells: models and concepts. Annual review of medicine. 2007;58:267–84. - PubMed
    1. Jordan CT, Guzman ML, Noble M. Cancer stem cells. The New England journal of medicine. 2006. September 21;355(12):1253–61. - PubMed
    1. Schatton T, Frank NY, Frank MH. Identification and targeting of cancer stem cells. BioEssays: news and reviews in molecular, cellular and developmental biology. 2009. October;31(10):1038–49. - PMC - PubMed
    1. Bonnet D, Dick JE. Human acute myeloid leukemia is organized as a hierarchy that originates from a primitive hematopoietic cell. Nature medicine. 1997. July;3(7):730–7. - PubMed

Publication types

MeSH terms

Substances