. 2015 Jul 16;162(2):441-451.
doi: 10.1016/j.cell.2015.05.056.

Elucidating Compound Mechanism of Action by Network Perturbation Analysis

Affiliations

Elucidating Compound Mechanism of Action by Network Perturbation Analysis

Jung Hoon Woo et al. Cell. .

Abstract

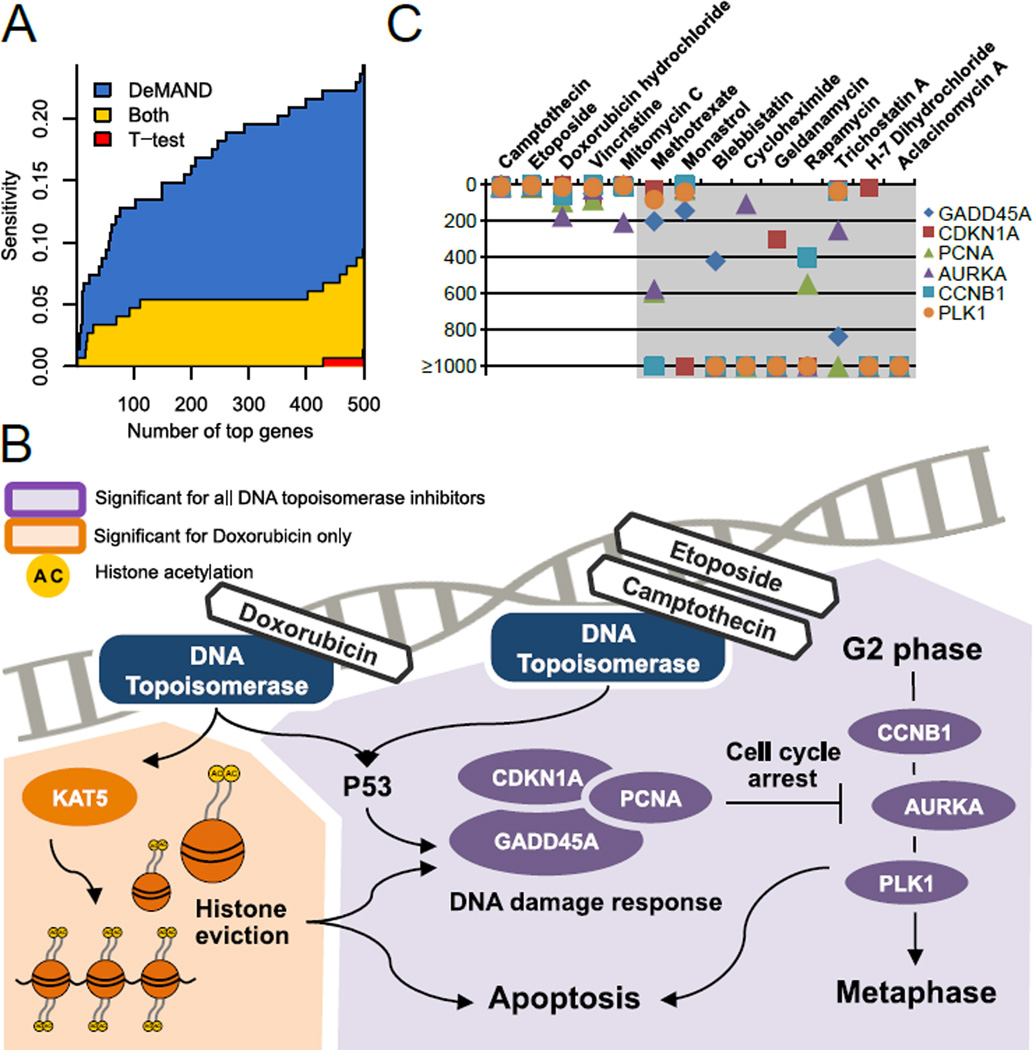
Genome-wide identification of the mechanism of action (MoA) of small-molecule compounds characterizing their targets, effectors, and activity modulators represents a highly relevant yet elusive goal, with critical implications for assessment of compound efficacy and toxicity. Current approaches are labor intensive and mostly limited to elucidating high-affinity binding target proteins. We introduce a regulatory network-based approach that elucidates genome-wide MoA proteins based on the assessment of the global dysregulation of their molecular interactions following compound perturbation. Analysis of cellular perturbation profiles identified established MoA proteins for 70% of the tested compounds and elucidated novel proteins that were experimentally validated. Finally, unknown-MoA compound analysis revealed altretamine, an anticancer drug, as an inhibitor of glutathione peroxidase 4 lipid repair activity, which was experimentally confirmed, thus revealing unexpected similarity to the activity of sulfasalazine. This suggests that regulatory network analysis can provide valuable mechanistic insight into the elucidation of small-molecule MoA and compound similarity.


Figures

Figure 1
Figure 1. Schematics of the DeMAND algorithm
(A) DeMAND requires both a regulatory network and a set of gene expression profiles from compound perturbed and control samples, as an input. (B) DeMAND evaluates the dysregulation of each interaction in the regulatory network. (C) To evaluate interaction dysregulation co-expression scatter plots for the two interacting genes are smoothed using a Gaussian Kernel method to generate an interaction probability density. The probability density difference before and after compound perturbation is evaluated using the KL-divergence. The top example illustrates no change in probability density (i.e., no dysregulation). The other three examples illustrate various examples of compound dysregulation, including correlation inversion, gain, and loss (top to bottom, respectively). (D) The statistical significance of the KL-divergence is assessed by gene pair shuffling. (E) The global dysregulation of each gene is determined by integrating the p-values of all its network interactions, while accounting for their dependencies (see also Figure S1 and Extended Experimental Procedures). (F) DeMAND produces a list of all network genes and the statistical significance of their dysregulation.
Figure 2
Figure 2. DP14 dataset analysis, see also Figure S2
(A) The average sensitivity (true-positive rate) for identifying known direct targets in all DP14 compounds, as a function of the number of top selected predictions, using either DeMAND (blue+yellow areas) or t-test analysis (red+yellow areas). DeMAND consistently outperforms t-test. For instance, DeMAND achieves ~15% sensitivity across the top 100 predictions, compared to only 3% for t-test. Furthermore, virtually all targets that are significant by t-test analysis are also significant by DeMAND analysis (no red area for up to 400 genes). In contrast, DeMAND identifies many targets that are missed by t-test (large blue area). (B) Comparative schematics of established MoA genes for camptothecin, doxorubicin, and etoposide. Doxorubicin specific DeMAND inferred MoA genes are shown with an orange background, while common inferred MoA genes for all compounds are shown with a purple background. The common genes include the core DNA-damage repair machinery (GADD45A, PCNA, and CDNK1A), and cell-cycle arrest genes (CCNB1, AURKA, PLK1). Doxorubicin’s specific MoA includes KAT5, a mediator of histone eviction. (C) Rank of DNA damage response genes across all DP14 compounds. DeMAND predicts GADD45A, the canonical DNA-damage-inducible gene and its well-known partners CDKN1A, PCNA, CCNB1, AURKA, and PLK1 among the most significant genes only for the 5 DNA damaging agents (i.e., camptothecin, doxorubicin, etoposide, mitomycin C, and vincristine).
Figure 3
Figure 3. Validation of novel effectors of vincristine and mitomycin C
(A) Immunohistochemistry-based imaging of microtubule networks in cells treated with DMSO, vincristine, non-target siRNA, and siRNA targeting RPS3A. Non-target siRNA is indistinguishable from DMSO controls. Both vincristine and siRPS3A significantly alter the microtubule network in U-2-OS cells (4nM of vincristine for 24h). (B) Vincristine dose response curves in U-2-OS following transfection with non-target siRNA (blue) or siRNA targeting CCNB1 (orange), VHL (red), NFKBIA (black), and RPS3A (green). RPS3A and CCNB1 silencing reduces cell sensitivity to vincristine, while VHL silencing increases sensitivity by two-folds. (C) Mitomycin C dose response curves in OCI-LY3 normalized to DMSO treatment (black) or following treatment with TG101348 (a JAK2 inhibitor), at 0.2uM (green), 0.4 uM (cyan), and 0.6uM (blue). JAK2 inhibition induces loss of sensitivity to mitomycin C.
Figure 4
Figure 4. Compound similarity inference, see also Figure S5
(A) Compound similarity is assessed based on the statistical significance (by FET) of the overlap of their DeMAND-inferred MoA proteins. (B) DeMAND-inferred compound similarity in the DP92 dataset is assessed by (a) the overlap of known direct targets between two compounds (orange), (b) compound sensitivity profile similarity based on CTD2 data (green), (c) overlap in compound classification, according to the Anatomical Therapeutic Chemical (ATC) Classification (blue), or (d) any of the above evidences (black).
Figure 5
Figure 5. DeMAND identifies the MoA of altretamine
(A) GSH concentration following treatment of cells by negative control (DMSO, gray), sulfasalazine as a positive control (red), and altretamine (blue) show that sulfasalazine reduces active GSH levels compared to control, while altretamine results in active GSH levels indistinguishable from the control. (B) The level of a GPX4-specific substrate (PC-OOH) is measured by mass spectrometry (a) without cell lysate (gray), (b) with untreated cell lysate (green), and (c) with cell lysate from altretamine treated cells (blue). PC-OOH levels in altretamine treated cells are similar to no-lysate, and markedly different from untreated lysate, indicating that altretamine inhibits GPX4 activity. (C) Lipid reactive oxidative species (ROS) levels were measured by flow cytometry using DMSO treated cells (black curve, as control) and compound treated cells (red curve). Both altretamine and sulfasalazine significantly increases lipid-ROS levels, confirming the predicted similarity in their functional effect. (D) Sulfasalazine is a known inhibitor of the System xc cystine/glutamate antiporter. Its downstream effect on Glutathione (GSH) and GPX4 leads to accumulation of lipid ROS. DeMAND predicted significant similarity between sulfasalazine and altretamine and GPX4 but not GSH as altretamine specific MoA proteins, as experimentally confirmed panels (A–C).

Comment in

  • Systems biology: MoA on DeMAND.
    McCarthy N. McCarthy N. Nat Rev Genet. 2015 Sep;16(9):498-9. doi: 10.1038/nrg3996. Epub 2015 Aug 4. Nat Rev Genet. 2015. PMID: 26239713 No abstract available.

References

    1. Aebersold R, Mann M. Mass spectrometry-based proteomics. Nature. 2003;422:198–207. - PubMed
    1. Bansal M, Della Gatta G, di Bernardo D. Inference of gene regulatory networks and compound mode of action from time course gene expression profiles. Bioinformatics. 2006;22:815–822. - PubMed
    1. Bansal M, Yang J, Karan C, Menden MP, Costello JC, Tang H, Xiao G, Li Y, Allen J, Zhong R, et al. A community computational challenge to predict the activity of pairs of compounds. Nat Biotechnol. 2014;32:1213–1222. - PMC - PubMed
    1. Basilico C, Pennacchietti S, Vigna E, Chiriaco C, Arena S, Bardelli A, Valdembri D, Serini G, Michieli P. Tivantinib (ARQ197) Displays Cytotoxic Activity That Is Independent of Its Ability to Bind MET. Clinical Cancer Research. 2013;19:2381–2392. - PubMed
    1. Basso K, Saito M, Sumazin P, Margolin AA, Wang K, Lim WK, Kitagawa Y, Schneider C, Alvarez MJ, Califano A, et al. Integrated biochemical and computational approach identifies BCL6 direct target genes controlling multiple pathways in normal germinal center B cells. Blood. 2010;115:975–984. - PMC - PubMed

Publication types

MeSH terms

Substances

Associated data