. 2015 Oct;129(7):561-74.
doi: 10.1042/CS20150204. Epub 2015 Jun 11.

Impaired mitochondrial energy supply coupled to increased H2O2 emission under energy/redox stress leads to myocardial dysfunction during Type I diabetes

Affiliations

Impaired mitochondrial energy supply coupled to increased H2O2 emission under energy/redox stress leads to myocardial dysfunction during Type I diabetes

Carlo G Tocchetti et al. Clin Sci (Lond). 2015 Oct.

Abstract

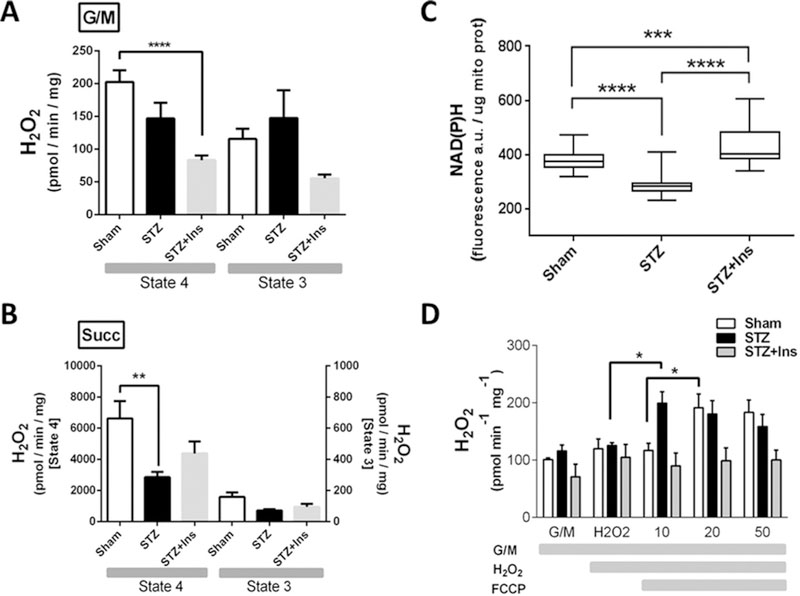
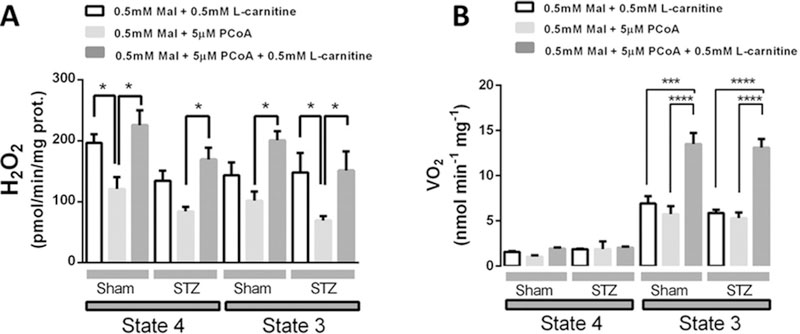
In Type I diabetic (T1DM) patients, both peaks of hyperglycaemia and increased sympathetic tone probably contribute to impair systolic and diastolic function. However, how these stressors eventually alter cardiac function during T1DM is not fully understood. In the present study, we hypothesized that impaired mitochondrial energy supply and excess reactive oxygen species (ROS) emission is centrally involved in T1DM cardiac dysfunction due to metabolic/redox stress and aimed to determine the mitochondrial sites implicated in these alterations. To this end, we used isolated myocytes and mitochondria from Sham and streptozotocin (STZ)-induced T1DM guinea pigs (GPs), untreated or treated with insulin. Relative to controls, T1DM myocytes exhibited higher oxidative stress when challenged with high glucose (HG) combined with β-adrenergic stimulation [via isoprenaline (isoproterenol) (ISO)], leading to contraction/relaxation deficits. T1DM mitochondria had decreased respiration with complex II and IV substrates and markedly lower ADP phosphorylation rates and higher H2O2 emission when challenged with oxidants to mimic the more oxidized redox milieu present in HG + ISO-treated cardiomyocytes. Since in T1DM hearts insulin-sensitivity is preserved and a glucose-to-fatty acid (FA) shift occurs, we next tested whether insulin therapy or acute palmitate (Palm) infusion prevents HG + ISO-induced cardiac dysfunction. We found that insulin rescued proper cardiac redox balance, but not mitochondrial respiration or contractile performance. Conversely, Palm restored redox balance and preserved myocyte function. Thus, stressors such as peaks of HG and adrenergic hyperactivity impair mitochondrial respiration, hampering energy supply while exacerbating ROS emission. Our study suggests that an ideal therapeutic measure to treat metabolically/redox-challenged T1DM hearts should concomitantly correct energetic and redox abnormalities to fully maintain cardiac function.

Keywords: adrenergic stimulation; calcium transient; contractility; diabetes; energetic transitions; glutathione; hyperglycaemia; redox balance.


Figures

Figure 1
Figure 1. Imaging of Sham, STZ and STZ + Ins cardiomyocyte redox status under normal or HG without or with ISO and Palm
Freshly isolated GP cardiomyocytes loaded with 2 μM MitoSOX (M-R) were Imaged simultaneously for NAD[P]H autofluorescence with two-photon microscopy (A-F). GSH was imaged in myocytes loaded with 50 μM MCB (G-L) [8,29] (see also the Materials and methods section). Baseline imaging of cells was done with Tyrode’s buffer, pH 7.5, containing 1 mM Ca2+ and 10 mM glucose (EG) followed by the same solution with 30 mM glucose (HG), in the absence or in the presence of 10 nM ISO (ISO). The same protocol was repeated in the presence of 0.4 mM Palm for Sham, STZ and STZ + Ins groups. Palm was bound to 10% albumin FA-free (4:1 molar ratio Palm/albumin) and prepared as described in [8] (see also the Supplementary Online Data). Cardiomyocytes in EG were perfused for 30 min or 3 min with HG without/with ISO respectively. After the incubation time, triplicate images were taken every 2 min from the same microscopic field during 10 min, and this process was repeated for a total of three fields, adding to at least six to ten cardiomyocytes in each experiment. This procedure enabled us to ascertain the steady state of ROS/GSH/NAD(P)H fluorescent signals while obtaining triplicate fluorescence measurements, the average of which was used for each cell. All observations were paired, i.e. performed in the same cells at all treatments and for all imaging experiments. Depicted are the results from four experiments (four hearts) with n=40–60 for each treatment and fluorescent probe after pooling the four data sets. The statistical significance of the differences between groups (Sham/STZ/STZ + Ins) was calculated by one-way ANOVA (OWA) within (e.g. EG) and across (EG/HG/HG + ISO) treatments and by two-way ANOVA (TWA) within treatments but ± Palm (e.g. HG, Sham/STZ/STZ + Ins, + or − Palm). Statistical significance within and across treatments is denoted * and & respectively, for OWA and # for TWA; *,#,&P < 0.05; **,##,&&P < 0.01; ***,###P < 0.001; ****,####p < 0.0001.
Figure 2
Figure 2. Energetic behaviour of isolated heart mitochondria from Sham, STZ and STZ + Ins GPs
Respiration in freshly isolated heart mitochondria from the three groups of GPs were analysed with a Seahorse Bloscience XF96 analyser as described in the Materials and methods section. (A-D) V˙O2 was assayed under states 4 and 3 as described in [8,12] with substrates from (B) complex I (5mM G/M), (C) complex II (5mM Succ and 1 μM rotenone) and (D) complex IV [0.5 mM TMPD (N,N,N′,N′-tetramethyl-p-phenylenediamine) and 3 mM sodium ascorbate]. State 3 was induced with 1 mM ADP in all cases. (A) RCR determined as the ratio of state 3/state 4. n=10–16 replicates from three experiments/hearts.
Figure 3
Figure 3. Redox and ROS status of mitochondria in the absence or presence of oxidative stress
Heart mitochondria from Sham, STZ and STZ + Ins groups were isolated and assayed as in the legend of Figure 2 and the Materials and methods section. (A and B) Specific rates of H2O2 emission from mitochondria (100–150 μg of mitochondrial protein) in states 4 and 3 respiration under (A) FET or (B) RET with Amplex Red [ARed] (see [8,12] and the Materials and methods section). The conditions utilized to measure H2O2 emission were the same as those employed for measuring respiration with the exception of RET where rotenone was omitted (see the Materials and methods section and the Figure 2 legend). (C) Basal levels of NADH fluorescence normalized with respect to protein from isolated mitochondria. (D) Isolated mitochondria were subjected to redox stress understate 4 respiration, as described in [27,33] (see the Results section ‘ROS emission from T1DM heart mitochondria in the absence or presence of oxidative stress’). The numbers 10, 20 and 50 in the x-axis correspond to nanomolar FCCP The data shown in (A-D) correspond to three experiments/hearts with n=10 (A and B), n=34 (C) and n=6 (D). Differences in ROS emission from state 3 respiration (A and B) were not significant. *P < 0.05; **P < 0.01; ***P < 0.001; ****P < 0.0001.
Figure 4
Figure 4. ROS emission and respiration from Sham and STZ mitochondria without or with PCoA
Heart mitochondria from Sham and STZ groups were isolated and assayed in parallel for H2O2 emission or for V˙O2 as described in the Materials and Methods section ‘Mitochondrial physiological studies’. (A) Specific rates of H2O2 emission from mitochondria (10 μg of mitochondrial protein) were determined in states 4 and 3 respiration under FET in the presence of 0.5 mM malate (Mal) without or with 5 μM PCoA and in the absence (omitting L-carnitine) or presence of β-oxidation (adding 0.5 mM L-carnitine), as indicated. (B) V˙O2 was assayed in states 4 and 3 (10 μg of mitochondrial protein) as in the legend of Figure 2 under the same substrate conditions described in (A). n=12 replicates from three experiments/hearts in each Sham or STZ group. *P < 0.05; **P < 0.01; ***P < 0.001; ****P < 0.0001.
Figure 5
Figure 5. Mitochondrial energetic and ROS responses as a function of ADP in the absence or presence of oxidative stress
Freshly Isolated mitochondria from Sham (A,B and E), STZ (C and F) and STZ + Ins (D and G) hearts were monitored by spectrofluorlmetry for 90° light scattering (LS; A-D) [27] or H2O2 emission with ARed (E-G). G/M (5/5 mM) energized heart mitochondria [100–150 μg of mitochondrial protein] were challenged with consecutive addition of increasing ADP concentrations. The stress protocol consisted of loading the mitochondria with 50 μMCB and then further challenging them with 1 μM H2O2 when assayed in the fluorimeter [33]. (A) Representative LS responses (low LS, state 4 relaxed mitochondria; high LS, state 3 condensed mitochondria) in non-stressed (black trace) or stressed (grey trace) mitochondria. Numbers indicate the cycling time in seconds. (B-D) From the cycling times determined in (A) and the amount of ADP in each addition we could calculate the rate of ADP phosphorylation assuming complete utilization. Depicted are the specific rates of ADP phosphorylation as a function of ADP concentration from non-stressed (black squares) and stressed (white squares) mitochondria. (E-G) Specific rate of H2O2 emission as a function of ADP in non-stressed (black squares) and stressed (white squares) mitochondria. Results in duplicate from three independent mitochondrial isolations (three hearts); *P < 0.05; **P < 0.01; ***P < 0.001.
Figure 6
Figure 6. Fractional shortening, Ca2+ transient and rate of sarcomere re-lengthening in Sham, STZ and STZ + Ins cardiomyocytes
Cardiomyocytes were isolated from hearts of the three GP groups as in [26] and analysed at room temperature for percentage fractional shortening (FS; A, D and G), Ca2+ transient amplitude (B, E and H) and TR90, time to 90% sarcomere re-lengthening (C, F and I), in parallel to the imaging studies (Figure 1). EG (10 mM glucose) and HG (30 mM glucose) and HG were utilized, without or with 10 nM ISO, in the absence or presence of pre-incubation with 0.4 mM Palm. n=20–30 from four to six hearts.

References

    1. Aon MA, Tocchetti CG, Bhatt N, Paolocci N and Cortassa S (2015) Protective mechanisms of mitochondria and heart function in diabetes. Antioxid. Redox Signal. 22, 1563–1586 - PMC - PubMed
    1. Reusch JE and Wang CC (2011) Cardiovascular disease in diabetes: where does glucose fit in? J. Clin. Endocrinol. Metab. 96, 2367–2376 - PMC - PubMed
    1. Schilling JD (2015) The mitochondria in diabetic heart failure: from pathogenesis to therapeutic promise. Antioxid. Redox Signal. 22, 1515–1526 - PMC - PubMed
    1. Jyotsna VP, Sahoo A, Sreenivas V and Deepak KK (2009) Prevalence and pattern of cardiac autonomic dysfunction in newly detected type 2 diabetes mellitus. Diabetes Res. Clin. Pract. 83, 83–88 - PubMed
    1. Choi SW, Benzie IF, Ma SW, Strain JJ and Hannigan BM (2008) Acute hyperglycemia and oxidative stress: direct cause and effect? Free Radic. Biol. Med. 44, 1217–1231 - PubMed

Publication types

MeSH terms