Comparative Study
. 2015 Jul 19:12:134.
doi: 10.1186/s12974-015-0352-2.

Evidence for the involvement of gamma delta T cells in the immune response in Rasmussen encephalitis

Affiliations
Comparative Study

Evidence for the involvement of gamma delta T cells in the immune response in Rasmussen encephalitis

Geoffrey C Owens et al. J Neuroinflammation. .

Abstract

Background: Rasmussen encephalitis (RE) is a rare neuroinflammatory disease characterized by intractable seizures and progressive atrophy on one side of the cerebrum. Perivascular cuffing and clusters of T cells in the affected cortical hemisphere are indicative of an active cellular immune response.

Methods: Peripheral blood mononuclear cells (PBMCs) and brain-infiltrating lymphocytes (BILs) were isolated from 20 RE surgery specimens by standard methods, and CD3(+) T cell populations were analyzed by flow cytometry. Gamma delta T cell receptor spectratyping was carried out by nested PCR of reversed transcribed RNA extracted from RE brain tissue, followed by high resolution capillary electrophoresis. A MiSeq DNA sequencing platform was used to sequence the third complementarity determining region (CDR3) of δ1 chains.

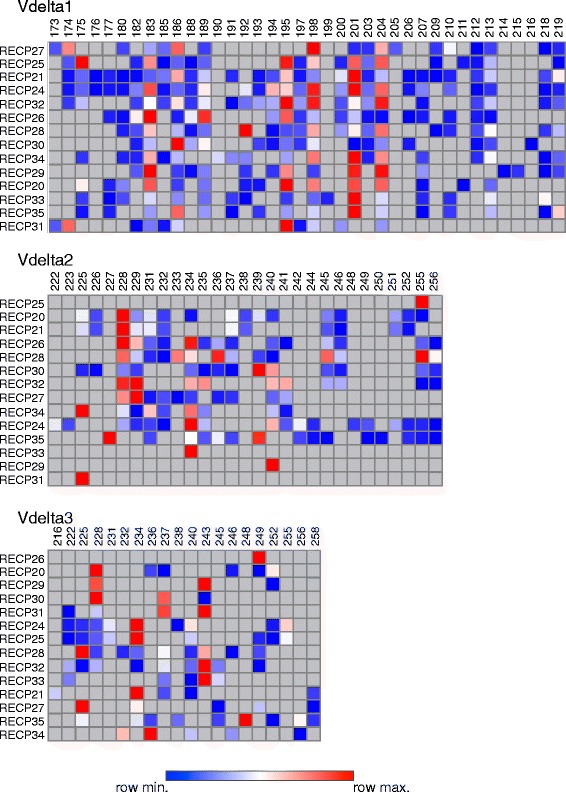
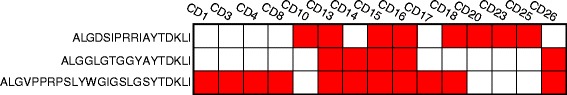
Results: CD3(+) BILs from all of the RE brain specimens comprised both αβ and γδ T cells. The median αβ:γδ ratio was 1.9 (range 0.58-5.2) compared with a median ratio of 7.7 (range 2.7-40.8) in peripheral blood from the same patients. The αβ T cells isolated from brain tissue were predominantly CD8(+), and the majority of γδ T cells were CD4(-) CD8(-). Staining for the early activation marker CD69 showed that a fraction of the αβ and γδ T cells in the BILs were activated (median 42%; range 13-91%, and median 47%; range 14-99%, respectively). Spectratyping T cell receptor (TCR) Vδ1-3 chains from 14 of the RE brain tissue specimens indicated that the γδ T cell repertoire was relatively restricted. Sequencing δ1 chain PCR fragments revealed that the same prevalent CDR3 sequences were found in all of the brain specimens. These CDR3 sequences were also detected in brain tissue from 15 focal cortical dysplasia (FCD) cases.

Conclusion: Neuroinflammation in RE involves both activated αβ and γδ T cells. The presence of γδ T cells with identical TCR δ1 chain CDR3 sequences in all of the brain specimens examined suggests that a non-major histocompatibility complex (MHC)-restricted immune response to the same antigen(s) is involved in the etiology of RE. The presence of the same δ1 clones in CD brain implies the involvement of a common inflammatory pathway in both diseases.


Figures

Fig. 1
Fig. 1
Phenotypic analysis of CD3+ T cell subsets in brain-infiltrating lymphocytes (BILs) and in peripheral blood mononuclear cells (PBMCs) from RE patients. The proportion of each T cell subtype as a percentage of the number of CD3+ cells gated in each sample is shown. a Stacked dot plot showing the percent of αβ T cells in BILs (red dots n = 20) compared with PBMCs (blue dots) from the same cases (p = 0.0001, pair-wise Wilcoxon signed-rank test). b Stacked dot plot showing the percent of TCR γδ T cells in BILs compared with PBMCs from the same patients (p = 0.0001, pair-wise Wilcoxon signed-rank test). c Stacked dot plot showing the ratio of CD4+ αβ:CD8+ αβ T cells in BILs compared with the corresponding PBMCs (p = 0.0001, pair-wise Wilcoxon signed-rank test). d Plot of the percent of CD69+ αβ T cells versus CD69+ γδ T cells in BIL fractions (n = 14; r = 0.9547, CI 0.8595, 0.9859, p < 0.0001). Additional file 1: Table S1 provides the quantitative data
Fig. 2
Fig. 2
Identification of γδ T cells in RE brain parenchyma by immunofluorescence microscopy. Sections of cortex from a RE hemispherectomy surgery were co-stained with a polyclonal CD3 antibody and a pan TCR γδ mAb. CD3 staining was visualized with an Alexa Fluor® 568 secondary antibody (a. d), and TCR γδ staining with an Alexa Fluor® 488 secondary antibody (b. e). c, f Merged images. Scale bars correspond to 100 μm
Fig. 3
Fig. 3
Heat map summarizing the spectratyping of Vδ chains in brain tissue from 14 RE patients. Sequences specific to the three major Vδ chains were amplified by nested PCR and separated by capillary electrophoresis. For each of the 14 RE samples and for each chain-specific primer, the area of each peak corresponding to a different fragment length was expressed as a fraction of the total area under the peaks and converted into a heat map. The data for each Vδ chain were clustered to show which samples were more related to each other based on the fragment lengths, which are listed above each heat map. RNA was extracted from samples of flash frozen brain tissue
Fig. 4
Fig. 4
Expression of T cell receptor (TCR) Vδ1 and Vδ2 chains by γδ T cells in brain-infiltrating lymphocytes (BILs) and peripheral blood mononuclear cells (PBMCs) from two RE patients. BILs and PBMCs from two RE cases were stained with CD3, CD4, CD8, TCR αβ, TCR Vδ1-, and TCR Vδ2-specific antibodies. CD3+ CD4 CD8 PBMCs are predominantly Vδ2+ (76.7 and 79.8 % for RECP26 and RECP33, respectively), whereas most CD3+ CD4 CD8 BILs express Vδ1 (89.8 and 97.1 % for RECP26 and RECP33, respectively). The number of CD3+ BILs gated was 1887 for RECP26 and 1516 for RECP33
Fig. 5
Fig. 5
Frequency of δ1 clonotypes present at >1 % in RE brain tissue. PCR fragments amplified with a Vδ1-specific forward primer were sequenced on a MiSeq DNA sequencing platform. Sequences were assigned to individual T cell clonotypes based on three criteria: (1) nucleotides coding for the last four amino acids of the variable (V) region, which contribute to the third complementarity determining region (the IMGT algorithm lists amino acid changes with respect to a reference Vδ1 sequence, which is shown in the figure, (2) the number and identity of diversity (D) gene segments, and (3) the identity of the joining (J) gene sequences. There are three possible D gene segments and four possible J gene segments. Clonotypes were selected from each sample that comprised >1 % of the total repertoire in each sample. Collectively, these 49 clonotypes made up more than 70 % of the repertoire of γδ T cells expressing Vδ1 in each of the RE brain tissue samples. Of these, several dominant clones were evident (bold-faced type). A heat map was generated from the quantitative data; the vertical columns show the relative abundance of each clonotype in each sample. The data are clustered to show which cases have the most similar repertoires. Additional file 3: Table S3 shows the quantitative data
Fig. 6
Fig. 6
Identical Vδ1 CDR3 sequences in dominant clonotypes present in RE brain tissue. CDR3 sequences of four dominant clonotypes were analyzed, and the most frequent CDR3 sequence in each sample was determined for each clonotype. Identical sequences were found in every sample for three of the clonotypes. The shaded amino acid is the last residue encoded in the V gene segment. A heat map was generated from the quantitative data; the rows show the relative abundance of each CDR3 sequence in each sample. Additional file 4: Table S4 provides the quantitative data
Fig. 7
Fig. 7
Vδ1 CDR3 sequences in dominant clonotypes are detectable in resected cortical dysplasia brain tissue. Primers were designed based on the most prevalent DNA sequences that specified the CDR3 regions of three of the dominant δ1 clonotypes identified in RE brain tissue. PCR products were sequenced. A red square denotes the presence of a sequence, and an open square indicates its absence. Aligned DNA sequences are shown in Additional file 8: Figure S2

References

    1. Rasmussen T, Olszewski J, Lloydsmith D. Focal seizures due to chronic localized encephalitis. Neurology. 1958;8:435–45. doi: 10.1212/WNL.8.6.435. - DOI - PubMed
    1. Bien CG, Tiemeier H, Sassen R, Kuczaty S, Urbach H, et al. Rasmussen encephalitis: incidence and course under randomized therapy with tacrolimus or intravenous immunoglobulins. Epilepsia. 2013;54:543–50. doi: 10.1111/epi.12042. - DOI - PubMed
    1. Varadkar S, Bien CG, Kruse CA, Jensen FE, Bauer J, et al. Rasmussen’s encephalitis: clinical features, pathobiology, and treatment advances. Lancet Neurol. 2014;13:195–205. doi: 10.1016/S1474-4422(13)70260-6. - DOI - PMC - PubMed
    1. Walter GF, Renella RR. Epstein-Barr virus in brain and Rasmussen’s encephalitis. Lancet. 1989;1:279–80. doi: 10.1016/S0140-6736(89)91292-0. - DOI - PubMed
    1. Power C, Poland SD, Blume WT, Girvin JP, Rice GP. Cytomegalovirus and Rasmussen’s encephalitis. Lancet. 1990;336:1282–4. doi: 10.1016/0140-6736(90)92965-K. - DOI - PubMed

Publication types

MeSH terms

Substances

Supplementary concepts