. 2015 Sep 10;126(11):1302-13.
doi: 10.1182/blood-2015-01-623645. Epub 2015 Jul 17.

Leukemic marrow infiltration reveals a novel role for Egr3 as a potent inhibitor of normal hematopoietic stem cell proliferation

Affiliations

Leukemic marrow infiltration reveals a novel role for Egr3 as a potent inhibitor of normal hematopoietic stem cell proliferation

Hui Cheng et al. Blood. .

Abstract

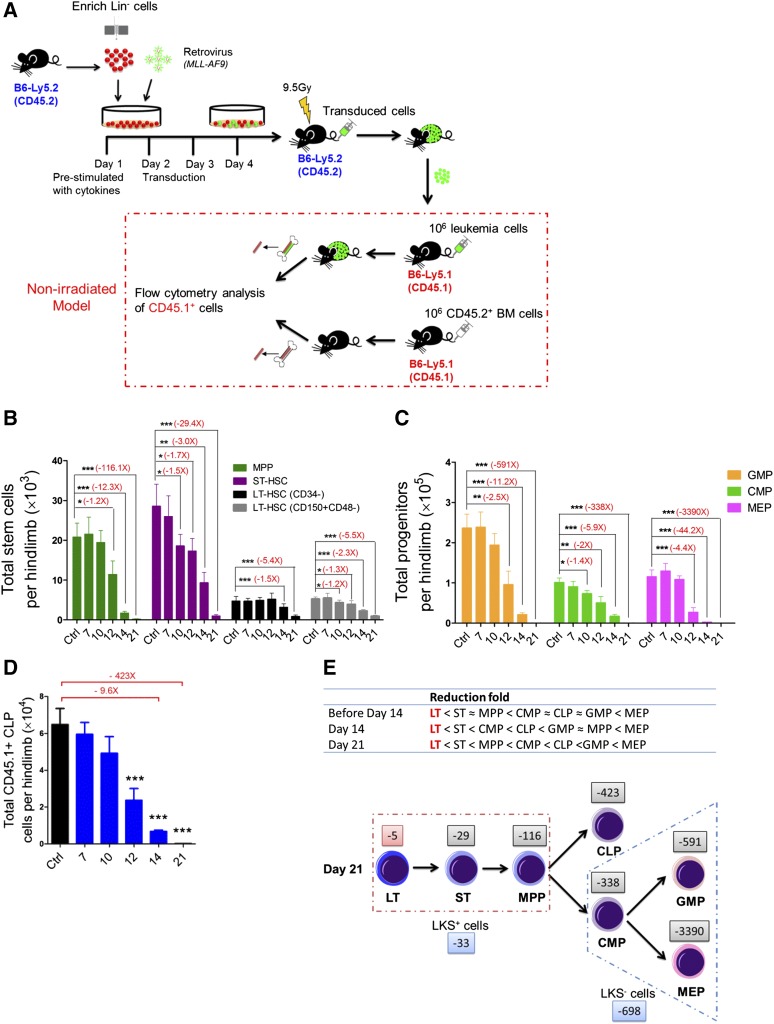
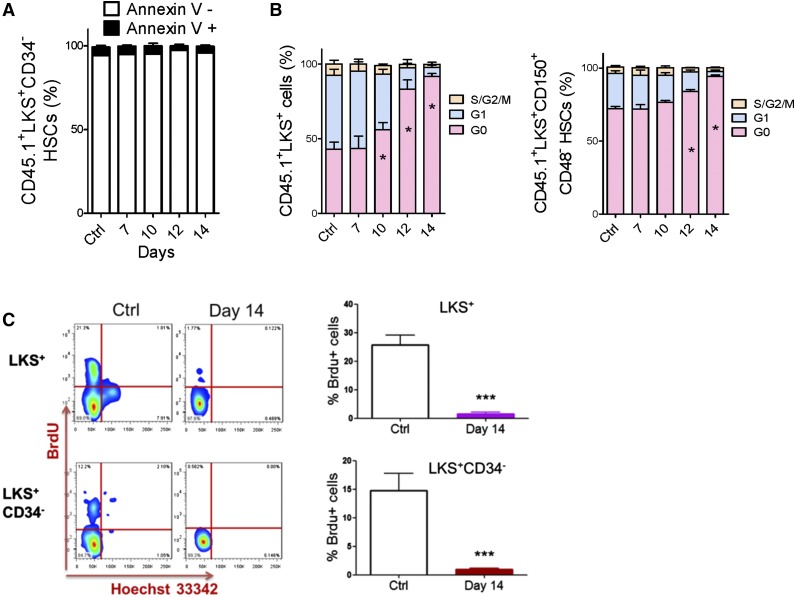
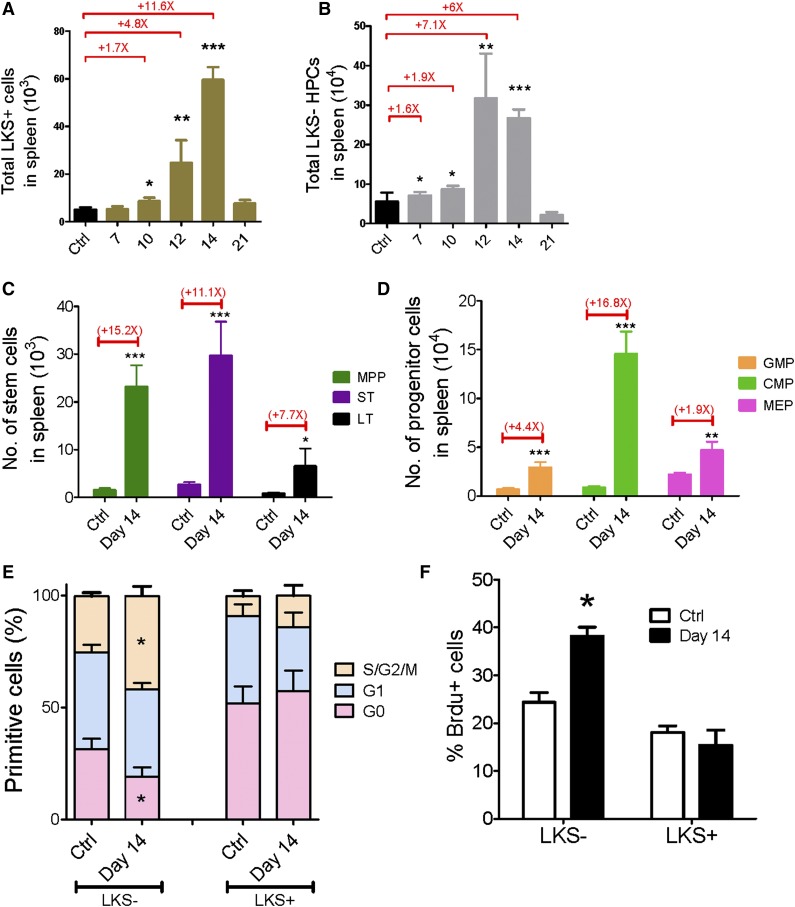
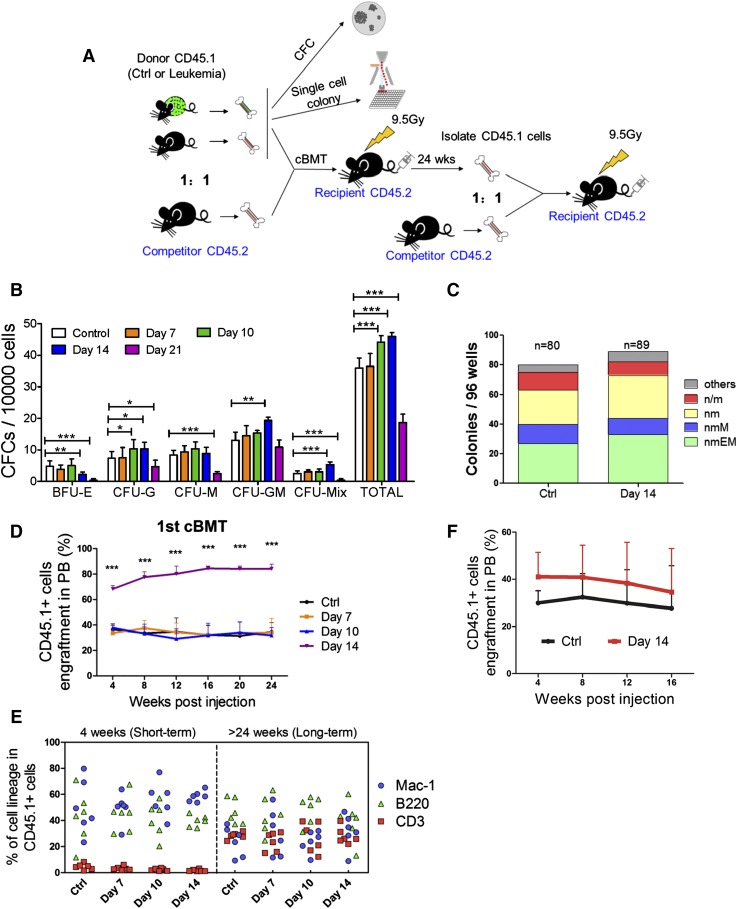
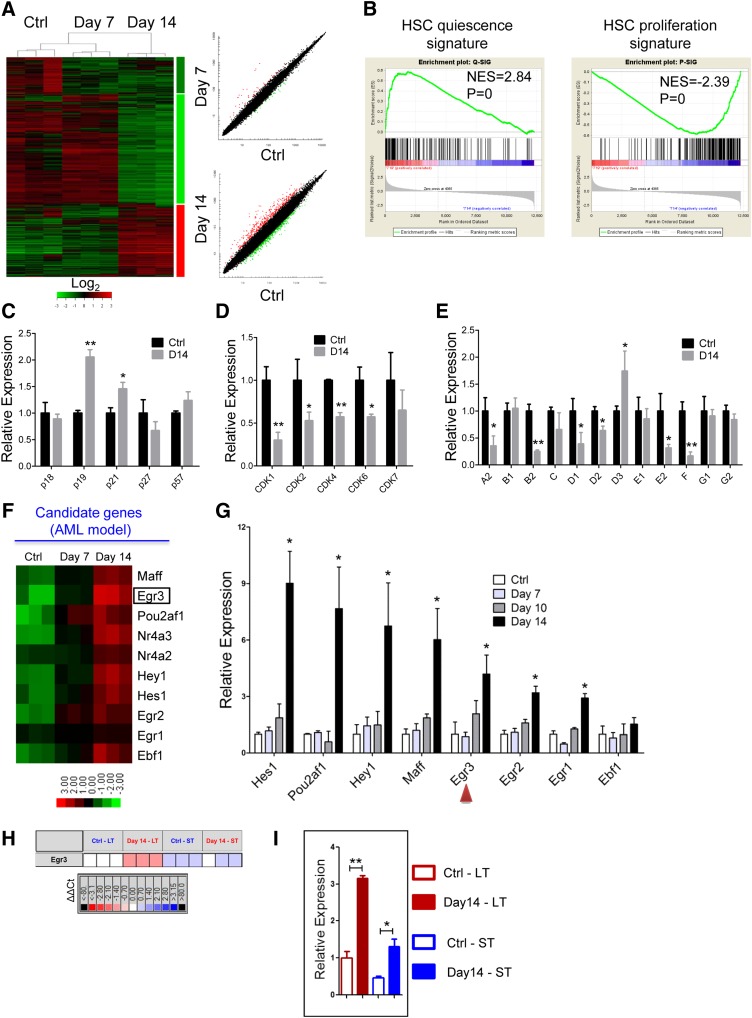
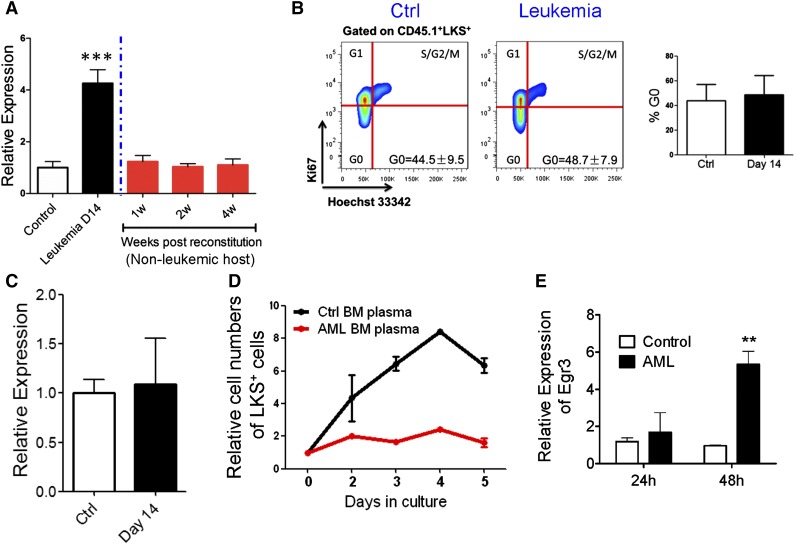
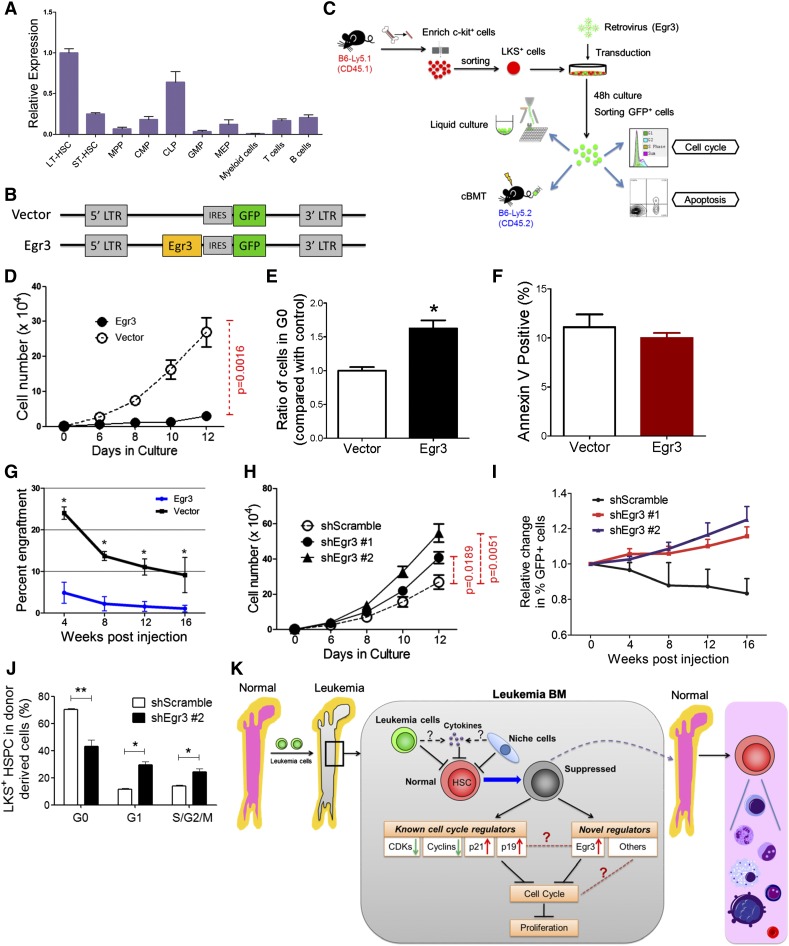
Cytopenias resulting from the impaired generation of normal blood cells from hematopoietic precursors are important contributors to morbidity and mortality in patients with leukemia. However, the process by which normal hematopoietic cells are overtaken by emerging leukemia cells and how different subsets of hematopoietic stem cells (HSCs) and hematopoietic progenitor cells (HPCs) are distinctly influenced during leukemic cell infiltration is poorly understood. To investigate these important questions, we used a robust nonirradiated mouse model of human MLL-AF9 leukemia to examine the suppression of HSCs and HPCs during leukemia cell expansion in vivo. Among all the hematopoietic subsets, long-term repopulating HSCs were the least reduced, whereas megakaryocytic-erythroid progenitors were the most significantly suppressed. Notably, nearly all of the HSCs were forced into a noncycling state in leukemic marrow at late stages, but their reconstitution potential appeared to be intact upon transplantation into nonleukemic hosts. Gene expression profiling and further functional validation revealed that Egr3 was a strong limiting factor for the proliferative potential of HSCs. Therefore, this study provides not only a molecular basis for the more tightened quiescence of HSCs in leukemia, but also a novel approach for defining functional regulators of HSCs in disease.


Figures

Figure 1
Figure 1
Kinetics of hematopoiesis in leukemic BM. (A) Retroviral transduction procedure and induction of leukemia in nonirradiated recipient mice. (B) Absolute numbers of LT-HSCs, ST-HSCs, and multipotent progenitors in leukemic BM. (C-D) Absolute numbers of GMPs, CMPs, MEPs (D), and CLPs (E) in leukemic BM. Data are represented as the mean ± standard error of the mean (SEM) (n = 12; 3 independent experiments). (E) Reduced speed (upper panel) and a model (lower panel) showing the differentiation block from HSCs to HPCs. The numbers (eg, −5 and −29) indicate the fold decrease. Plus (+) or minus (−), increase or decrease. *P < .05; **P < .01; ***P < .001.
Figure 2
Figure 2
Apoptosis and cell cycle status of HSCs in leukemic BM. (A) Apoptosis rate of HSCs in leukemic BM. (B) Cell cycle status of HSCs in leukemic BM. (C) Flow plots (left panel) and histogram (right panel) show the BrdU incorporation of HSCs (LKS+ and LKS+CD34) in leukemic BM. Data are represented as the mean ± SEM (n = 12; 3 independent experiments). Ctrl, control. *P < .05; *** P < .001.
Figure 3
Figure 3
Kinetics of hematopoiesis in the leukemic spleen. (A-B) Absolute numbers of LKS+ (A) and LKS (B) cells in the leukemic spleen. (C-D) Absolute numbers of LT-HSCs, ST-HSCs, MPPs (C), GMPs, CMPs, and MEPs (D) in the leukemic spleen. (E) Ki67 staining of LKS+ and LKS cells in the leukemic spleen. (F) BrdU staining of LKS+ and LKS cells in the leukemic spleen. Data are represented as the mean ± standard error of the mean (n = 12; 3 independent experiments). Ctrl, control. *P < .05; **P < .01; ***P < .001.
Figure 4
Figure 4
Functional assessments of hematopoietic cells isolated from leukemic mice. (A) Scheme of the colony assays and cBMTs. (B) The histogram shows the colony-forming ability of normal hematopoietic cells from leukemic and control BM. Data are represented as the mean ± SEM (n = 12; 2 independent experiments). (C) The histogram shows the single cell colony-forming ability of normal LT-HSCs from the leukemic and control BM. (D) The percentage of CD45.1+ donor cells in the PB of recipient mice at the indicated time points after primary cBMT. The donor cells were CD45.1+ BM cells. Data are represented as the mean ± SEM (n = 10-12; 2 independent experiments). (E) Short-term and long-term multilineage reconstitution capacities of donor-derived (CD45.1+) PB cells in primary recipients. (F) The percentage of CD45.1+ donor cells in the PB of recipient mice at the indicated time points after primary cBMT. Donor cells were CD45.1+LKS+CD34 LT-HSCs. Data are represented as the mean ± standard deviation (SD) (n = 7). Ctrl, control. *P < .05; **P < .01; ***P < .001.
Figure 5
Figure 5
Differential gene expression of HSCs from the leukemic and control mice. (A) Heatmap (left panel) and scatter-plot representation (right panel) of differential gene expression in normal LKS+ cells at different stages of leukemia. The color scale indicates normalized expression values. (B) Gene set enrichment analysis comparison of LKS+ cells from day 14 leukemia and control mice: the upregulation or downregulation of HSC quiescence-associated gene expression (left panel) and proliferation-associated gene expression (right panel). The normalized enrichment scores (NES) and P values are indicated in each plot. (C-E) The histograms show cell cycle-related gene expression levels in BM LKS+ cells at leukemia day 14 compared with the control. CKIs (C), CDKs (D), and cyclins (E). Data are represented as the mean ± SEM (n = 9; 3 independent experiments). (F) Heatmap representation of candidate gene expression in normal LKS+ cells at different stages of AML. The color scale indicates normalized expression values. (G) The qRT-PCR analysis shows the expression levels of candidate genes in normal LKS+ cells at different stages of AML. Data are represented as the mean ± SEM (n = 9; 3 independent experiments). The red arrowheads indicate the 2 genes that we studied further. (H) The quantitative polymerase chain reaction array analysis of Egr3 expression in LT-HSCs (LKS+CD34) and ST-HSCs (LKS+CD34+) from day 14 leukemia and control mice. Representative heat map of δ-δ Ct (ΔΔCt) values of positive signals. The red and blue colors indicate high and low gene expression, respectively, relative to the reference. Black indicates no detectable signal. (I) Egr3 expression in LT-HSCs and ST-HSCs from day 14 leukemia and control mice (refer to Figure 5H). Data are represented as the mean ± SEM. Ctrl, control. *P < .05; **P < .01.
Figure 6
Figure 6
Correlation of Egr3 expression with HSPC proliferation. (A) Egr3 expression in normal LKS+ cells in leukemic and nonleukemic microenvironments. Normal cells (CD45.1) were isolated from leukemia day 14 and transplanted into nonleukemic recipients. LKS+ cells were sorted 1 to 4 weeks after reconstitution. Data are represented as the mean ± SD (n = 3). (B) Flow plots (left panel) and histogram (right panel) of the cell cycle status of donor LKS+ cells from primary recipients (control [Cntrl] vs day 14). Data are represented as the mean ± SD (n = 6). (C) Egr3 expression in LKS+ cells from leukemic and control spleen. Data are represented as the mean ± SD (n = 6). (D) Coculture of LKS+ cells with BM plasma. Normal LKS+ cells were cultured with BM plasma obtained from control and day 14 leukemic mice. The proliferation of LKS+ cells was markedly suppressed by the leukemic BM plasma. Data are represented as the mean ± SEM (n = 6; 2 independent experiments). (E) LKS+ cells were treated as indicated in Figure 6D. Egr3 expression is shown. Data are represented as the mean ± SEM (n = 6; 2 independent experiments). **P < .01; ***P < .001.
Figure 7
Figure 7
Functional impact of Egr3 expression in HSPCs. (A) The gene expression pattern of Egr3 in hematopoietic cells at different stages. Data are represented as the mean ± SD (n = 3). (B) Diagram of the vectors used to express Egr3 in LKS+ cells. Egr3 cDNA was cloned into murine stem cell virus for subsequent transduction into cells. (C) Schematic of the overexpression experiments in LKS+ cells using the indicated retroviruses shown in Figure 7B. (D) LKS+ cells were treated as indicated in Figure 7C. GFP+ cell proliferation is shown. (E) Quantification of cells remaining in G0, as indicated in Figure 7C. Data are represented as the mean ± SEM (n = 6-8; 2 independent experiments). (F) Apoptotic analysis of LKS+ cells 48 hours after transduction with control or Egr3 retrovirus. Data are represented as the mean ± SEM (n = 6-8; 2 independent experiments). (G) The percentage of GFP+ donor cells in the PB of recipient mice at the indicated time points. Data are represented as the mean ± SD (n = 7-9). (H) In vitro liquid culture of Egr3-knockdown cells. Data are represented as the mean ± SEM (n = 8; 2 independent experiments). (I) The histogram shows changes in PB chimerism of GFP+ cells in recipients at the indicated time points after transplantation. In this assay, we did not sort the GFP+ cells after 48 hours of transduction. We directly injected the GFP+ and GFP cells into the recipients. The percentage of cells expressing GFP on the day of injection was normalized to 1. Data are represented as the mean ± SD (n = 6-8). (J) The cell cycle status of LKS+ cells in leukemic BM after Egr3 knockdown. Data are represented as the mean ± SEM (n = 8; 2 independent experiments). (K) Schematic of the response of HSCs to leukemia stress. The molecular mechanisms by which leukemia affects normal HSCs, as suggested by our studies, are indicated. IRES, internal ribosome entry site; LTR, long terminal repeats. *P < .05; **P < .01.

Comment in

  • "Blood feuds".
    Mukherjee S. Mukherjee S. Blood. 2015 Sep 10;126(11):1264-5. doi: 10.1182/blood-2015-07-659540. Blood. 2015. PMID: 26359429 No abstract available.

References

    1. McKinney-Freeman S, Cahan P, Li H, et al. The transcriptional landscape of hematopoietic stem cell ontogeny. Cell Stem Cell. 2012;11(5):701–714. - PMC - PubMed
    1. Krause DS, Scadden DT. Deconstructing the complexity of a microenvironmental niche. Cell. 2012;149(1):16–17. - PMC - PubMed
    1. Zon LI. Intrinsic and extrinsic control of haematopoietic stem-cell self-renewal. Nature. 2008;453(7193):306–313. - PubMed
    1. He S, Nakada D, Morrison SJ. Mechanisms of stem cell self-renewal. Annu Rev Cell Dev Biol. 2009;25:377–406. - PubMed
    1. Seita J, Weissman IL. Hematopoietic stem cell: self-renewal versus differentiation. Wiley Interdiscip Rev Syst Biol Med. 2010;2(6):640–653. - PMC - PubMed

Publication types

MeSH terms