Review
. 2015 Nov:49:46-66.
doi: 10.1016/j.preteyeres.2015.07.004. Epub 2015 Jul 15.

Advances in understanding the molecular basis of the first steps in color vision

Affiliations
Review

Advances in understanding the molecular basis of the first steps in color vision

Lukas Hofmann et al. Prog Retin Eye Res. 2015 Nov.

Abstract

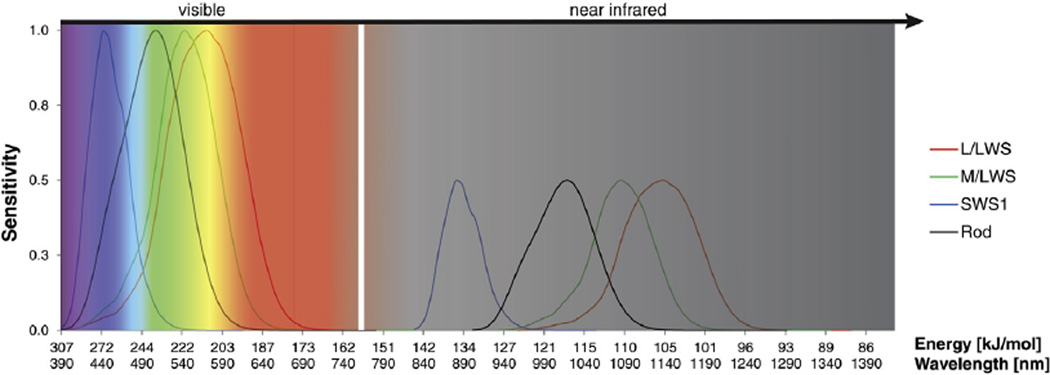
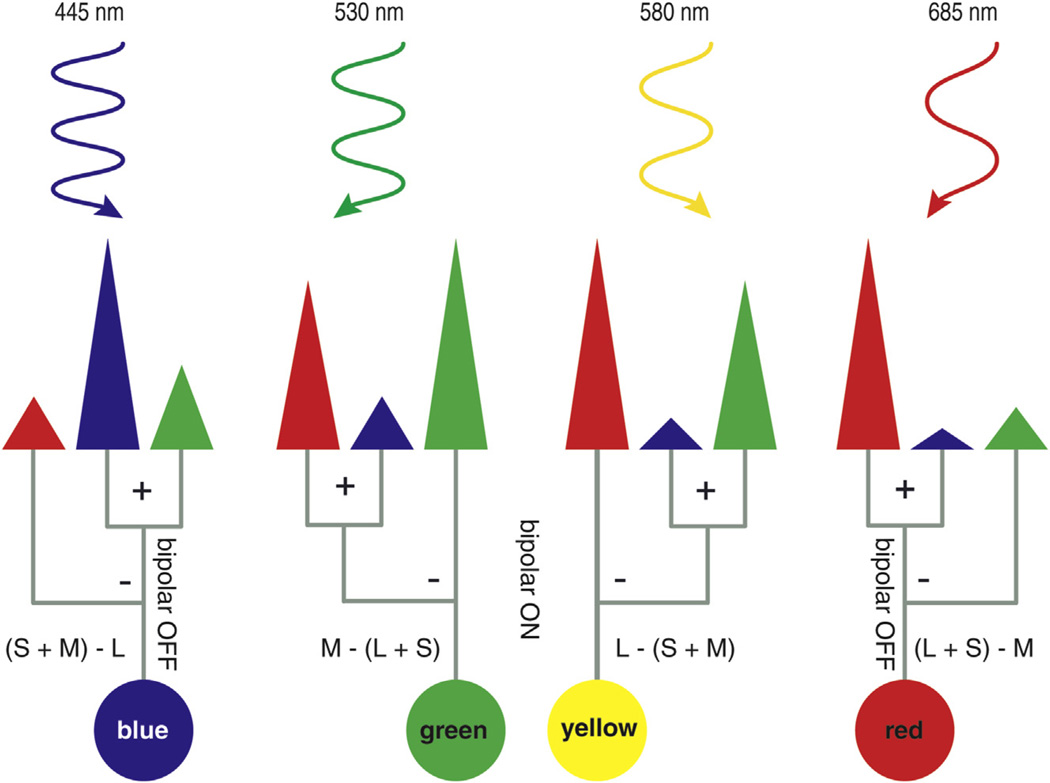
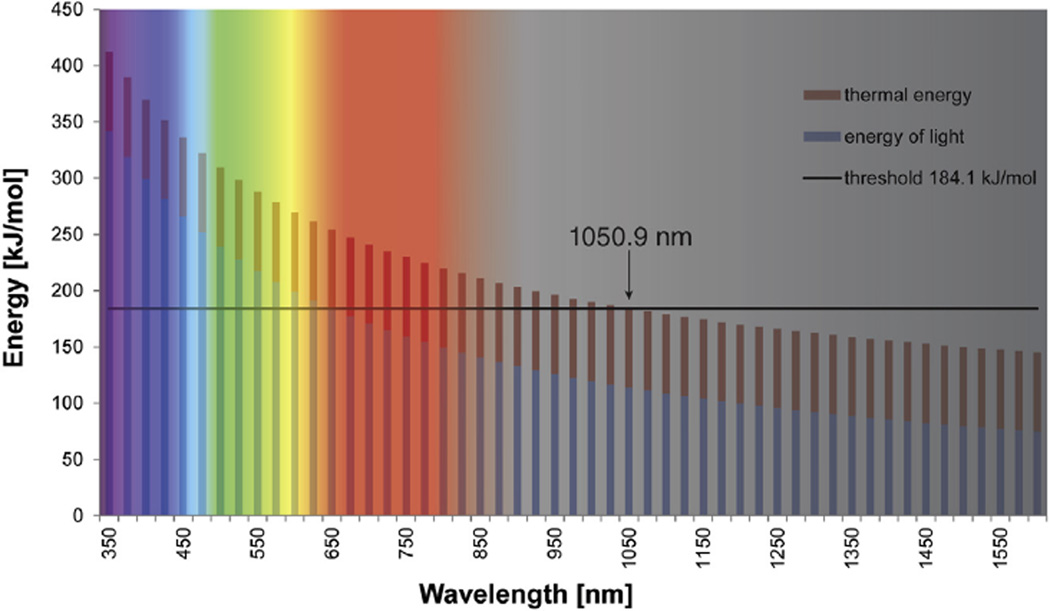
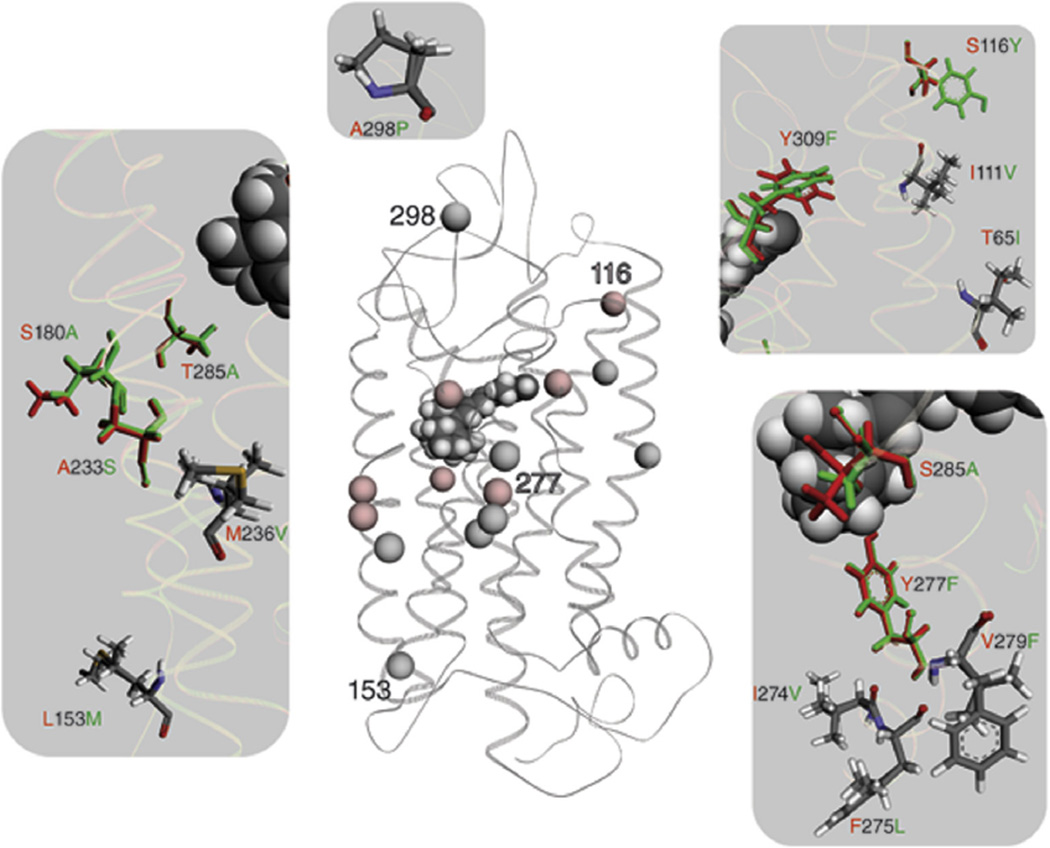
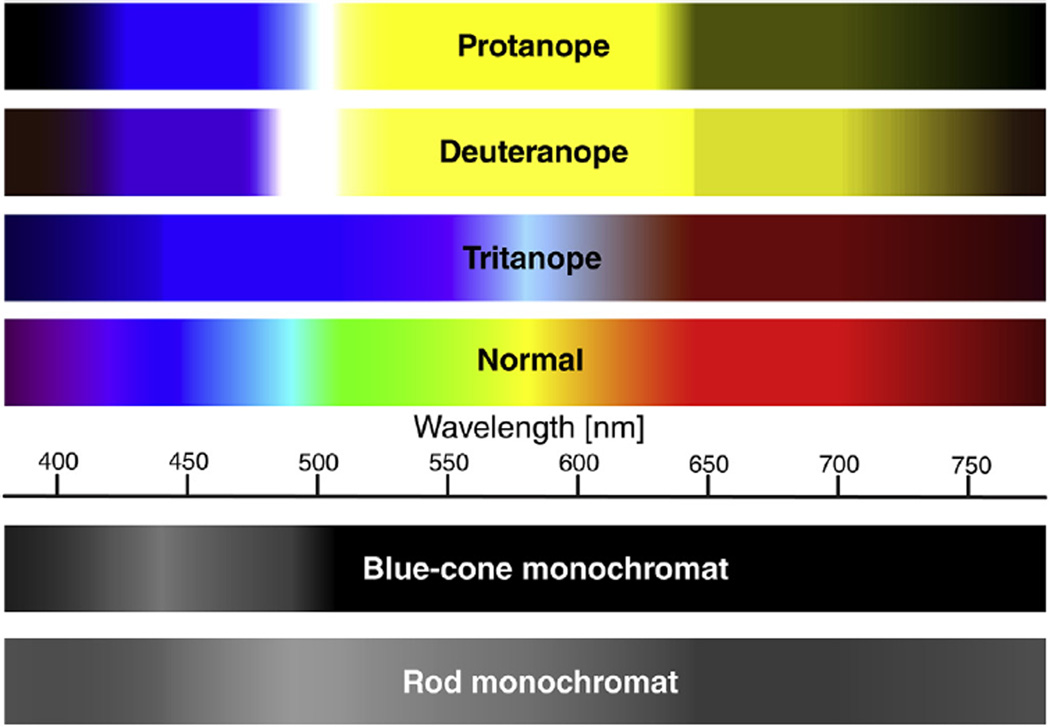
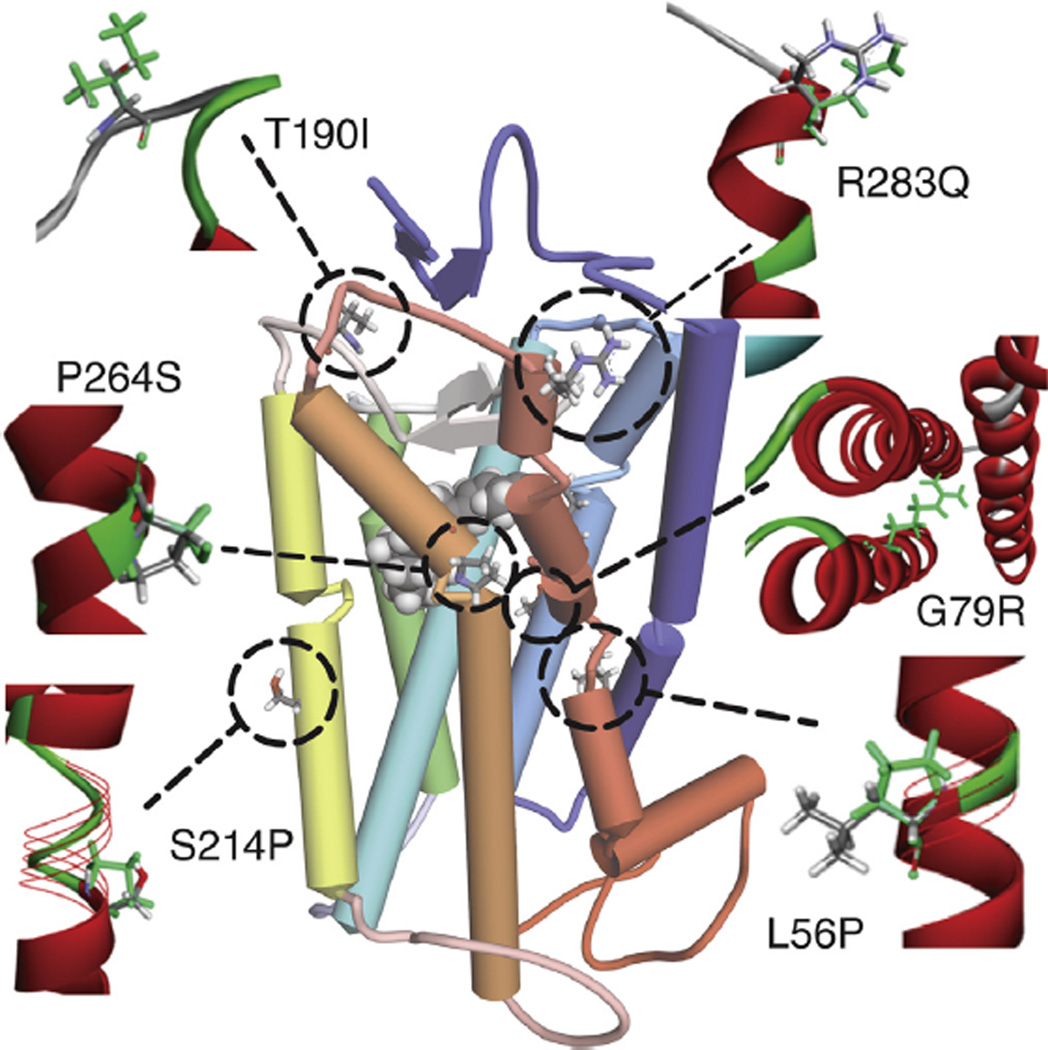
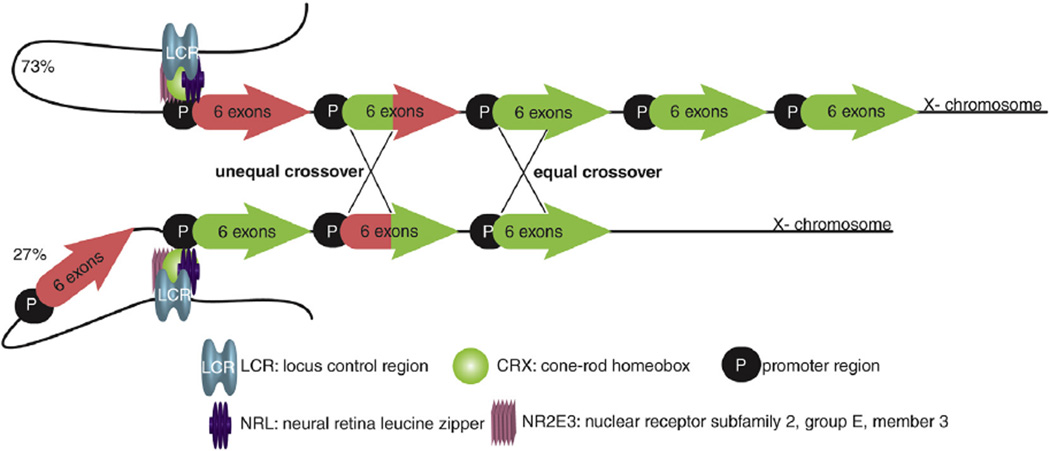
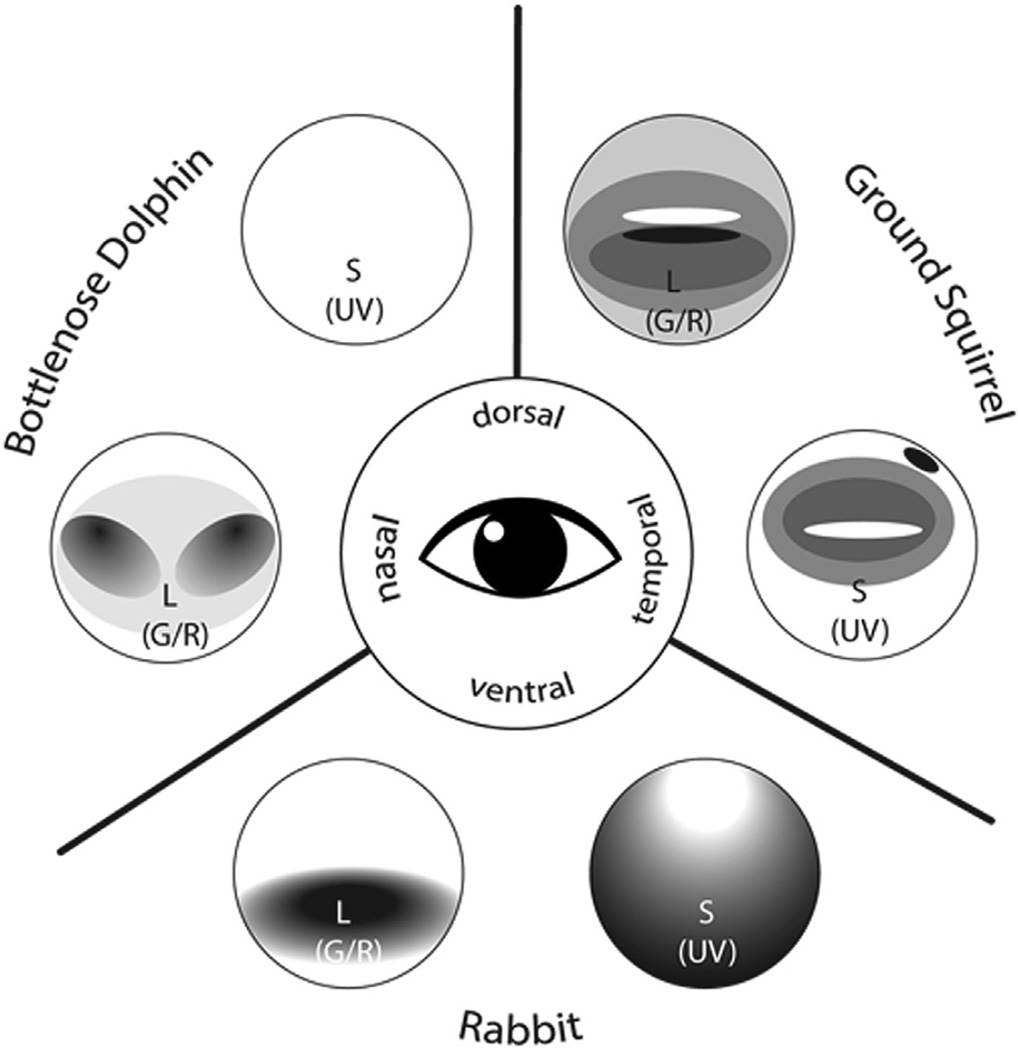
Serving as one of our primary environmental inputs, vision is the most sophisticated sensory system in humans. Here, we present recent findings derived from energetics, genetics and physiology that provide a more advanced understanding of color perception in mammals. Energetics of cis-trans isomerization of 11-cis-retinal accounts for color perception in the narrow region of the electromagnetic spectrum and how human eyes can absorb light in the near infrared (IR) range. Structural homology models of visual pigments reveal complex interactions of the protein moieties with the light sensitive chromophore 11-cis-retinal and that certain color blinding mutations impair secondary structural elements of these G protein-coupled receptors (GPCRs). Finally, we identify unsolved critical aspects of color tuning that require future investigation.

Keywords: Color blindness; Color vision; Cone photoreceptor(s); Energetics; Retina; Spectral tuning; Vision; Visual pigments.


Conflict of interest statement

Conflicts of interest

The authors have declared that no conflict of interest exists.

Figures

Fig. 1
Fig. 1
Shown are the visible and IR spectra with normalized cone and rod spectral sensitivities according to the 10-deg fundamentals based on the Stiles and Burch 10-deg color matching functions (CMFs) (Stockman and Sharpe, 2000). The normalized sensitivity of the visual spectrum is combined with the corresponding IR spectrum determined by the two-photon effect. The corresponding IR spectrum shows a sensitivity maximum of 50% due to the two-photon effect. The white vertical line separating the classical visible from the near IR spectrum indicates the boundary between these two spectra.
Fig. 2
Fig. 2
A simplified model of light absorption and neuronal processing according to the color opponent theory modified by (Schmidt et al., 2014a). Representations of blue, green, yellow and red monochromatic light from short to long wavelengths are shown at increasing wavelengths. The corresponding qualitative and normalized cone spectral sensitivities are illustrated by the size of each cone. The cones are colored according to their spectral sensitivity, red for L/LWS, green for M/LWS and blue for SWS1 cone photoreceptor cells. A simplified processing of the cone signals through the midget ganglion cells is represented by gray lines which finally results in color perception. Nevertheless, contributions of rod photoreceptor cells and melanopsin containing retinal ganglion cells are still missing (Barrionuevo and Cao, 2014).
Fig. 3
Fig. 3
Photon specific energy contribution to opsin activation throughout the visible and IR spectra. The wavelength-dependent energy of light is depicted in blue; red bars correspond to the thermal energy contribution of 310.15 K (37 °C), 70.3kJmol(16.8kcalmol). The black horizontal line corresponds to the thermal activation energy of bovine rhodopsin, EAT=184.1kJmol(44.0kcalmol) (Lythgoe and Quilliam, 1938). At 1050.9 nm the combined thermal and radiation energy crosses the threshold which implies the theoretical limit of mammalian light perception.
Fig. 4
Fig. 4
A structural comparison between the L/LWS and M/LWS opsin model is shown. Wire representation of the L/LWS and M/LWS model is based on the rhodopsin crystal structure. Spheres illustrate differences in the amino acid sequence between L/LWS and M/LWS. Red spheres indicate differences responsible for spectral tuning between L/LWS and M/LWS, whereas gray spheres do not contribute to color tuning, according to (Asenjo et al., 1994). Numbers within the LWS model help to orient between the magnifications and the GPCR overview. Fifteen changes in amino acid residues are magnified on a gray background; amino acid residues contributing to color tuning are in their corresponding colors, namely red for L/LWS and green for M/LWS. Changed amino acid residues that do not affect spectral tuning are colored according their atoms.
Fig. 5
Fig. 5
Comparison of normal and deficient color vision. Visible spectra illustrated for five types of human color blindness are adapted from (Karl and Gegenfurtner, 2001). The spectra represent only severe cases of color vision deficiencies and a common spectrum for normal color vision. Actually, there are milder degrees of color vision deficiencies such as deuteranomaly and protanomaly. These anomalous trichromats contain at least one normal cone opsin and one set, which evidence a minor spectral shift from each other (Bollinger et al., 2004; Yamaguchi et al., 1997). Furthermore, 38% of Caucasian males with normal trichromacy contain variation in the red opsin that alters the normal spectrum.
Fig. 6
Fig. 6
A schematic view of the SWS1 opsin with the six disease-causing mutations depicted in black. Each mutation is displayed as green sticks, whereas the wild-type is displayed according to element color. The protein is shown in a ribbon representation colored according to its secondary structure. Red represents α-helical structures, cyan indicates beta strands and loops are shown in green. The structure is displayed as a wire ribbon, where mutations have changed the secondary structure of the wild-type protein.
Fig. 7
Fig. 7
A combined figure of transcription regulation, organization and crossover events of LWS opsin genes. L/LWS, M/LWS head to tail gene arrays are shown with the LCR located about 3.5 kb upstream. L/LWS genes are depicted in red, M/LWS genes in green. LCR regulates the expression of the first two LWS gene copies. Obviously a deletion or other damage of the LCR leads to BCM. The left and right crosses indicate unequal or equal crossovers, respectively during meiosis resulting in either a hybrid gene or exchange of a whole gene. The upper strand depicts the binding of LCR to the promoter region of the first L/LWS gene, whereas the lower strand represents the binding of LCR to the first M/LWS gene promoter via its three transcription factors. Percentages on the left indicate the distance-dependent probability of gene transcription regulated by LCR in Caucasian males (Carroll et al., 2000; McMahon et al., 2008).
Fig. 8
Fig. 8
Topography of the spectral cone types in mammalian species. The bottlenose dolphin represents marine mammals lacking SWS cone photoreceptor cells. The ground squirrel represents a cone dominant diurnal species with a high density spot of SWS cones in the dorso-temporal region of the retina. The rabbit contains SWS cone photoreceptors in an increasing gradient from the area centralis to the ventral region of the retina (Ahnelt and Kolb, 2000).
Fig. 9
Fig. 9
Schematic optics of the eye provide an explanation of the SWS1 cone distribution around the central fovea. Polychromatic light indicated by an arrow (left) undergoes different aberrations through the lens and vitreous. This process causes the different focus points behind (red), on (green) and in front (blue) of the retina. Dimensions of fovea are from (Kolb, 2015).

References

    1. Agte S, Junek S, Matthias S, Ulbricht E, Erdmann I, Wurm A, Schild D, Kas JA, Reichenbach A. Muller glial cell-provided cellular light guidance through the vital guinea-pig retina. Biophys. J. 2011;101:2611–2619. - PMC - PubMed
    1. Ahnelt PK. The photoreceptor mosaic. Eye (Lond) 1998;12(Pt 3b):531–540. - PubMed
    1. Ahnelt PK, Kolb H. The mammalian photoreceptor mosaic-adaptive design. Prog. Retin Eye Res. 2000;19:711–777. - PubMed
    1. Ahnelt PK, Hokoc JN, Rohlich P. The opossum photoreceptors–a model for evolutionary trends in early mammalian retina. Rev. Bras. Biol. 1996;56(Su 1 Pt 2):199–207. - PubMed
    1. Aho AC, Donner K, Hyden C, Larsen LO, Reuter T. Low retinal noise in animals with low body temperature allows high visual sensitivity. Nature. 1988;334:348–350. - PubMed

Publication types

MeSH terms