. 2015 Oct;138(Pt 10):2891-906.
doi: 10.1093/brain/awv208. Epub 2015 Jul 17.

Single unit action potentials in humans and the effect of seizure activity

Affiliations

Single unit action potentials in humans and the effect of seizure activity

Edward M Merricks et al. Brain. 2015 Oct.

Abstract

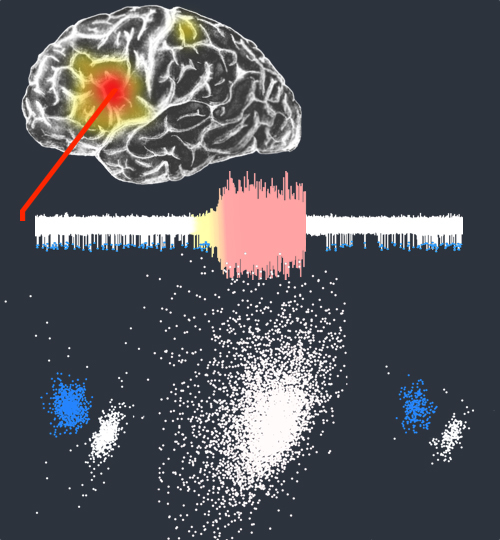
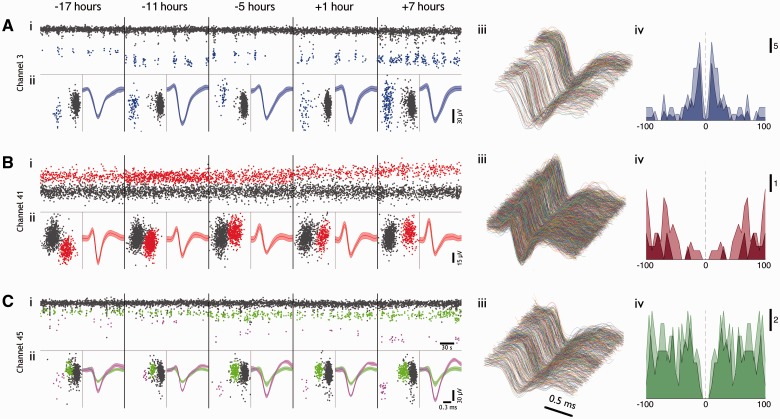
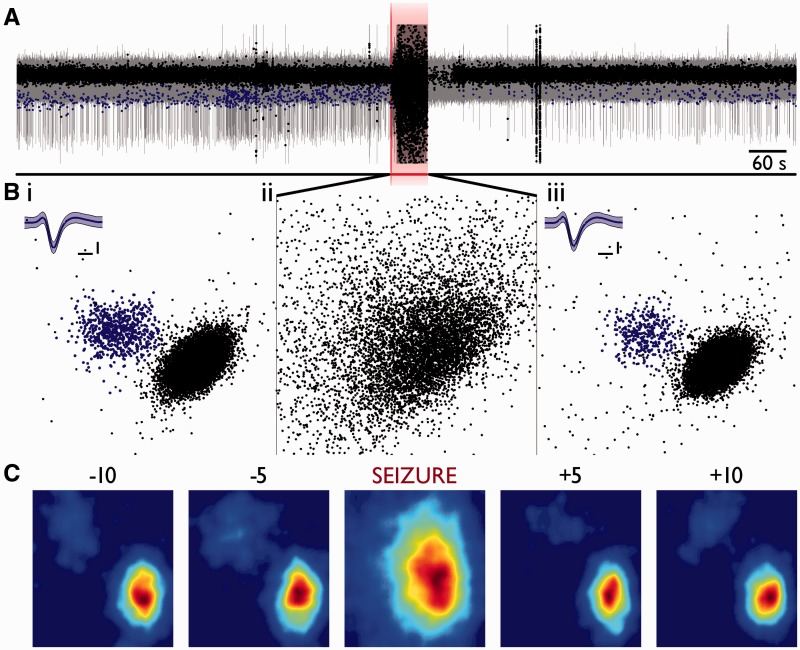
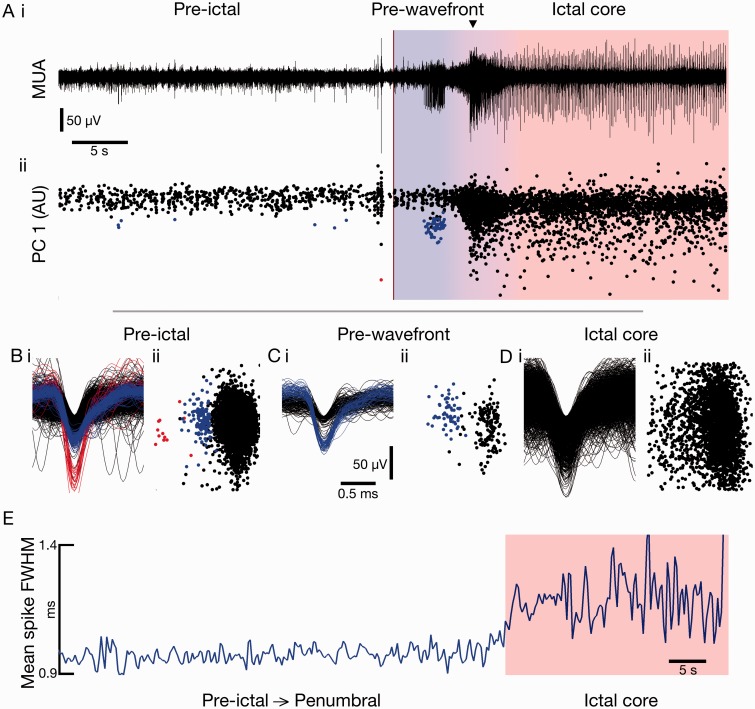
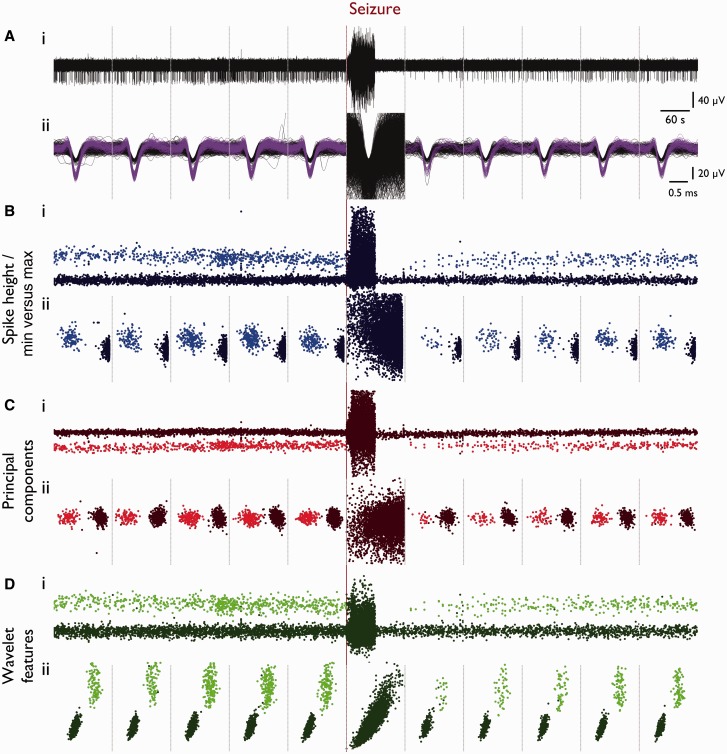
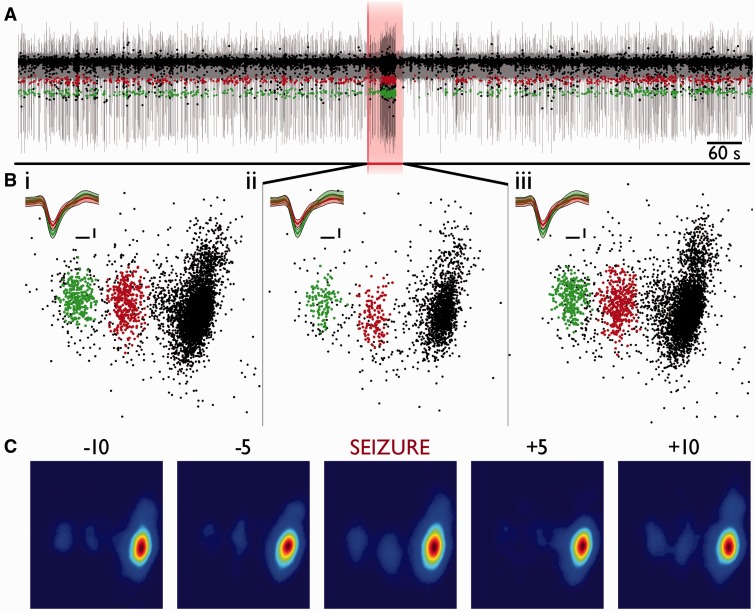
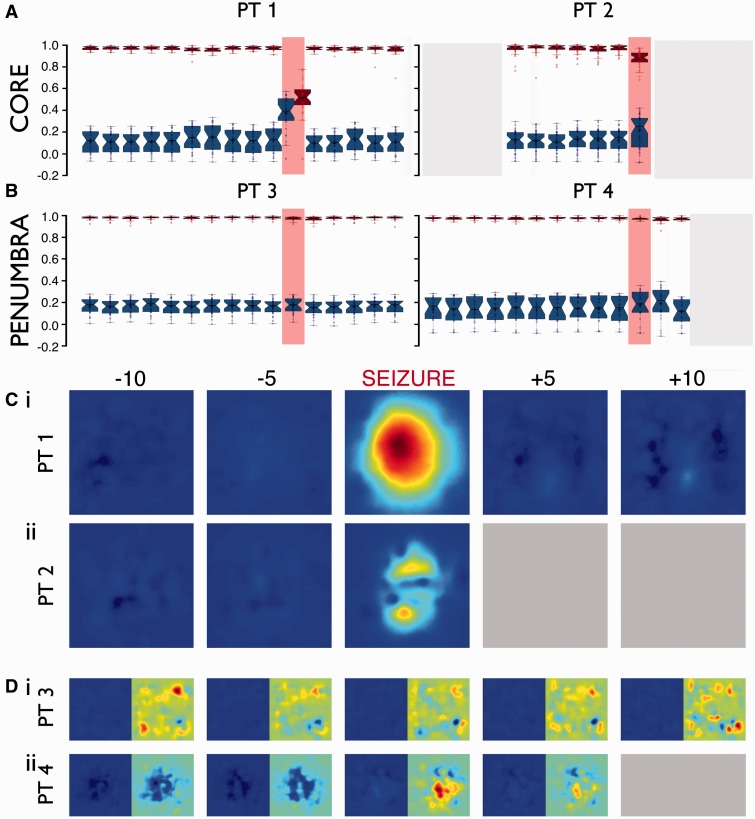
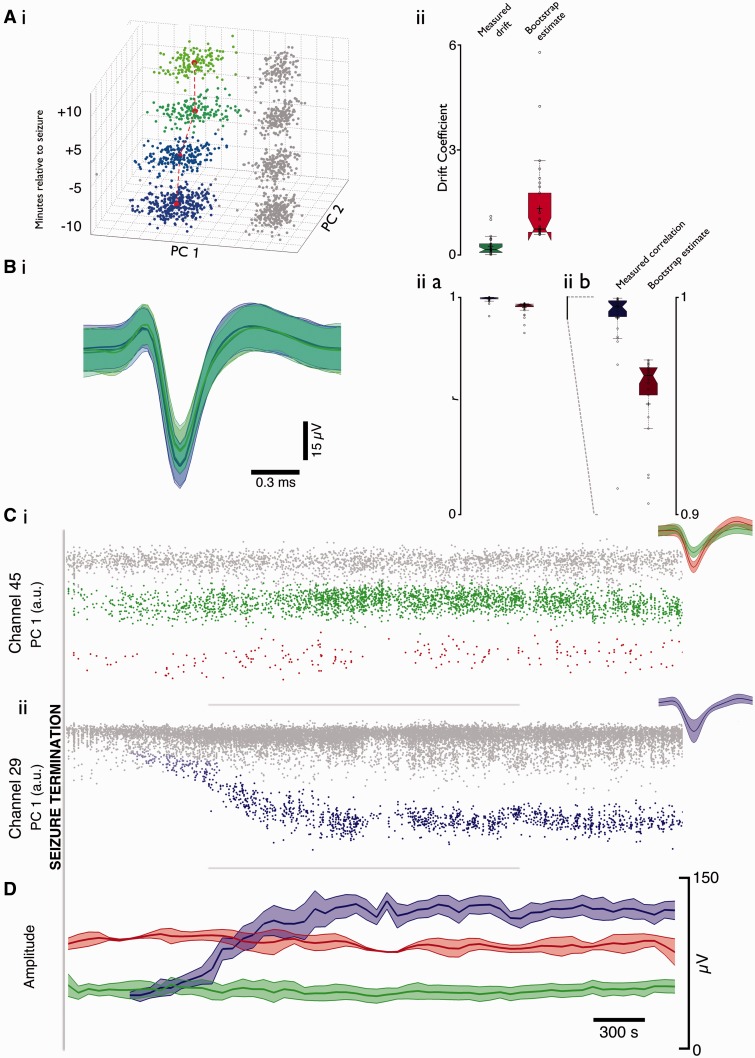
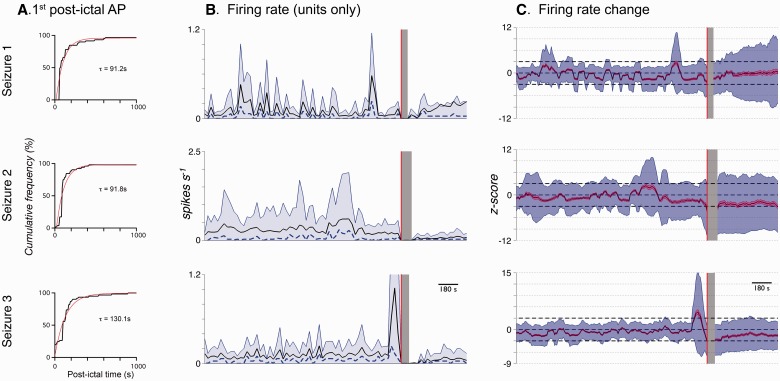
Spike-sorting algorithms have been used to identify the firing patterns of isolated neurons ('single units') from implanted electrode recordings in patients undergoing assessment for epilepsy surgery, but we do not know their potential for providing helpful clinical information. It is important therefore to characterize both the stability of these recordings and also their context. A critical consideration is where the units are located with respect to the focus of the pathology. Recent analyses of neuronal spiking activity, recorded over extended spatial areas using microelectrode arrays, have demonstrated the importance of considering seizure activity in terms of two distinct spatial territories: the ictal core and penumbral territories. The pathological information in these two areas, however, is likely to be very different. We investigated, therefore, whether units could be followed reliably over prolonged periods of times in these two areas, including during seizure epochs. We isolated unit recordings from several hundred neurons from four patients undergoing video-telemetry monitoring for surgical evaluation of focal neocortical epilepsies. Unit stability could last in excess of 40 h, and across multiple seizures. A key finding was that in the penumbra, spike stereotypy was maintained even during the seizure. There was a net tendency towards increased penumbral firing during the seizure, although only a minority of units (10-20%) showed significant changes over the baseline period, and notably, these also included neurons showing significant reductions in firing. In contrast, within the ictal core territories, regions characterized by intense hypersynchronous multi-unit firing, our spike sorting algorithms failed as the units were incorporated into the seizure activity. No spike sorting was possible from that moment until the end of the seizure, but recovery of the spike shape was rapid following seizure termination: some units reappeared within tens of seconds of the end of the seizure, and over 80% reappeared within 3 min (τrecov = 104 ± 22 s). The recovery of the mean firing rate was close to pre-ictal levels also within this time frame, suggesting that the more protracted post-ictal state cannot be explained by persistent cellular neurophysiological dysfunction in either the penumbral or the core territories. These studies lay the foundation for future investigations of how these recordings may inform clinical practice.See Kimchi and Cash (doi:10.1093/awv264) for a scientific commentary on this article.

Keywords: EEG; epilepsy; ictal core; ictal penumbra; spike sorting.


Figures

None
See Kimchi and Cash (doi:10.1093/awv264) for a scientific commentary on this article. In patients undergoing surgical evaluation of focal neocortical epilepsies, Merricks et al. perform the first single-unit recordings of neurons in the ictal core and contrast their activity patterns with those of the penumbra. Single-unit spiking recovers rapidly after seizure termination, suggesting a network rather than cellular cause of post-ictal dysfunction.
Figure 1
Figure 1
Stability of single unit features over 24 h in humans. (A–C) Typical features from three channels in Patient 1, from 3-min epochs every 6 h, over 24 h, during which time there occurred a seizure (between the 6- and 12-h time periods). Times represent time relative to seizure onset. For each channel we show (i) first principal component versus time; unit showing clean separation from the background noise of more distal units (grey), highlighted in colour (blue, red, green and pink). (ii) Left: Full epoch’s first versus second principal component, and right: mean waveform (± 2 SD) of all spikes in cluster. (iii) Every waveform from each epoch plotted contiguously (only the ‘green’ unit in C is depicted). Note evidence for stability of both a bursting cell, in A, and for a highly active cell, in B. While there is a drastic change in mean waveform over 24 h in B, the maintained distinct cluster in B(ii) without the presence of other well separated activity imply strongly that this is a cell showing drift relative to the electrode tip. (iv) Autocorrelograms from time points −5 and +7 h relative to seizure from the same cells as (iii) (light and dark, respectively), over ± 100 ms, using 5-ms bins. Note the maintained intrinsic firing properties within each cell, and different properties between cells.
Figure 2
Figure 2
Loss of unit-specific features during seizure in core, recruited territories. (A) Example trace from one channel in Patient 1 (recruited territory) for 10 min prior to seizure onset, to 10 min post-seizure termination. The first principal component values from detected spikes have been overlaid; the blue data points all represent spikes from a single, cleanly separated unit. Note the stability of the principal components up until seizure onset whereupon all discernable features are lost. The same unit as in the preceding 10 min can also be seen to make a recovery in the following 10 min, albeit with a much diminished firing rate. (B) First two principal components are plotted against each other. They show a clearly separable unit in blue and, inset, mean waveform (± 2 SD) from: (i) 10 min prior to seizure; (ii) during seizure (60 s total epoch); and (iii) 10 min following seizure termination. Note the maintained waveform and corresponding principal component values in iii relative to i, despite no evidence for the same unit during the seizure in ii. Both axes are maintained throughout, and principal components were calculated simultaneously. Waveform inset scale = 0.2 ms, 20 μV. (C) Kernel density estimate histograms (sigma = 5, 100 bins) of principal components 1 (abscissa) and 2 (ordinate), from 60-s epochs from 10 and 5 min prior to seizure onset, during the seizure, and 5 and 10 min post-seizure termination, normalized to the dimensions found in the 10 min prior epoch. Red denotes the highest probability of finding a spike, blue the lowest.
Figure 3
Figure 3
Maintained waveform during propagation prior to local ictal onset. Cortical regions that are later incorporated into the ictal core show maintained waveforms after seizure onset while they are still in the penumbra (prior to the wavefront reaching and incorporating that territory). [A(i)] Example MUA (300 to 3000 Hz) trace from Patient 2 and (ii) accompanying first principal component through time of detected spikes, from 30 s prior to global seizure onset (dark red line) until 30 s after. For the first 4.8 s after seizure onset the territory local to the electrode remains penumbral, prior to the wavefront reaching the region (blue shaded area), after which the territory becomes incorporated into the ictal core (red shaded area). Note the maintained spike height and first principal component while in the penumbra, and loss of specificity once incorporated into the ictal core. (B–D) (i) Waveforms and (ii) their first two principal components from the channel shown in A, from 5 min pre-ictal, the penumbral 4.8 s, and the ictal core, respectively. Note the maintained waveform and associated features of the blue unit during the penumbral period (C) followed by obscurement when incorporated into the ictal core (D). (E) Mean spike full-width at half-maximum (FWHM) of all single units from Patient 2, aligned in time to local incorporation into seizure (ictal core shown in red shaded area), showing that even when including spikes from the same principal component region despite a lack of defined clusters, the spike width within clusters increases at local onset, and not while in the penumbral region.
Figure 4
Figure 4
Loss of specificity in core territory in all cluster-able features. [A(i)] Example trace from one channel in Patient 1 (recruited territory) from 10 min prior to seizure onset until 12 min post-seizure onset, segmented into 2-min epochs (grey dotted lines, used throughout). (ii) All waveforms from each 2-min epoch shown in i, with background noise in black and single unit in purple. (B–D) Multiple cluster-able features, with single unit as lighter colour throughout. [B(i)] Spike height plotted versus spike time and (ii) spike minimum versus maximum for each epoch. [C(i)] First principal component versus time and (ii) first versus second principal component for each epoch. [D(i)] First wavelet feature versus time; and (ii) first versus second wavelet feature for each epoch. Note loss of features throughout during seizure epoch.
Figure 5
Figure 5
Maintained waveform and features during seizure in penumbra. Same format as for Fig. 2, showing the preserved electrophysiological signatures recorded within the penumbral, non-recruited territory [Patient 3 (shown in Figure 7g, Seizure 1 in Schevon et al. 2012)]. The large amplitude, low frequency signals indicative of seizure activity, corresponded approximately to the period of increased unit activity. Note that the pink shaded territory indicates the sampling period for B(ii) [60 s; the same duration as in Fig. 2B(ii)], but that in this figure it also includes short pre- and post-ictal periods. (A) The 300 Hz to 3 kHz bandpass filtered trace from a single electrode, with two well separated units indicated in green and red. (B) The distributions of the first two principal components for these units, together with many other units which are shown in black. All scales are maintained through, inset scale = 0.2 ms, 20 μV. (C) The Kernel density estimate histograms for the distributions shown in B. Note how the two units are clearly separable during each time point, and that the principal components (and Kernel density estimates) are stable, even though there is a marked rise in firing frequency during the seizure relative to periods both preceding and following the seizure. The subdural EEG from this seizure is shown in Schevon et al. (; Figure 7g, Seizure 1).
Figure 6
Figure 6
Loss of separable features from single units is characteristic of core recordings, not present in penumbra. (A and B) Cross correlations of Kernel density estimate histograms as shown in Figs 3C and 5C, for 60-s epochs from 10 min prior to seizure onset to 5 min post termination in all four patients [core in A: Patient 1 (30 electrodes), Patient 2 (45); penumbra in B: Patient 3 (30), Patient 4 (22)]. Red boxplots show intra-electrode cross correlation coefficients relative to the Kernel density estimate histogram 30 min prior to onset. Blue boxplots show interelectrode average cross correlation coefficients relative to each other electrode during that epoch. The strong correlations over time within each electrode during baseline periods compared to the weak correlations between electrodes show that these features are characteristic of activity specific to each electrode. During the seizure, in core recordings (A), the intra-electrode correlation is lost due to breakdown of features and the similarity between electrodes is raised due to similar loss of specificity, as seen in Fig. 3B(ii), in all electrodes. Recordings from penumbral territories (B) show no such alteration during seizure with continued specificity within electrodes. Strong correlations within electrode plausibly arise due to well-maintained background noise of more distal cells’ spikes. Grey areas denote missing data. (C and D) The mean results over all electrodes of a subtractive method whereby the first Kernel density estimate histogram was subtracted from the others. The background noise of more distal cells’ spikes is maintained thereby removing it during subtraction, leaving only alterations in unit specific activity. Resultant mean subtractions from core patients are shown in C, colour normalized to maximal value in Patient 1, showing a larger alteration during seizure relative to other time points. Penumbral recordings show no such alteration during seizure as shown in D, with values normalized to the colour axis in C on the left, and normalized within patient on the right.
Figure 7
Figure 7
Consistent cells evident both pre and post seizure in core recordings, with varied patterns of recovery. The ability to record from the same cells after a seizure as beforehand discounts movement of the MEA, due to either patient movement or vasculature response, as the cause for loss of feature specificity during seizure. [A(i)] Example drift of cluster centres of a well isolated unit either side of a seizure (blue to green shows −10, −5, +5, +10 min relative to seizure onset, centre of cluster marked in red). (ii) Drift coefficient of mean post-seizure centre relative to mean pre-seizure centre (calculated in 3D space; 2D shown in i), from each cleanly separated unit with activity in both time points. Coefficient was calculated as the distance moved, divided by the prior time point’s distance from zero in principal component space. Left (green) shows actual drift coefficient; right (red) shows drift coefficient as determined by comparing each unit pre to a random different unit post 10 000 times. [B(i)] Mean waveforms (± 2 SD) from time points shown in A(i), colours maintained. [B(ii)] Cross correlation coefficients of mean waveform prior to seizure against mean waveform post seizure. (a) Left, resultant correlation coefficients, and right, correlation coefficients from comparing each unit prior to a random different unit post, 10 000 times. (b) Spikes were detected with a negative threshold, so all mean waveforms would be anticipated to show a highly correlated shape. Expanded view of (ii)a shows significant difference between waves found pre and post relative to arbitrarily compared waves. (C) First principal component over time for two example channels over a 2-h post-ictal period from Patient 1. Well isolated units are highlighted in green and red in channel 45 with unclassified units in grey. Note the immediate return of waveform after the seizure of both units. Channel 29 shows the simultaneous return of a unit with a drift in amplitude after the seizure, fading from grey to blue once distinct from the background activity. Insets show mean waveforms ± 2 SD for these clusters. (D) Mean (± 2 SD) amplitude for the three units shown in C, over the same time period. Note the stability in the red and green units at the same time as a sizeable alteration in amplitude of the blue unit.
Figure 8
Figure 8
Post-ictal recovery of population firing properties. Firing properties for Seizures 1 to 3 in Patient 1 (recruited territory). Red line denotes seizure onset and grey area shows the seizure, which was blanked out for spike sorting purposes, used throughout. (A) Cumulative frequency plots for the time of first post-ictal action potential within clusters (black) and exponential fits to each (red). (B) Mean firing rate (black), median firing rate (dashed blue) and 90th percentile of firing rate (shaded blue region). (C) Z-scored changes in firing rate from each cell calculated in 60-s bins every 10 s, relative to the cell’s firing rate during the pre-ictal 30 min. Zero therefore means no change in firing rate, with positive values being an increase, and negative values a decrease. Dashed black lines at ± 3 denote significance levels used for changes in firing rate (Supplementary Fig. 3). Mean alteration is shown in black, mean ± SEM. is shaded red, and mean ± 2 SD is shaded blue.

Comment in

References

    1. Ayala GF, Dichter M, Gumnit RJ, Matsumoto H, Spencer WA. Genesis of epileptic interictal spikes. New knowledge of cortical feedback systems suggests a neurophysiological explanation of brief paroxysms. Brain Res 1973; 52: 1–17. - PubMed
    1. Babb TL, Crandall PH. Epileptogenesis of human limbic neurons in psychomotor epileptics. Electroencephalogr Clin Neurophysiol 1976; 40: 225–43. - PubMed
    1. Babb TL, Wilson CL, Isokawa-Akesson M. Firing patterns of human limbic neurons during stereoencephalography (SEEG) and clinical temporal lobe seizures. Electroencephalogr Clin Neurophysiol 1987; 66: 467–82. - PubMed
    1. Barrese JC, Rao N, Paroo K, Triebwasser C, Vargas-Irwin C, Franquemont L, et al. Failure mode analysis of silicon-based intracortical microelectrode arrays in non-human primates. J Neural Eng 2013; 10: 066014. - PMC - PubMed
    1. Bower MR, Buckmaster PS. Changes in granule cell firing rates precede locally recorded spontaneous seizures by minutes in an animal model of temporal lobe epilepsy. J Neurophysiol 2008; 99: 2431–42. - PubMed

Publication types

LinkOut - more resources