. 2015 Jul 21;43(1):41-51.
doi: 10.1016/j.immuni.2015.06.015. Epub 2015 Jul 14.

A Conserved Histidine in the RNA Sensor RIG-I Controls Immune Tolerance to N1-2'O-Methylated Self RNA

Affiliations

A Conserved Histidine in the RNA Sensor RIG-I Controls Immune Tolerance to N1-2'O-Methylated Self RNA

Christine Schuberth-Wagner et al. Immunity. .

Abstract

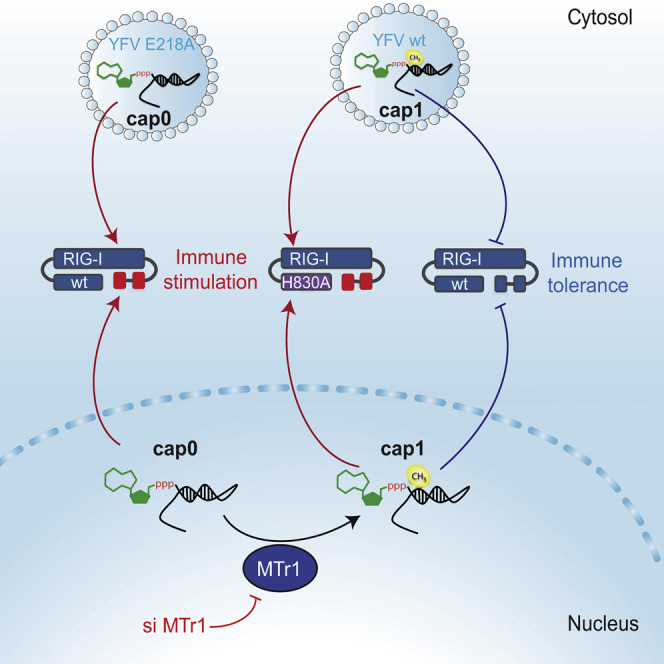
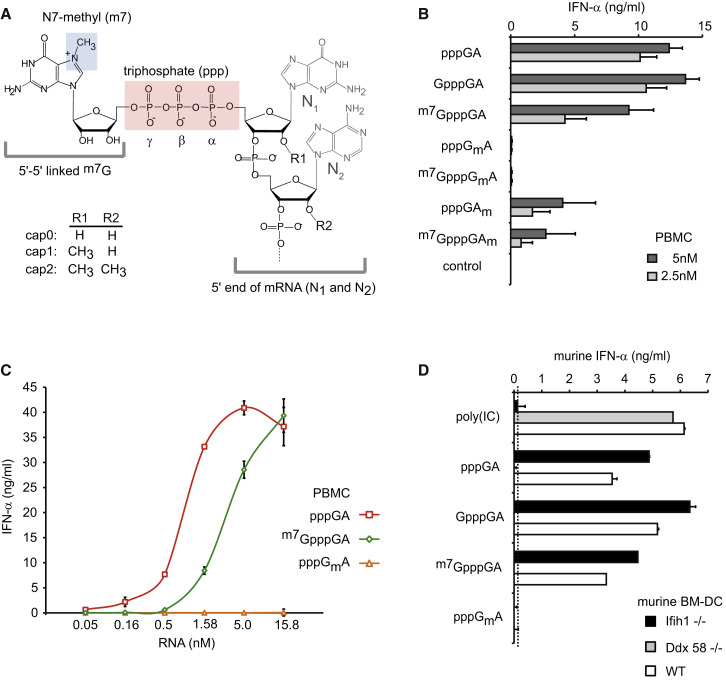
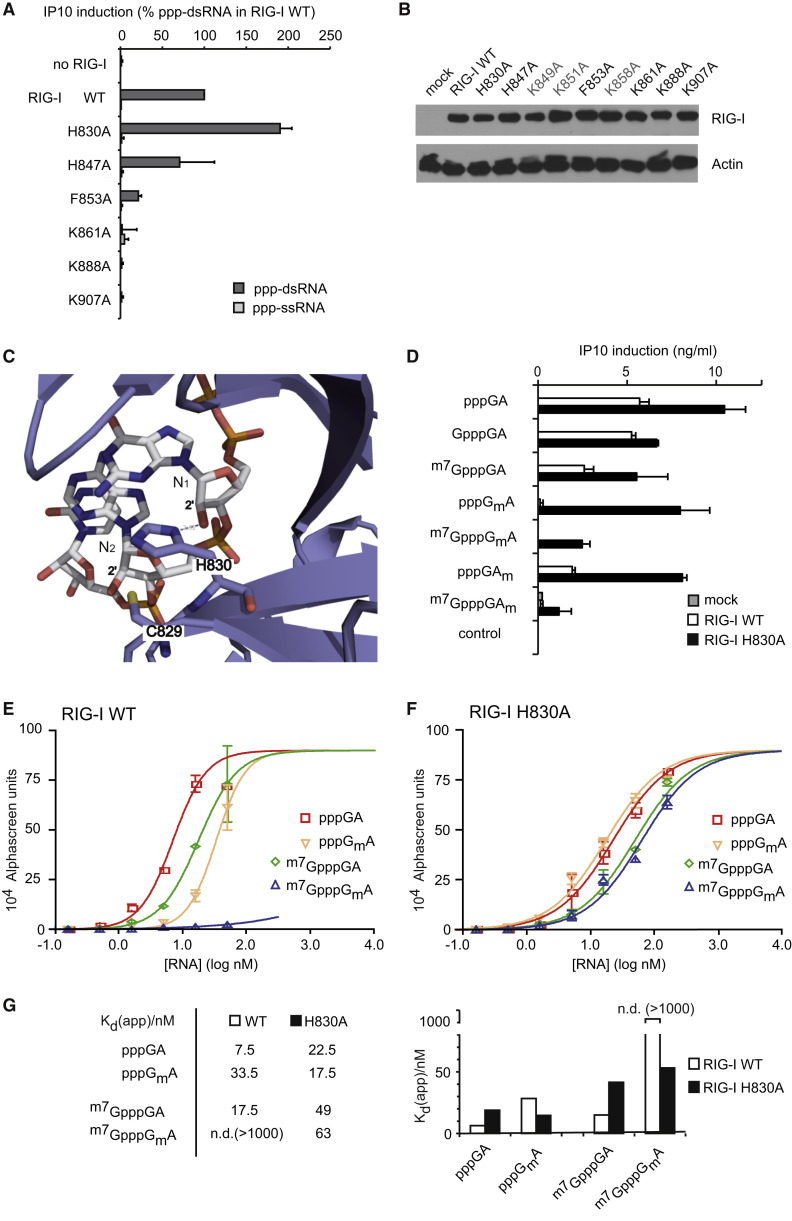
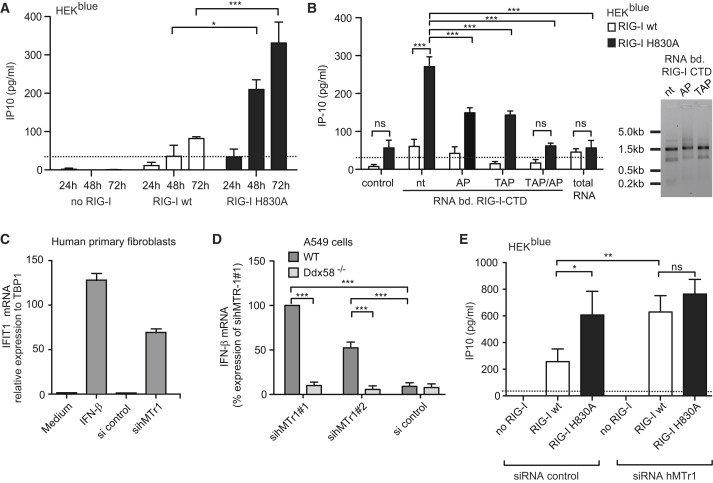
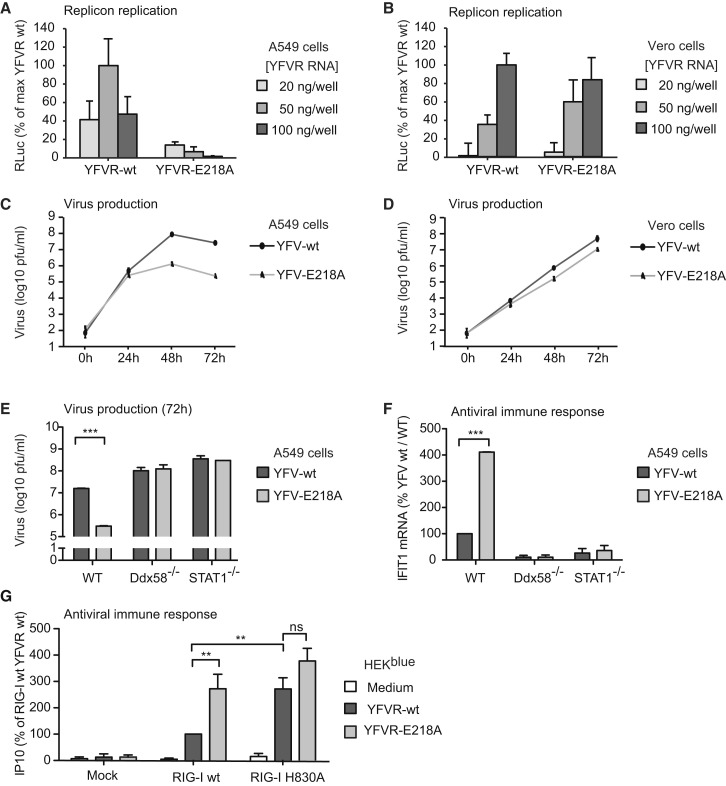
The cytosolic helicase retinoic acid-inducible gene-I (RIG-I) initiates immune responses to most RNA viruses by detecting viral 5'-triphosphorylated RNA (pppRNA). Although endogenous mRNA is also 5'-triphosphorylated, backbone modifications and the 5'-ppp-linked methylguanosine ((m7)G) cap prevent immunorecognition. Here we show that the methylation status of endogenous capped mRNA at the 5'-terminal nucleotide (N1) was crucial to prevent RIG-I activation. Moreover, we identified a single conserved amino acid (H830) in the RIG-I RNA binding pocket as the mediator of steric exclusion of N1-2'O-methylated RNA. H830A alteration (RIG-I(H830A)) restored binding of N1-2'O-methylated pppRNA. Consequently, endogenous mRNA activated the RIG-I(H830A) mutant but not wild-type RIG-I. Similarly, knockdown of the endogenous N1-2'O-methyltransferase led to considerable RIG-I stimulation in the absence of exogenous stimuli. Studies involving yellow-fever-virus-encoded 2'O-methyltransferase and RIG-I(H830A) revealed that viruses exploit this mechanism to escape RIG-I. Our data reveal a new role for cap N1-2'O-methylation in RIG-I tolerance of self-RNA.

Keywords: 2′O-methyl; 5′-triphosphate RNA; MTr1; RIG-I; cap; immune recognition of RNA; innate immune tolerance mechanism; mRNA; virus.


Figures

None
Graphical abstract
Figure 1
Figure 1
2′O-Methylation at N1 Position of RNA Critically Determines the Abolition of RIG-I Activation (A) The chemical structure of cap structures as contained in eukaryotes’ mRNA is presented (m7GpppNmNm). Important structural features are labeled. The cap2 structure, which occurs only in higher eukaryotes’ mRNA, consists of a G, 5′-5′ triphosphate linked to N1, with methylation at N7 of the G residue. N1 and N2 are 2′O-methylated. (B and C) Chloroquine-treated human PBMCs were stimulated with the indicated synthetic RNA oligonucleotides (see also Table S1 and Figure S2) at concentrations of 2.5 nM and 5 nM (B) or a dose titration was performed (C). Before stimulation, RNA oligonucleotides were hybridized with the complementary RNA (AsGA) to blunt-ended double-stranded RNA. IFN-α production was analyzed 20 hr after stimulation. Data from four donors are depicted as mean values + SEM. (D) Murine bone-marrow-derived dendritic cells from MDA5- or RIG-I-deficient or wild-type mice were stimulated with indicated RNA ligands (50 nM) and murine IFN-α was determined by ELISA (linear range limit: 80 pg/ml) 20 hr after transfection. One representative experiment out of two is shown. Error bars indicate SD.
Figure 2
Figure 2
Immune Tolerance of 2′O-Methylated cap1 Structures Is Mediated by H830 in the ppp-dsRNA Binding Cleft of RIG-I (A) Wild-type or indicated full-length human RIG-I mutants (see also Figure S1) were overexpressed for 12 hr in HEK293blue cells and stimulated with 5 nM synthetic 5′-ppp-ss or dsRNA. IP10 production was analyzed 20 hr after stimulation. Data from three independent experiments are depicted as mean values + SEM. (B) Immunoblot of RIG-I(WT) and indicated RIG-I mutants overexpressed in HEK293blue cells for 48 hr. (C) Interaction of H830 with 2′OH of N1 as revealed from crystal structure (Wang et al., 2010) of CTD-ppp-dsRNA complex is displayed. (D) RIG-I(WT) or RIG-I(H830A) was overexpressed in HEK293blue cells and stimulated with indicated synthetic ppp-dsRNA ligands (5 nM). IP10 production was analyzed 20 hr after stimulation. Data from three independent experiments are depicted as mean values ± SEM, normalized on RIG-I(WT)+pppGA (100% = 9 ng/ml IP10 in average). (E–G) Homogenous interaction assay (AlphaScreen) of purified RIG-I(WT) or RIG-I(H830A) protein with indicated synthetic ligands. Protein concentrations were kept constant, and ligand concentrations were titrated. Titration plots (E and F) and apparent dissociation constants (Kd in G) are shown. AlphaScreen units are proportional to RIG-I-ligand complex concentrations. One representative experiment of two is shown. Error bars indicate SD. Purity of RIG-I(WT) and RIG-I(H830A) proteins are shown in Figure S2F.
Figure 3
Figure 3
H830 and cap1 2′O-Methylation of RNA Prevent Recognition of Endogenous RNAs (A) RIG-I(WT) and RIG-I(H830A) were expressed in HEK293blue cells in the absence of exogenous RIG-I stimuli and IP10 was monitored at indicated times (24, 48, 72 hr) after transfection. Data from three independent experiments with technical duplicates are depicted as mean values + SEM. (B) Flag-tagged RIG-I-CTD was overexpressed in HEK293blue cells. Endogenous RNA binding to immune-precipitated RIG-I-CTD was extracted and used for stimulation of RIG-I(WT)- and RIG-I(H830A)-expressing HEK293blue cells. Before stimulation, RNAs were treated with tobacco acid pyrophosphatase (TAP) or alkaline phosphatase (AP) or left untreated (nt). IP10 induction values 20 hr after stimulation from three independent experiments with technical duplicates are depicted as mean values + SEM. TAP hydrolyzes and inactivates free and capped, AP-only free triphosphate (ppp). Right panel: Ethidium bromide-stained agarose gel of RIG-I(WT)-CTD-bound RNAs. Untreated (nt), treated with TAP, or AP. (C) Fibroblasts isolated from human nasal conchas were transfected with control siRNA (control siRNA pool) or siRNA against hMTr1 (siRNA hMTr1 pool) and harvested after 70 hr. RNA was isolated and IFN-β mRNA induction relative to TBP-1 mRNA expression was determined by real-time PCR. One representative of two experiments in triplicates is shown. Error bars indicate SD. (D) IFN-β mRNA induction by siRNAs against hMTr1 in wild-type (WT) or RIG-I-deficient (Ddx58−/−) A549 cells were treated with indicated siRNAs, primed with 1,000 U/ml IFN-α, and assessed for IFN-β mRNA induction by qPCR 72 hr after siRNA transfection. Data from three independent experiments with technical duplicates are depicted as mean values + SEM. (E) IP10 induction in RIG-I(WT)- or RIG-I(H830A)-expressing HEK293blue cells 72 hr after treatment with control siRNA (control siRNA pool) or siRNA against hMTr1 (siRNA hMTr1 pool); linear range limit, 31 pg/ml. Data from three independent experiments with technical duplicates are depicted as mean values ± SEM (B, D, E). For statistics, two-way ANOVA and Bonferroni post-test was applied: p < 0.05, ∗∗p < 0.01, ∗∗∗p < 0.001. Knockdown efficiencies were determined by immunoblot (Figure S3A) of hMTr1 and real-time PCR (Figures S3B and S3C).
Figure 4
Figure 4
YFV cap1 2′O-Methyltransferase Prevents Immune Recognition (A and B) Immune-competent A549 cells (A) or type I IFN gene-deficient Vero cells (B) were transfected with YFV replicon (YFVR) RNA or YFVR-E218A RNA-deficient for viral cap1 2′O-methyltransferase activity (see also Figure S4A). Replication was monitored by replicon-derived luciferase activity. Average of two experiments in technical duplicates is shown. Error bars indicate SD. (C and D) A549 cells (C) or Vero cells (D) were infected with whole yellow fever virus particles YFV-WT or YFV-E218A (MOI 0.01). Virus production was quantified by plaque assay in BHK cells 24, 48, or 72 hr after infection. One representative of two experiments in technical duplicates is shown. Error bars indicate range. (E) Wild-type, RIG-I-deficient (Ddx58−/−), or STAT1-deficient A549 cells were infected with YFV-WT or YFV-E218A (MOI 0.01) and virus production was quantified as in (C) 72 hr after infection. (F) Wild-type, RIG-I-deficient (Ddx58−/−), or STAT1-deficient A549 cells were infected with YFV-WT or YFV-E218A (MOI 1) and IFIT1 mRNA was measured 8 hr after infection by RT-PCR. (E and F) Average values of two experiments in technical duplicates are shown; error bars indicate SEM. (G) Untransfected (no RIG-I, mock), RIG-I(WT)-, or RIG-I(H830A)-expressing HEK293blue cells were transfected with YFVR-WT or YFVR(218) replicon RNA. The mean values of four experiments in technical duplicates is shown, error bars: SEM 100% = 895 ng/ml IP10 in average, linear range limit: 31 pg/ml. (E–G) For statistics, two-way ANOVA and Bonferroni post-test were applied: ∗∗p < 0.01, ∗∗∗p < 0.001.

Comment in

References

    1. Abbas Y.M., Pichlmair A., Górna M.W., Superti-Furga G., Nagar B. Structural basis for viral 5′-PPP-RNA recognition by human IFIT proteins. Nature. 2013;494:60–64. - PMC - PubMed
    1. Banerjee A.K. 5′-terminal cap structure in eucaryotic messenger ribonucleic acids. Microbiol. Rev. 1980;44:175–205. - PMC - PubMed
    1. Bélanger F., Stepinski J., Darzynkiewicz E., Pelletier J. Characterization of hMTr1, a human Cap1 2′-O-ribose methyltransferase. J. Biol. Chem. 2010;285:33037–33044. - PMC - PubMed
    1. Bray M. Highly pathogenic RNA viral infections: challenges for antiviral research. Antiviral Res. 2008;78:1–8. - PubMed
    1. Brownell J., Bruckner J., Wagoner J., Thomas E., Loo Y.M., Gale M., Jr., Liang T.J., Polyak S.J. Direct, interferon-independent activation of the CXCL10 promoter by NF-κB and interferon regulatory factor 3 during hepatitis C virus infection. J. Virol. 2014;88:1582–1590. - PMC - PubMed

Publication types

MeSH terms