. 2015 Jul 18;16(1):531.
doi: 10.1186/s12864-015-1697-8.

Genome sequence and comparative analysis of a putative entomopathogenic Serratia isolated from Caenorhabditis briggsae

Affiliations

Genome sequence and comparative analysis of a putative entomopathogenic Serratia isolated from Caenorhabditis briggsae

Feseha Abebe-Akele et al. BMC Genomics. .

Abstract

Background: Entomopathogenic associations between nematodes in the genera Steinernema and Heterorhabdus with their cognate bacteria from the bacterial genera Xenorhabdus and Photorhabdus, respectively, are extensively studied for their potential as biological control agents against invasive insect species. These two highly coevolved associations were results of convergent evolution. Given the natural abundance of bacteria, nematodes and insects, it is surprising that only these two associations with no intermediate forms are widely studied in the entomopathogenic context. Discovering analogous systems involving novel bacterial and nematode species would shed light on the evolutionary processes involved in the transition from free living organisms to obligatory partners in entomopathogenicity.

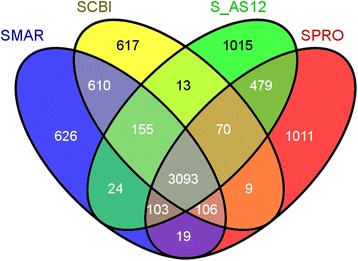
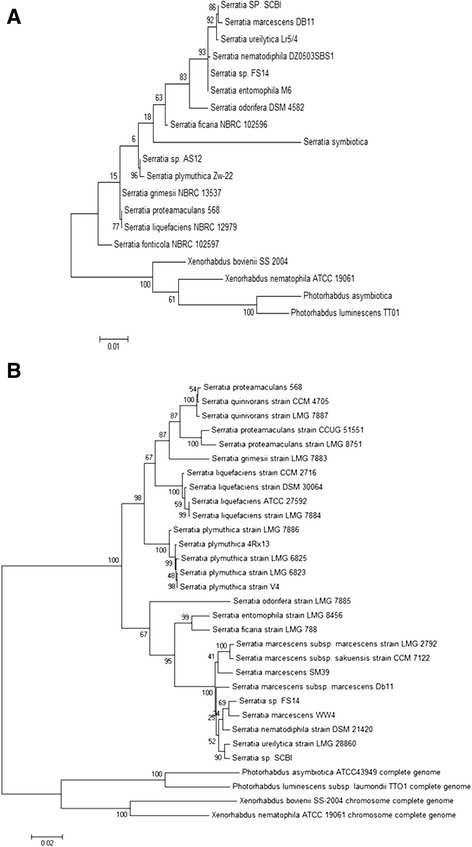
Results: We report the complete genome sequence of a new member of the enterobacterial genus Serratia that forms a putative entomopathogenic complex with Caenorhabditis briggsae. Analysis of the 5.04 MB chromosomal genome predicts 4599 protein coding genes, seven sets of ribosomal RNA genes, 84 tRNA genes and a 64.8 KB plasmid encoding 74 genes. Comparative genomic analysis with three of the previously sequenced Serratia species, S. marcescens DB11 and S. proteamaculans 568, and Serratia sp. AS12, revealed that these four representatives of the genus share a core set of ~3100 genes and extensive structural conservation. The newly identified species shares a more recent common ancestor with S. marcescens with 99% sequence identity in rDNA sequence and orthology across 85.6% of predicted genes. Of the 39 genes/operons implicated in the virulence, symbiosis, recolonization, immune evasion and bioconversion, 21 (53.8%) were present in Serratia while 33 (84.6%) and 35 (89%) were present in Xenorhabdus and Photorhabdus EPN bacteria respectively.

Conclusion: The majority of unique sequences in Serratia sp. SCBI (South African Caenorhabditis briggsae Isolate) are found in ~29 genomic islands of 5 to 65 genes and are enriched in putative functions that are biologically relevant to an entomopathogenic lifestyle, including non-ribosomal peptide synthetases, bacteriocins, fimbrial biogenesis, ushering proteins, toxins, secondary metabolite secretion and multiple drug resistance/efflux systems. By revealing the early stages of adaptation to this lifestyle, the Serratia sp. SCBI genome underscores the fact that in EPN formation the composite end result - killing, bioconversion, cadaver protection and recolonization- can be achieved by dissimilar mechanisms. This genome sequence will enable further study of the evolution of entomopathogenic nematode-bacteria complexes.


Figures

Fig. 1
Fig. 1
Circular representation of the Serratia sp. SCBI genome. Circular representation of Genomic features in Serratia sp. SCBI. From outer to innermost: First and fourth circles, genes in the plus and minus strands, respectively, by COG category (COG category color Scheme A, side panel); second circle, genes shared with other Serratia and EPN species (see color scheme B); third circle, genomic Islands (GIs) (Color Scheme C); fifth circle, GC content, sixth, innermost, circle, GC skew (Color Scheme A Side panel)
Fig. 2
Fig. 2
Venn diagram of shared and unique genes found in four Serratia genomes. The unique and shared genome among the compared genomes was determined by a dual cutoff of 30 % or greater amino acid identity and sequence length coverage of at least 70 %. Analysis was done using the MAUVE genome alignment tool [42]. SCBI: Serratia sp. SCBI; SMAR: S. marcescensDB11; SPRO: S. proteamaculans568, SAS12, Serratia sp. AS12
Fig. 3
Fig. 3
Evolutionary relationships of Serratia and representative bacteria from the entomopathogenic genera Photorhabdus and Xenorhabdus. Evolutionary relationships of Serratia and representative bacteria from the entomopathogenic genera Photorhabdus and Xenorhabdus. a Phylogenetic relationships inferred from the alignment of 1500 bp of 16S rDNA using the Maximum Likelihood [90]; b Phylogenetic relationships inferred from the alignment of 2623 bp of concatenated DNA from four housekeeping genes: atpD (634 bp), gyrB (742 bp), ifnB (613 bp) and rpoB (634 bp) using the Maximum Likelihood [90]. Numbers on internal branches are the results of Bootstrap analysis where the test was done with 1000 replicates [43]. Where applicable the trees are drawn to scale, with branch lengths in the same units as those of the evolutionary distances used to infer the phylogenetic tree. Evolutionary analyses were conducted in MEGA6 [91, 92]
Fig. 4
Fig. 4
Genomic alignment of the four compared Serratia spp. Alignment statistics were generated and rendered by MAUVE progressive alignment software [35, 36]. SMAR: S. marcescens DB11, SCBI: Serratia sp. SCBI, and SPRO: S. proteamaculans586, SAS12: Serratia sp. AS12. Color schemes represent blocks of contiguous genes interrupted by colorless patches where the genomes differ from each other significantly and identified as GIs are located
Fig. 5
Fig. 5
Relative COG category abundance in the core proteome in comparison with unique proteins in Serratia. The relative abundance of COG categories between the core and unique gene pools was calculated as follows: the number of proteins in each COG category was determined and the unique pools normalized to their respective total predicted protein numbers. Then the percentage of each COG category in the core proteome was subtracted from the corresponding COG percentage in the unique category and the difference plotted. COG functional categories descriptions are: [A] RNA processing and modification; [B] Chromatin structure and dynamics; [C] Energy production and conversion; [D] Cell cycle control and mitosis; [E] Amino acid metabolism and transport; [F] Nucleotide metabolism and transport; [G] Carbohydrate metabolism and transport; [H] Coenzyme metabolism; [I] Lipid metabolism; [J] Translation; [K] Transcription; [L] Replication and repair; [M] Cell wall/membrane/envelope biogenesis; [N] Cell motility; [O] Post-translational modification] protein turnover] chaperone functions; [P] Inorganic ion transport and metabolism; [Q] Secondary metabolites biosynthesis, transport and catabolism; [T] Signal transduction; [U] Intracellular trafficking and secretion; [R] General functional prediction only ; [S] Function unknown; [V] Defense mechanisms. [X] No cog category

References

    1. Abebe E, Akele FA, Morrison J, Cooper V, Thomas WK. An insect pathogenic symbiosis between a Caenorhabditis and Serratia. Virulence. 2011;2(2):158–161. doi: 10.4161/viru.2.2.15337. - DOI - PMC - PubMed
    1. Abebe E, Jumba M, Bonner K, Gray V, Morris K, Thomas WK. An entomopathogenic Caenorhabditis briggsae. J Exp Biol. 2010;213(18):3223–3229. doi: 10.1242/jeb.043109. - DOI - PubMed
    1. Aeschlimann JR. The role of multidrug efflux pumps in the antibiotic resistance of Pseudomonas aeruginosa and other gram-negative bacteria - Insights from the society of infectious diseases pharmacists. Pharmacotherapy. 2003;23(7):916–924. doi: 10.1592/phco.23.7.916.32722. - DOI - PubMed
    1. Alberti L, Harshey RM. Differentiation of Serratia-Marcescens 274 into Swimmer and Swarmer Cells. J Bacteriol. 1990;172(8):4322–4328. - PMC - PubMed
    1. Allen AE, CL Dupont, M Obornik, A Horak, A Nunes-Nesi, JP McCrow, et al. Evolution and metabolic significance of the urea cycle in photosynthetic diatoms. Nature. 2011;473(7346):203−+. - PubMed

Publication types

Associated data

LinkOut - more resources