Review
. 2015 Nov 11:1626:146-64.
doi: 10.1016/j.brainres.2015.06.038. Epub 2015 Jul 14.

Evidence against attentional state modulating scalp-recorded auditory brainstem steady-state responses

Affiliations
Review

Evidence against attentional state modulating scalp-recorded auditory brainstem steady-state responses

Leonard Varghese et al. Brain Res. .

Abstract

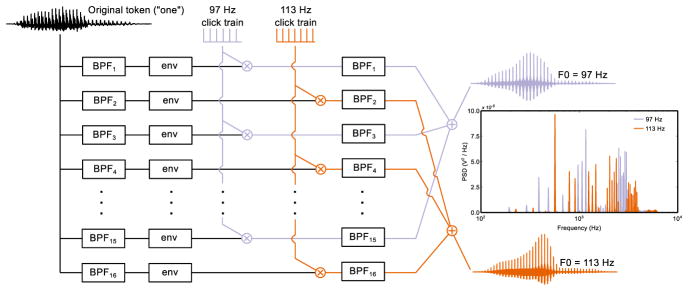
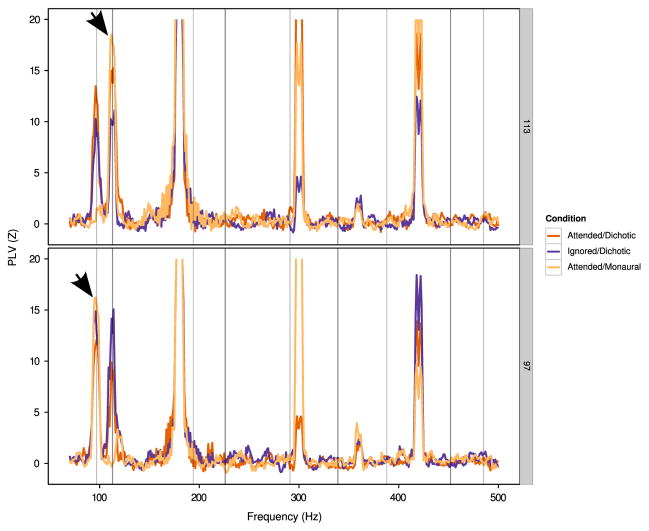
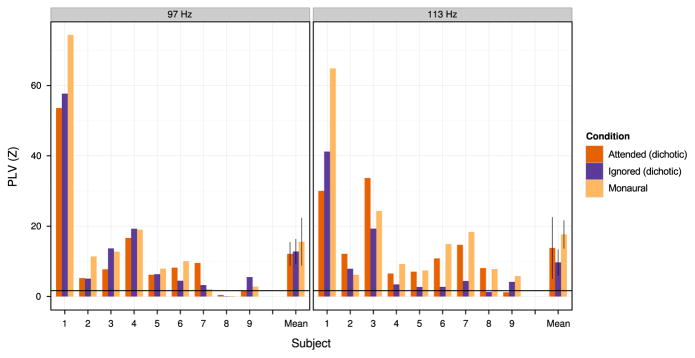
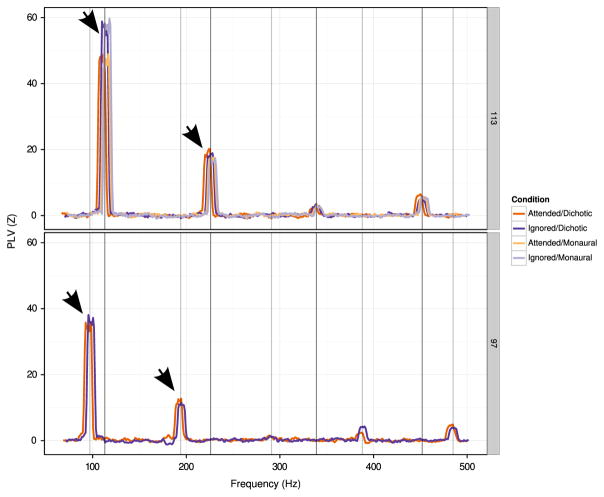
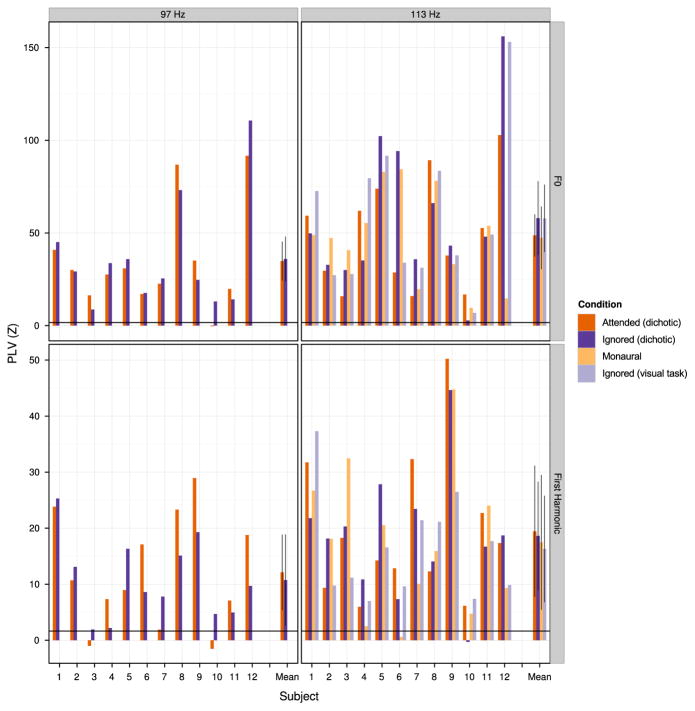
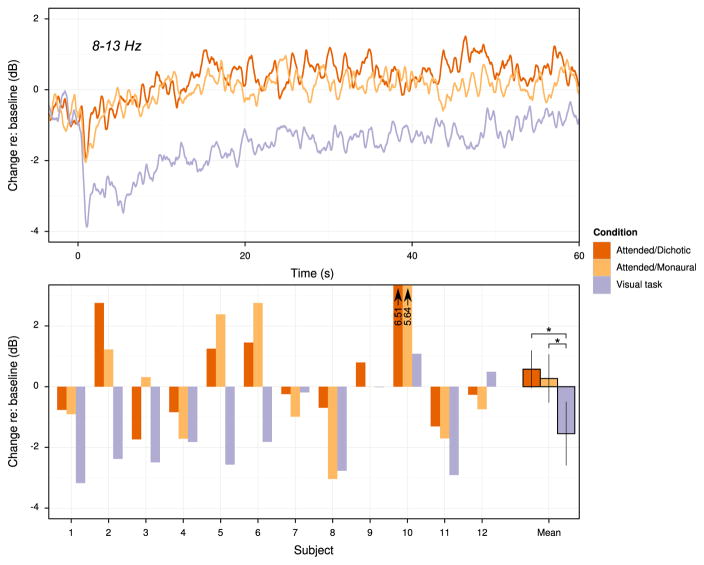
Auditory brainstem responses (ABRs) and their steady-state counterpart (subcortical steady-state responses, SSSRs) are generally thought to be insensitive to cognitive demands. However, a handful of studies report that SSSRs are modulated depending on the subject׳s focus of attention, either towards or away from an auditory stimulus. Here, we explored whether attentional focus affects the envelope-following response (EFR), which is a particular kind of SSSR, and if so, whether the effects are specific to which sound elements in a sound mixture a subject is attending (selective auditory attentional modulation), specific to attended sensory input (inter-modal attentional modulation), or insensitive to attentional focus. We compared the strength of EFR-stimulus phase locking in human listeners under various tasks: listening to a monaural stimulus, selectively attending to a particular ear during dichotic stimulus presentation, and attending to visual stimuli while ignoring dichotic auditory inputs. We observed no systematic changes in the EFR across experimental manipulations, even though cortical EEG revealed attention-related modulations of alpha activity during the task. We conclude that attentional effects, if any, on human subcortical representation of sounds cannot be observed robustly using EFRs. This article is part of a Special Issue entitled SI: Prediction and Attention.

Keywords: Attention; Auditory processing; Envelope-following response; FFR; Frequency-following response.


Figures

Fig. 1
Fig. 1
Example of vocoding procedure for the speech token “one”. The original natural speech token was filtered into 16 frequency band using 1/3-octave-wide filters. The filter output from odd-numbered bands was half-wave rectified and low-pass filtered, multiplied with a click train at 97 Hz, and filtered once more using the same bandpass filter. The output from this final stage was summed to obtain the final stimulus. Construction of the 113 Hz stimulus was similar, but used even numbered bands and a click train at 113 Hz. The vocoding procedure resulted in speech streams with a fundamental frequency of 97 Hz or 113 Hz and with minimally overlapping power spectral density functions (inset, right). On each dichotic experimental trial, a digit stream with one of the two carrier frequencies was sent to one ear, and another digit stream with the other carrier frequency was presented to the other ear.
Fig. 2
Fig. 2
Average PLV z-score as a function of frequency in Experiment 1. Due to the high z-scores at odd multiples of 60 Hz (20>z>40; see text for explanation), the y-axes are truncated to the range of interest around the stimulus fundamental frequency values (see text). Hz Top row: PLV (z-score) as a function of frequency for 113 Hz stimuli. Bottom: PLV (z-score) as a function of frequency for 97 Hz stimuli. Integer multiples of 97 Hz and 113 Hz are indicated by vertical lines. Arrows represent peaks for which individual subject data is shown in Fig. 3. The opposite frequency peak (i.e., the peak at 97 Hz in the top plot and the peak at 113 Hz in the bottom plot) arise from the lack of jitter in digit onset timings; such peaks were not present in Experiment 2 (see Fig. 4 and text for details).
Fig. 3
Fig. 3
PLV z-scores at the fundamental frequency of each stimulus shown for individual subjects in Experiment 1. Left column: Data for epochs corresponding to 97 Hz stimulus onsets (PLV z-score at 97 Hz). Right column: data for epochs corresponding to 113 Hz stimulus onsets (PLV z-score at 113 Hz). The horizontal line indicates the 95th percentile of the standardized noise distribution. Error bars represent 95% confidence intervals about the mean with a within-subject correction applied (Morey, 2008; Chang, 2015).
Fig. 4
Fig. 4
Average PLV z-score as a function of frequency in Experiment 2. Traces have been shifted slightly in the horizontal direction to aid visualization. Top row: PLV (z-score) as a function of frequency for 113 Hz stimuli. Bottom: PLV (z-score) as a function of frequency for 97 Hz stimuli. Integer multiples of 97 Hz and 113 Hz are indicated by vertical lines. Arrows represent peaks for which individual subject data is shown in Fig. 5.
Fig. 5
Fig. 5
PLV z-scores at the fundamental frequency of each stimulus shown for individual subjects in Experiment 2. Top row: Z-scores at stimulus fundamental frequency. Bottom row: Z-scores at first harmonic. Left column: Data for epochs corresponding to 97 Hz stimulus onsets (PLV z-score at 97 Hz or 194 Hz). Right column: data for epochs corresponding to 113 Hz stimulus onsets (PLV z-score at 113 Hz or 226 Hz). Horizontal lines in each panel indicate the 95th percentile of the standardized noise distribution. Error bars represent 95% confidence intervals about the mean with a within-subject correction applied (Morey, 2008; Chang, 2015).
Fig. 6
Fig. 6
Summary of parieto-occipital alpha activity obtained from Experiment 2. Top: mean alpha amplitude across subjects over time, expressed in dB relative to the amplitude in the pretrial period (−3.5 to 0 s), shown for the pretrial period and the first 60 s of the trials. Bottom: change in alpha amplitude during stimulus presentation, expressed as dB relative to baseline amplitude, shown for individual subjects and for the group mean. Error bars represent 95% confidence intervals about the mean with a within-subject correction applied (Morey, 2008; Chang, 2015). Stars indicate significant pairwise differences (α =0.95) obtained via t-test after Bonferroni-Holm corrections were applied to p values.

References

    1. Abdi H. Signal detection theory (SDT) In: Salkind N, editor. Encyclopedia of Measurement and Statistics. SAGE; Thousand Oaks, CA: 2007. pp. 886–889.
    1. Aiken SJ, Picton TW. Envelope and spectral frequency-following responses to vowel sounds. Hear Res. 2008;245:35–47. http://dx.doi.org/10.1016/j.heares.2008.08.004. - DOI - PubMed
    1. Ananthanarayan AK, Durrant JD. The frequency-following response and the onset response: evaluation of frequency specificity using a forward-masking paradigm. Ear Hear. 1992;13:228–232. http://dx.doi.org/10.1097/00003446-199208000-00003. - DOI - PubMed
    1. Bajo VM, Nodal FR, Moore DR, King AJ. The descending corticocollicular pathway mediates learning-induced auditory plasticity. Nat Neurosci. 2010;13:253–260. http://dx.doi.org/10.1038/nn.2466. - DOI - PMC - PubMed
    1. Bakeman R. Recommended effect size statistics for repeated measures designs. Behav Res Methods. 2005;37:379–384. http://dx.doi.org/10.3758/bf03192707. - DOI - PubMed

Publication types

LinkOut - more resources