. 2015 Jul 30;162(3):675-86.
doi: 10.1016/j.cell.2015.06.059. Epub 2015 Jul 16.

A Genome-wide CRISPR Screen in Primary Immune Cells to Dissect Regulatory Networks

Affiliations

A Genome-wide CRISPR Screen in Primary Immune Cells to Dissect Regulatory Networks

Oren Parnas et al. Cell. .

Abstract

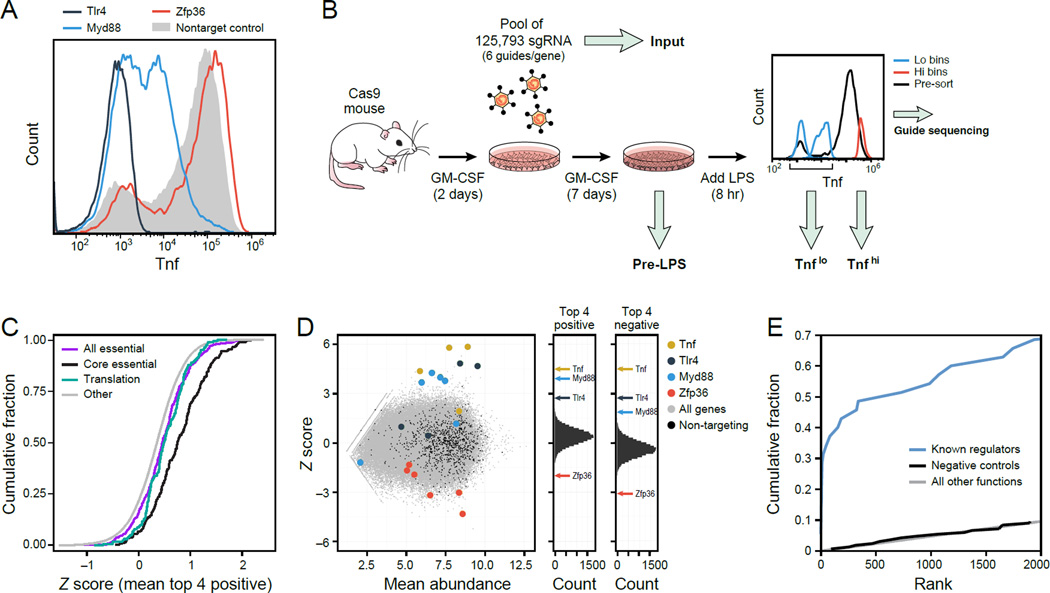
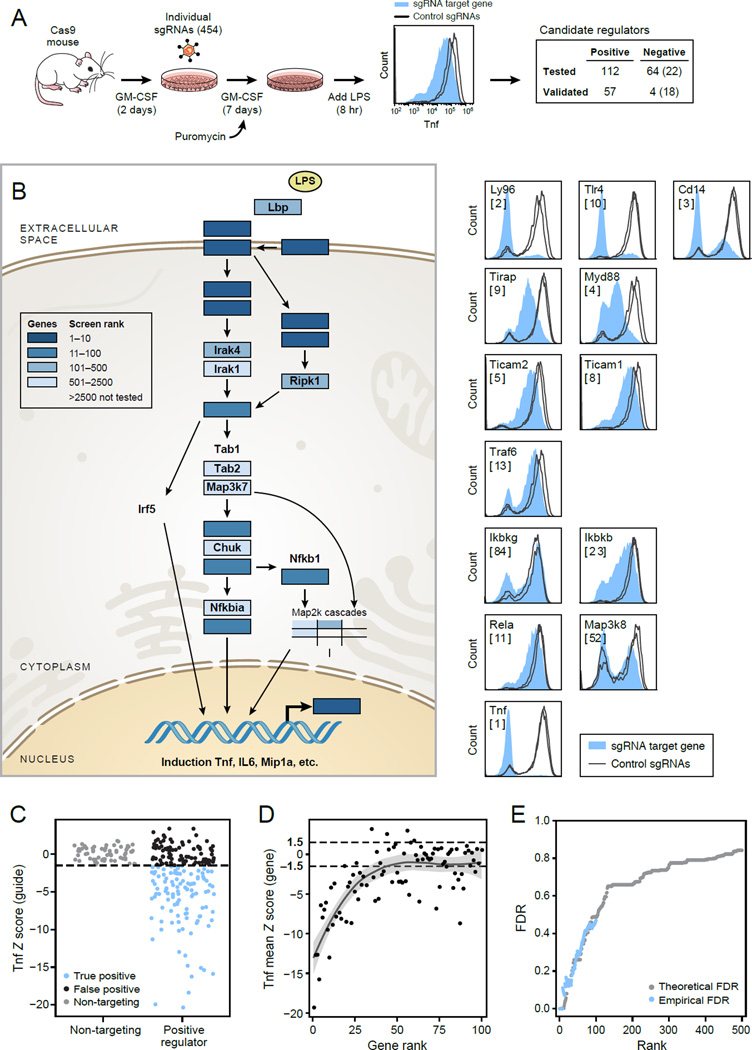
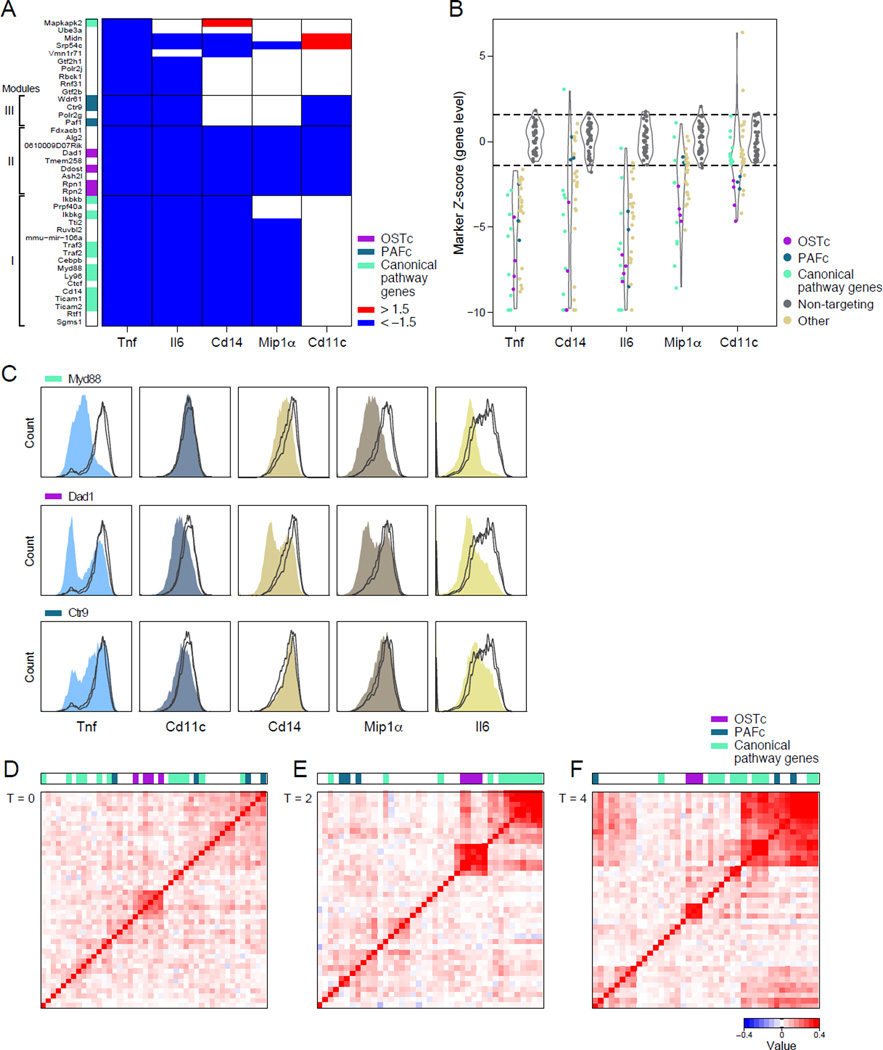
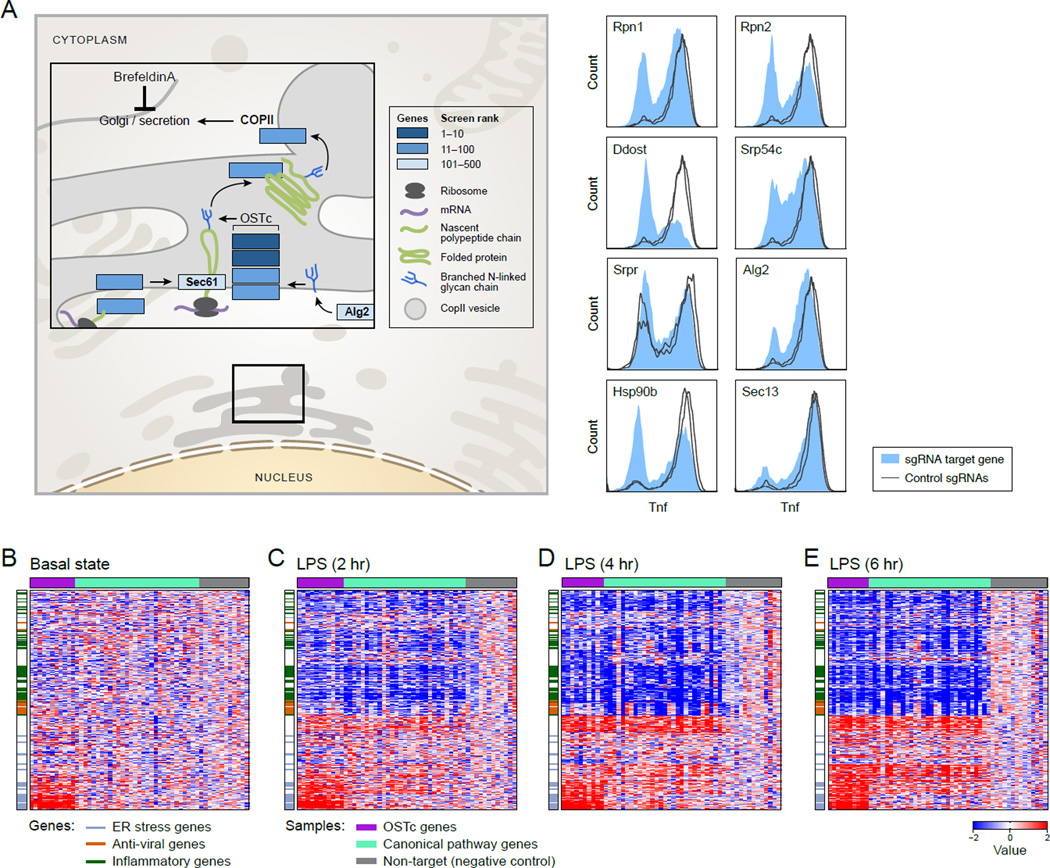
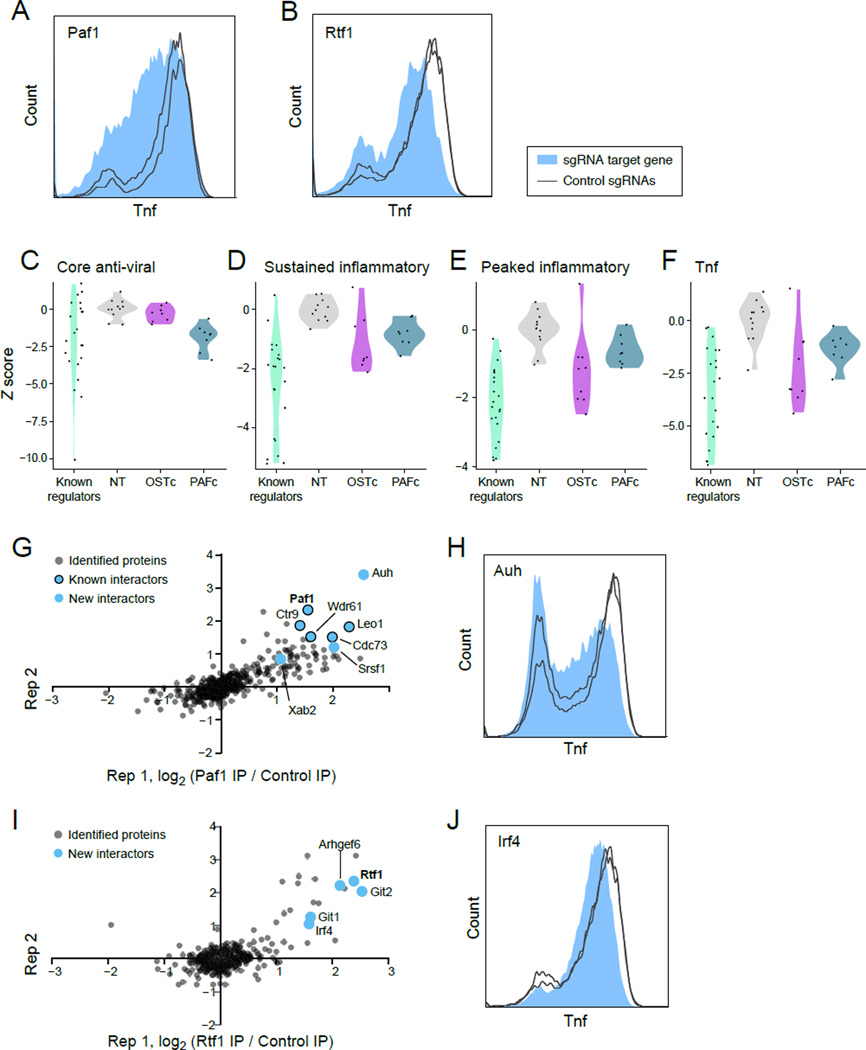
Finding the components of cellular circuits and determining their functions systematically remains a major challenge in mammalian cells. Here, we introduced genome-wide pooled CRISPR-Cas9 libraries into dendritic cells (DCs) to identify genes that control the induction of tumor necrosis factor (Tnf) by bacterial lipopolysaccharide (LPS), a key process in the host response to pathogens, mediated by the Tlr4 pathway. We found many of the known regulators of Tlr4 signaling, as well as dozens of previously unknown candidates that we validated. By measuring protein markers and mRNA profiles in DCs that are deficient in known or candidate genes, we classified the genes into three functional modules with distinct effects on the canonical responses to LPS and highlighted functions for the PAF complex and oligosaccharyltransferase (OST) complex. Our findings uncover new facets of innate immune circuits in primary cells and provide a genetic approach for dissection of mammalian cell circuits.


Figures

Figure 1
Figure 1. A genome-wide pooled CRISPR screen in mouse primary DCs
(A) Flow cytometry of intracellular Tnf levels following 8h of LPS stimulation for single sgRNAs. (B) Design of a genome wide CRISPR screen. (C) Cumulative distribution function (CDF) plots of the gene level Z-score distribution of genes annotated as ‘essential’ (purple) and ‘core essential’ (black) in (Hart et al., 2014), ‘Translation’ (in GO, blue), and all other genes (grey). (D) Left: Binned Z-scores (ZS) of the Tnflo / Tnfhi ratios (y-axis) vs. sgRNA mean abundances in Tnflo and Tnfhi (x-axis). Right: Gene score distribution for positive (ZS) and negative (ZS) regulators (Experimental Procedures). (E) CDFs of gene rank for the 35 genes in the TLR pathway from LPS to Tnf (KEGG, blue), non-targeting controls (black) and all other genes (grey). Also see Figure S1, related to Figure 1.
Figure 2
Figure 2. Individual sgRNAs verify dozens of top hits from the pooled screen
(A) Experimental design to validate top screen hits by individual sgRNA knockouts. Tnf levels were measured by flow cytometry for each sgRNA (filled) vs. control sgRNAs (lines). Right: the numbers of positive and negative candidate regulators tested and verified using 100ng/mL or, in parentheses, 20ng/mL LPS. (B) Left: All components of the TLR pathway (KEGG) linking LPS and Tnf, and their ranks in the genome wide screen (blue scale). Right: Intracellular Tnf levels for each targeted gene (filled) compared to sgRNA controls (lines). (C) The intracellular Tnf signal (sgRNA Z-score relative to non-targeting sgRNA) of candidate positive regulators (right) and non-targeting controls (left). Blue: validated hits. (D) Mean Tnf Z score for all sgRNAs targeting the same gene at each screen rank. (E) Theoretical (grey) and empirical (blue) FDR by screen rank. Also see Figure S2, related to Figure 2.
Figure 3
Figure 3. The validated positive regulators partition into key modules by their effect on protein and RNA expression
(A) Change in expression (blue, reduced; red, increased) of 5 protein markers (labeled columns) measured by flow staining with antibodies (Experimental Procedures) for cells with sgRNAs targeting the indicated genes (rows). Three modules indicated with brackets, and color bar on left corresponds to legend on right. (B) Violin plots of the distribution of Z scores of true positive regulators of Tnf (left) or of non-targeting control sgRNAs (right) for each marker. Functional groups are colored as in (A). (C) Effects of selected sgRNAs targeting genes in each of three modules on protein markers for true positives (filled) vs. non-targeting controls (lines). (D-F) Correlation of global RNA expression profiles (normalized to non-targeting control values) for verified positive regulators per time point post-LPS, as indicated. Color scale: Pearson correlation coefficient. Also see Figure S3, related to Figure 3.
Figure 4
Figure 4. The OST complex strongly affects the BMDC inflammatory response
(A) Left: positive regulators in the context of the secretory pathway; right: intracellular Tnf staining for sgRNAs against each targeted gene (filled) vs. non-targeting controls (lines). (B - E) Impact of OSTc perturbation on gene expression at indicated times post LPS. Heatmaps: row-normalized Z-scores (relative to non-targeting controls) of mRNA levels for each sgRNA-targeted sample (columns). Only mRNAs that are differentially expressed (at least one time point, adjusted p-value <0.001) are shown, in the same order in each panel. Also see Figure S4, related to Figure 4.
Figure 5
Figure 5. The Paf complex strongly affects the LPS response
(A,B) Intracellular Tnf staining in cells with sgRNAs targeting Paf1 (A) or Rtf1 (B) (filled), compared to sgRNA controls (lines). (C-F) Violin plots of the distribution of response scores per sgRNA (calculated as an average of all RNA changes relative to non-targeting controls) in cells treated with sgRNAs targeting known regulators, non-targeting controls (NT), OSTc members, and PAFc members for each of 3 response signatures: anti-viral (C, 4h post LPS), sustained inflammatory (D, 4h post LPS), and peaked inflammatory (E, 2h post LPS), as well as Tnf transcript (F, 2h post LPS). Positive and negative values: increased and reduced response, respectively. (G, I) Scatter plots of two independent immunopurifications (IP) of Paf1 (G) or Rtf1 (I) followed by LC-MS/MS. Blue dots: interactors tested by individual sgRNA experiments for an effect on Tnf expression. Bold: IP target . (H, J) Intracellular Tnf staining in cells with sgRNAs targeting Auh (H) or Irf4 (J) (filled), compared to sgRNA controls (lines). Also see Figure S5, related to Figure 5.

References

    1. Amit I, Regev A, Hacohen N. Strategies to discover regulatory circuits of the mammalian immune system. Nature reviews Immunology. 2011;11:873–880. - PMC - PubMed
    1. Beaudoin G, Jaffrin MY. Plasma filtration in Couette flow membrane devices. Artificial organs. 1989;13:43–51. - PubMed
    1. Beck T, Hastings RK, Gollapudi S, Free RC, Brookes AJ. GWAS Central: a comprehensive resource for the comparison and interrogation of genome-wide association studies. European journal of human genetics : EJHG. 2014;22:949–952. - PMC - PubMed
    1. Bochenek G, Hasler R, El Mokhtari NE, Konig IR, Loos BG, Jepsen S, Rosenstiel P, Schreiber S, Schaefer AS. The large non-coding RNA ANRIL, which is associated with atherosclerosis, periodontitis and several forms of cancer, regulates ADIPOR1, VAMP3 and C11ORF10. Human molecular genetics. 2013;22:4516–4527. - PubMed
    1. Boehringer N, Hagens G, Songeon F, Isler P, Nicod LP. Differential regulation of tumor necrosing factor-alpha (TNF-alpha) and interleukin-10 (IL-10) secretion by protein kinase and phosphatase inhibitors in human alveolar macrophages. European cytokine network. 1999;10:211–218. - PubMed

Publication types

Substances

Associated data