. 2016 Apr 21;35(16):2020-30.
doi: 10.1038/onc.2015.267. Epub 2015 Jul 20.

Targeting hedgehog signaling reduces self-renewal in embryonal rhabdomyosarcoma

Affiliations

Targeting hedgehog signaling reduces self-renewal in embryonal rhabdomyosarcoma

S Satheesha et al. Oncogene. .

Abstract

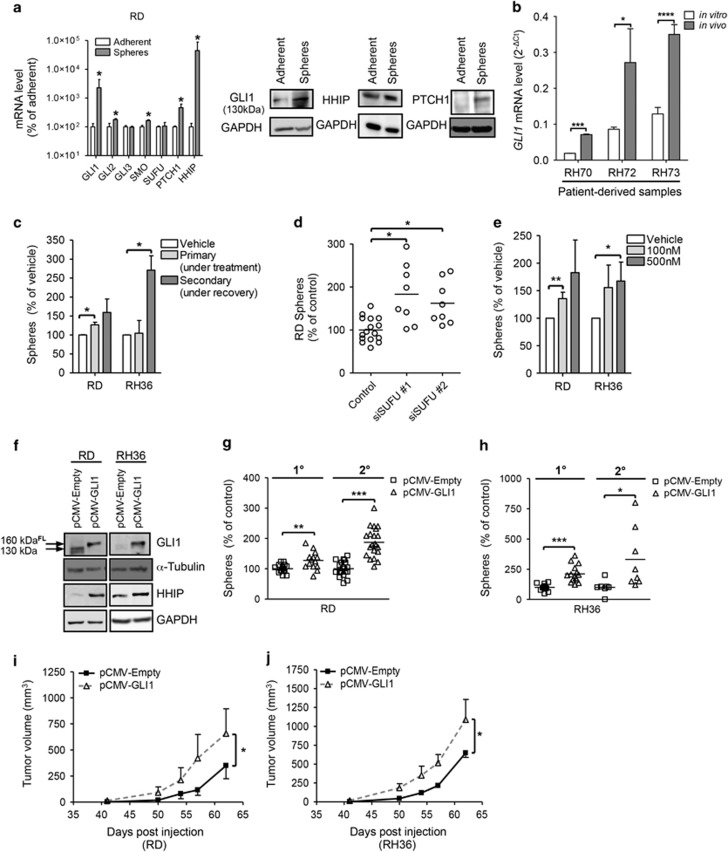
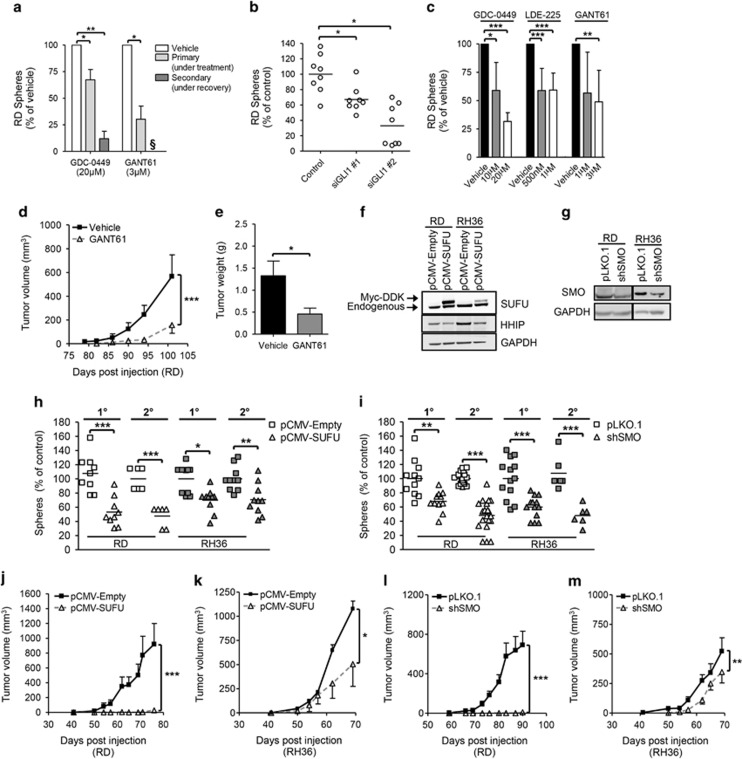
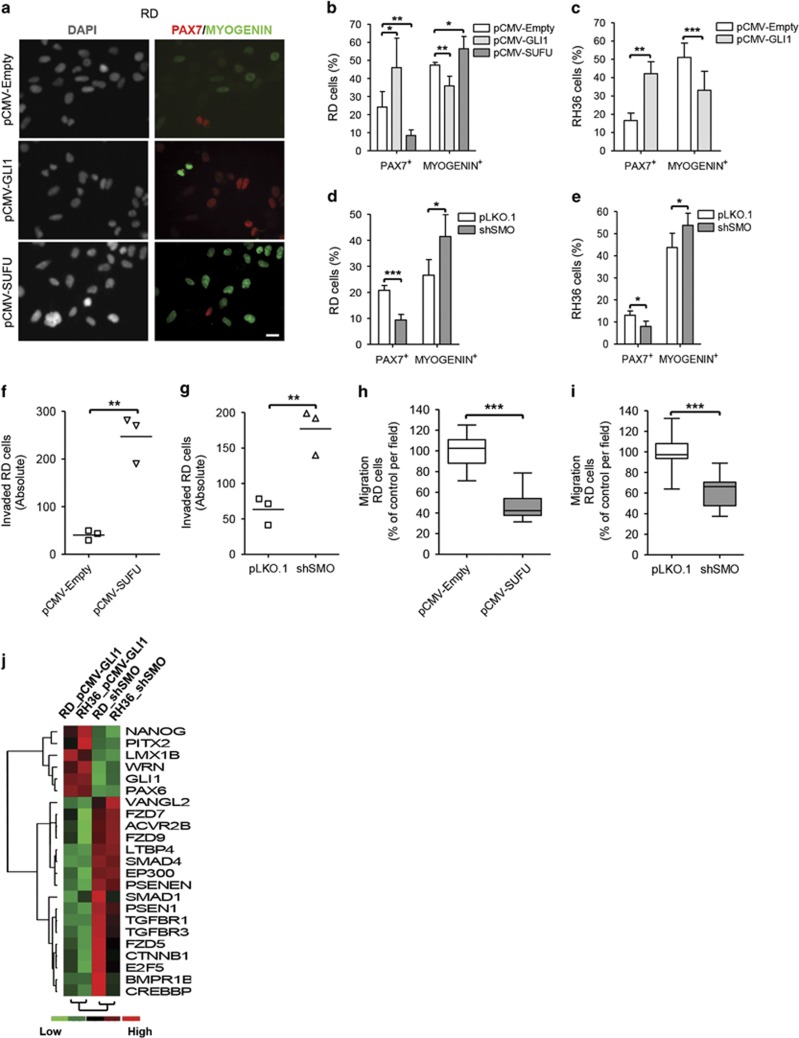
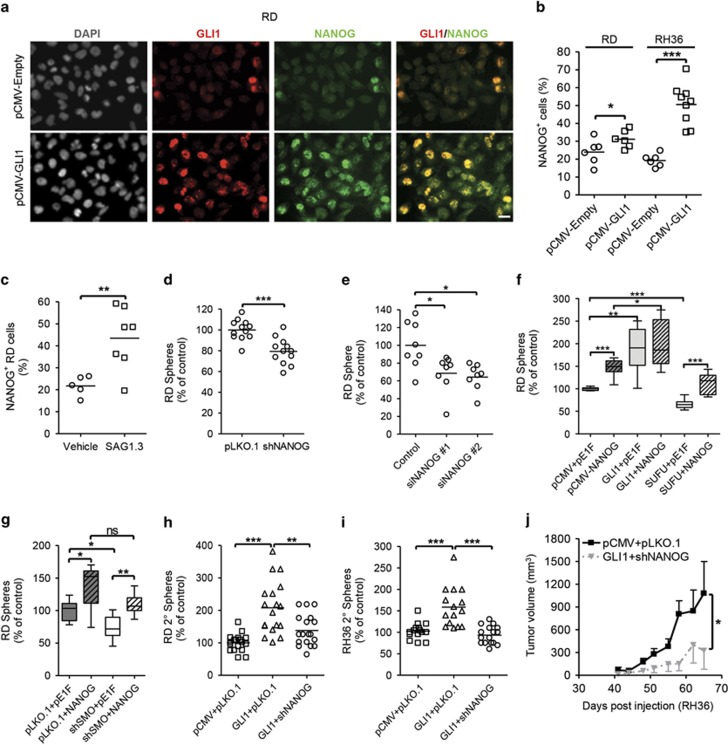
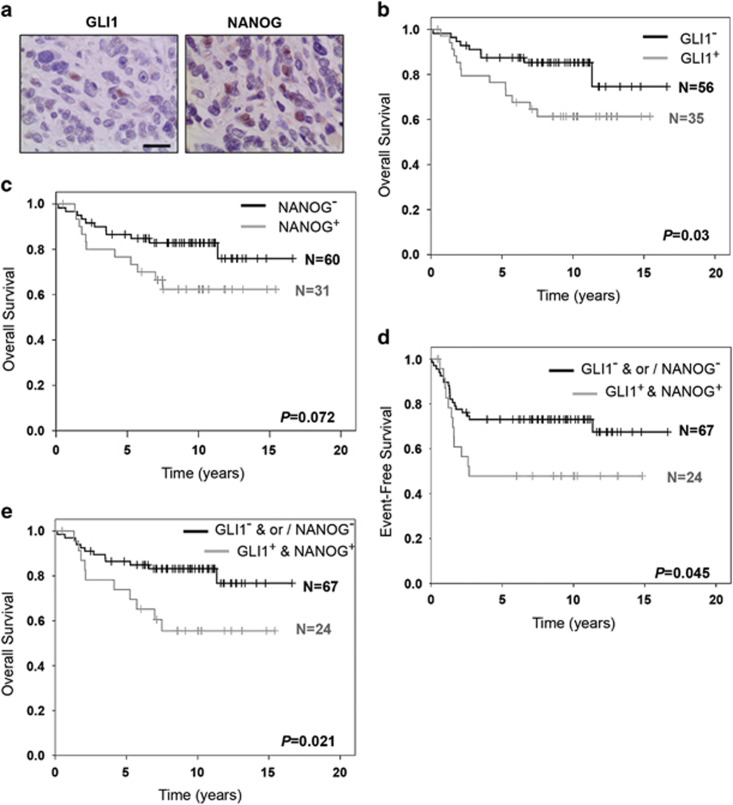
Current treatment regimens for rhabdomyosarcoma (RMS), the most common pediatric soft tissue cancer, rely on conventional chemotherapy, and although they show clinical benefit, there is a significant risk of adverse side effects and secondary tumors later in life. Therefore, identifying and targeting sub-populations with higher tumorigenic potential and self-renewing capacity would offer improved patient management strategies. Hedgehog signaling has been linked to the development of embryonal RMS (ERMS) through mouse genetics and rare human syndromes. However, activating mutations in this pathway in sporadic RMS are rare and therefore the contribution of hedgehog signaling to oncogenesis remains unclear. Here, we show by genetic loss- and gain-of-function experiments and the use of clinically relevant small molecule modulators that hedgehog signaling is important for controlling self-renewal of a subpopulation of RMS cells in vitro and tumor initiation in vivo. In addition, hedgehog activity altered chemoresistance, motility and differentiation status. The core stem cell gene NANOG was determined to be important for ERMS self-renewal, possibly acting downstream of hedgehog signaling. Crucially, evaluating the presence of a subpopulation of tumor-propagating cells in patient biopsies identified by GLI1 and NANOG expression had prognostic significance. Hence, this work identifies novel functional aspects of hedgehog signaling in ERMS, redefines the rationale for its targeting as means to control ERMS self-renewal and underscores the importance of studying functional tumor heterogeneity in pediatric cancers.


Conflict of interest statement

The authors declare no conflict of interest.

Figures

Figure 1
Figure 1
Activation of hedgehog signaling increases self-renewal and tumorigenicity of ERMS cells. (a) Left panel: Expression levels of hedgehog signaling components in RD spheres (n=6; N=2) compared with adherent monolayer cultures (n=9; N=3) by quantitative PCR (Log10 scale). Right panel: Western Blot anaysis showing expression of indicated proteins in RD adherent and sphere cells. (b) GLI1 RNA expression levels (relative to HMBS) in patient-derived samples when grown as xenografts (‘in vivo' n=6, N=2) or dissociated and cultured as adherent cells (‘in vitro' n=6, N=2) determined by qPCR. (c) Sphere-initiation capacity of ERMS cells treated with hedgehog agonist SAG1.3 (500 nM) every 48 h (three rounds) during primary sphere formation and thereafter plated for secondary sphere formation in normal sphere media (n=9; N=3). (d) Sphere formation after siRNA-mediated knockdown of SUFU (10 nM) in RD adherent cells compared with scrambled control siRNA (N=2). (e) Sphere formation following 48 h treatment of ERMS adherent cultures with SAG1.3 (n=5; N=5). (f) Western blot analysis of indicated proteins in ERMS stable cell lines. Primary (1°) and secondary (2°) sphere formation measured in ERMS stable lines (g: RD; N=3 and h: RH36; N=3). (i) Tumor growth rate of RD-based stable lines pCMV-Empty (n=6/6) and pCMV-GLI1 (n=5/5) injected orthotopically in NOD/SCID mice. (j) Tumor growth rate of RH36-based stable lines pCMV-Empty (n=2/6) and pCMV-GLI1 (n=4/6) injected orthotopically in NOD/SCID mice. Error bars in i and j represent s.e.m. Each data point in the scatter plots represents a technical replicate with the line drawn at the mean. In bar graphs, data represent mean±s.d. *P<0.05; **P<0.01; ***P<0.001; ****P<0.0001. FL, full-length.
Figure 2
Figure 2
Inhibition of hedgehog signaling decreases self-renewal and tumorigenicity of ERMS cells. (a) Sphere-initiation capacity of RD cells treated with small-molecule inhibitors GDC-0449 or GANT61 every 48 h (three rounds) during primary sphere formation and further plated for secondary sphere formation in normal sphere media (n=9; N=3). § No viable cells were recovered for secondary sphere formation. (b) Sphere formation measured following siRNA (10 nM) mediated GLI1 knockdown in RD adherent cells (n=6; N=2). (c) Sphere-formation ability of RD adherent cells after 48 h treatment with hedgehog inhibitors (n=12, N=6 for GDC-0449 and GANT61; n=6, N=2 for LDE-225). Tumor growth rate (d) and tumor weight (e) of RD cells pre-treated in vitro with GANT61 (3μM) (n=5 per condition). Western blot analysis of indicated proteins in stable ERMS lines overexpressing tagged SUFU (f; Myc-DDK) and knockdown of SMO (g). Primary (1°) and secondary (2°) sphere formation measured in ERMS stable lines (h: N=2 per cell line; i: N=2-4 per cell line except 2° sphere formation). Tumor growth kinetics of hedgehog inhibited pCMV-SUFU (j: RD; n=3/5 and k: RH36; n=3/6) and control pCMV-Empty (j: RD, n=5/5 and k: RH36, n=2/6) cells in NOD/SCID mice. Tumor growth kinetics of hedgehog inhibited shSMO (l: RD, n=3/7 and m: RH36, n=6/7) and control pLKO.1 (l: RD, n=7/7 and m: RH36, n=7/7) cells in NOD/SCID mice. Error bars in d, e, jm represent s.e.m. In bar graphs, data represent mean±s.d. *P<0.05; **P<0.01; ***P<0.001.
Figure 3
Figure 3
Hedgehog signaling alters the differentiation status and motility of ERMS cells. (a) Representative images of RD cells stained for PAX7 and MYOGENIN expression. All images were taken at × 400 magnification. Scale bar represents 20 μm. (b and d) Quantification of percentage of PAX7- or MYOGENIN-positive RD cells normalized to DAPI-stained nuclei counted per viewing field, using ImageJ (n=4). (c and e) Quantification of PAX7- or MYOGENIN-positive RH36 cells (n=5). (f and g) Total number of RD cells that could invade through matrigel-coated porous membrane filter towards a growth serum gradient over 48 h (n=3; N=3). (h and i) Relative migration of RD cells across porous membrane filter towards a growth serum gradient over 48 h (n=15; N=3). (j) Non-supervised hierarchical clustering of genes positively and negatively regulated by the hedgehog pathway common to both RD and RH36 cell lines. Each column represents the average RNA expression fold change for the labelled genes within the hedgehog-modulated stable cell line made relative to its respective empty vector control (n=2; N=2). *P<0.05, **P<0.01, ***P<0.001. Data represent mean±s.d.
Figure 4
Figure 4
Nanog is a functionally important target gene of hedgehog pathway in ERMS. (a) Representative images of RD cells co-stained for GLI1 and NANOG expression. All images were taken at × 400 magnification. Scale bar represents 20 μm. Quantification, using ImageJ, of NANOG-expressing cellular compartments normalized to DAPI-stained nuclei per viewing field in ERMS stable lines (b; N=2) and RD cells treated with SAG1.3 (500 nM) for 48 h (c; N=2). (d) Sphere formation in RD cells with stable knockdown of NANOG (shNANOG; N=3). (e) Sphere formation measured following siRNA (10 nM) mediated NANOG knockdown in RD adherent cells (N=2). (f and g) Primary sphere formation upon transient overexpression of NANOG in RD cells (n=12; N=2). Data represent mean±s.d. Secondary sphere formation in RD (h) and RH36 (i) rescue systems (N=3). (j) Tumor growth rate of RH36 cells in NOD/SCID mice (n=6/6 per cell line). Error bars represent s.e.m. *P<0.05, **P<0.01, ***P<0.001. ns, not significant.
Figure 5
Figure 5
Presence of GLI1+ and NANOG+ compartment predicts adverse patient survival. (a) Representative images of immunohistochemical staining for GLI1 and NANOG within an ERMS patient tumor core. All images were taken at × 400 magnification. Scale bar represents 20 μm. Kaplan–Meier curve representing overall survival of 91 ERMS patients either negative (black line) or positive (grey line) for GLI1 (b) or NANOG (c) alone. Kaplan–Meier curve representing event-free survival (d) and overall survival (e) of 91 ERMS patients determined to be negative (black line) for GLI1 and/or NANOG (‘GLI1- & or / NANOG-') or positive (grey line) for both GLI1 and NANOG expression (‘GLI1+ & NANOG+'). The P-values were generated using log-rank test.

References

    1. Chen X, Stewart E, Shelat AA, Qu C, Bahrami A, Hatley M et al. Targeting oxidative stress in embryonal rhabdomyosarcoma. Cancer Cell 2013; 24: 710–724. - PMC - PubMed
    1. Hawkins DS, Gupta AA, Rudzinski ER. What is new in the biology and treatment of pediatric rhabdomyosarcoma? Curr Opin Pediatr 2014; 26: 50–56. - PMC - PubMed
    1. Shern JF, Chen L, Chmielecki J, Wei JS, Patidar R, Rosenberg M et al. Comprehensive genomic analysis of rhabdomyosarcoma reveals a landscape of alterations affecting a common genetic axis in fusion-positive and fusion-negative tumors. Cancer Discov 2014; 4: 216–231. - PMC - PubMed
    1. Zibat A, Missiaglia E, Rosenberger A, Pritchard-Jones K, Shipley J, Hahn H et al. Activation of the hedgehog pathway confers a poor prognosis in embryonal and fusion gene-negative alveolar rhabdomyosarcoma. Oncogene 2010; 29: 6323–6330. - PubMed
    1. Paulson V, Chandler G, Rakheja D, Galindo RL, Wilson K, Amatruda JF et al. High-resolution array CGH identifies common mechanisms that drive embryonal rhabdomyosarcoma pathogenesis. Genes Chromosomes Cancer 2011; 50: 397–408. - PubMed

Publication types

Substances