. 2015 Aug 6;59(3):449-61.
doi: 10.1016/j.molcel.2015.06.016. Epub 2015 Jul 16.

Widespread Inducible Transcription Downstream of Human Genes

Affiliations

Widespread Inducible Transcription Downstream of Human Genes

Anna Vilborg et al. Mol Cell. .

Abstract

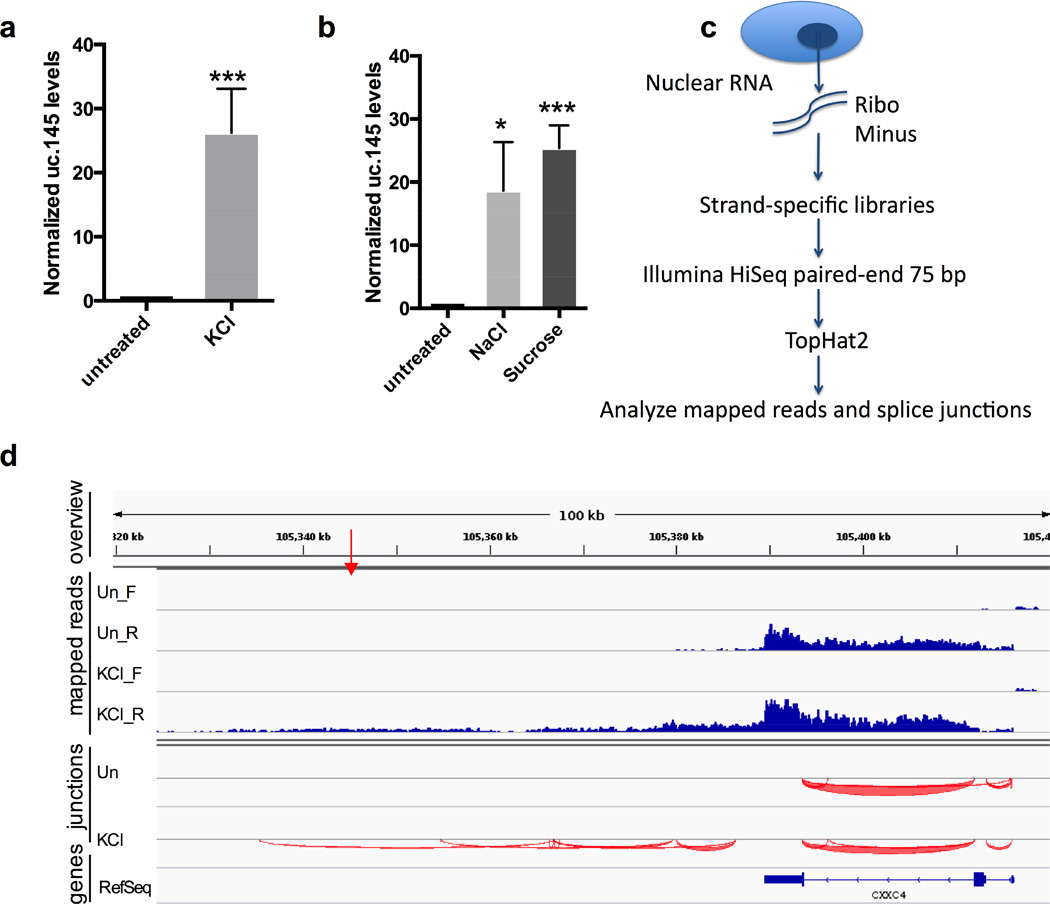
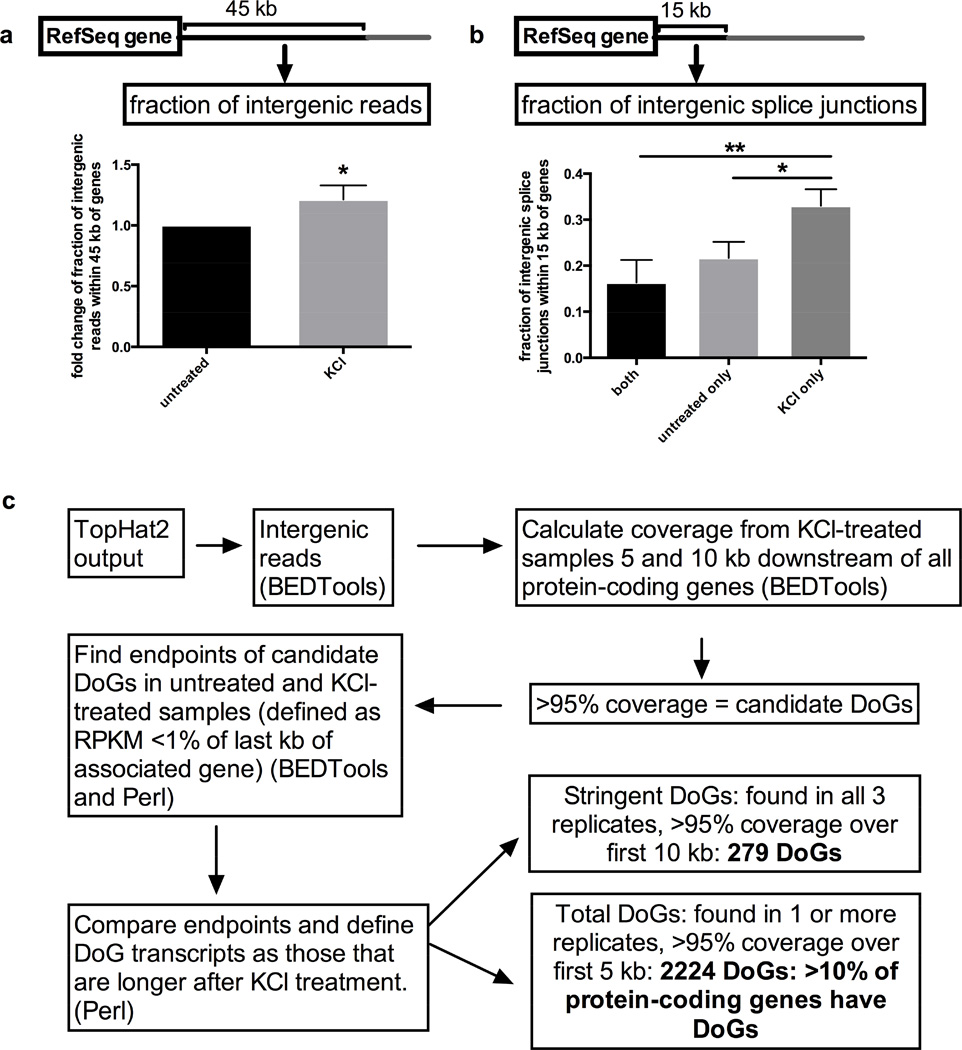
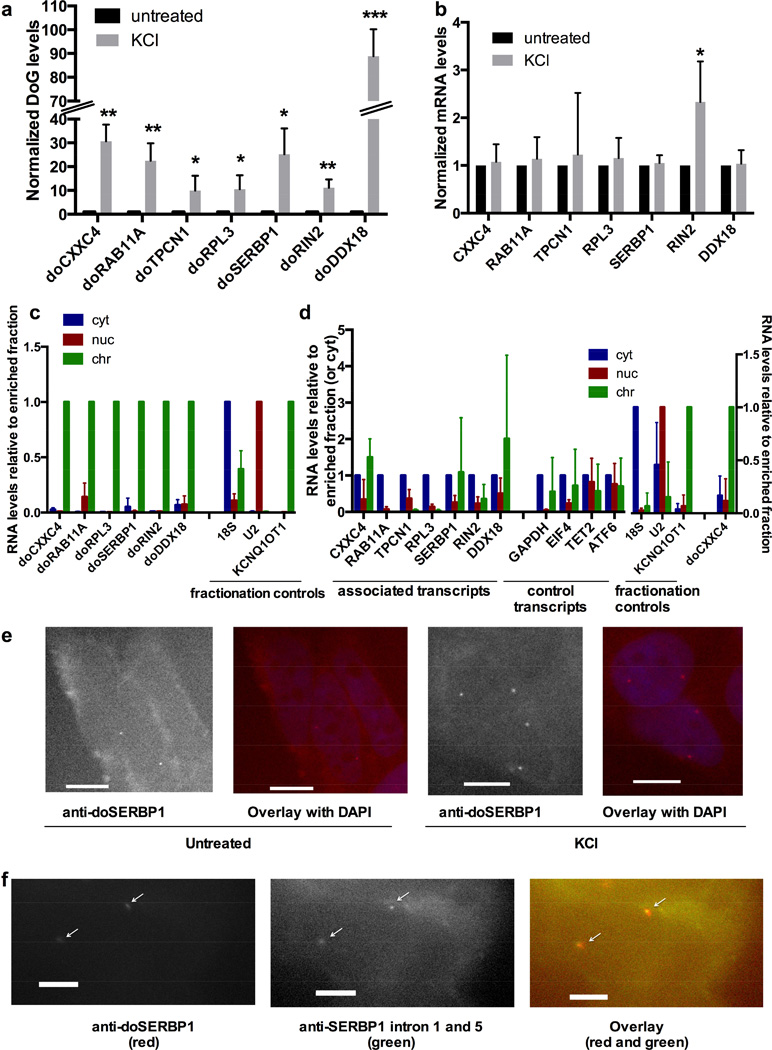
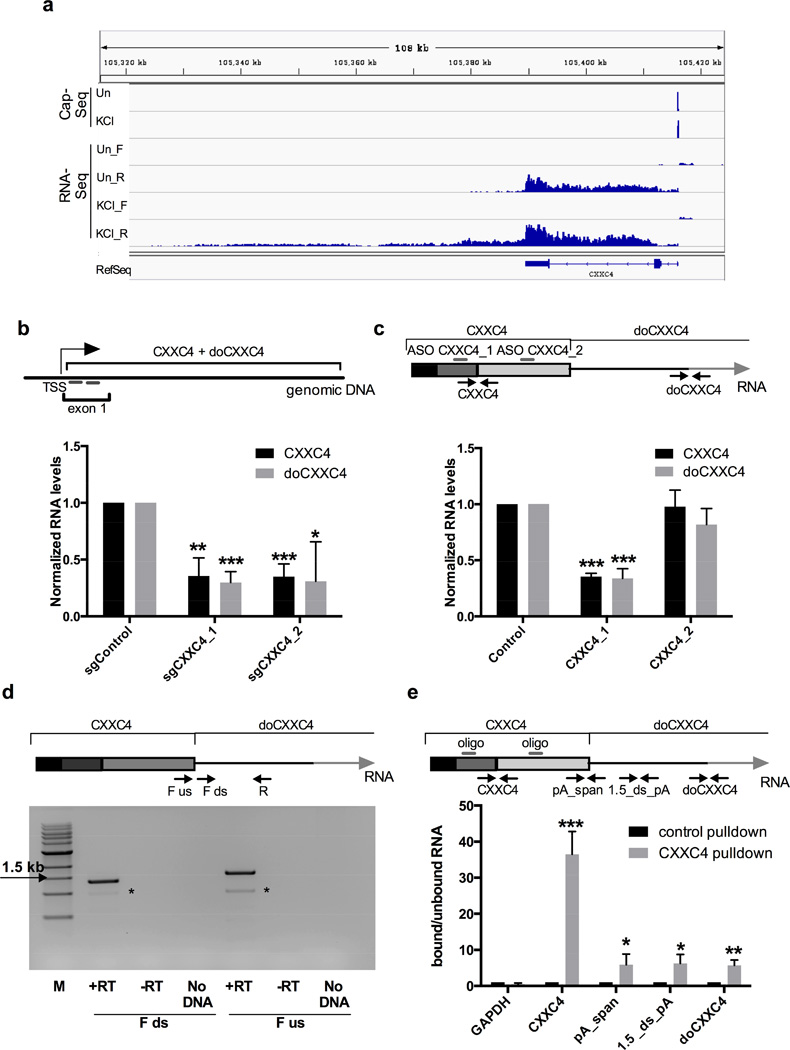
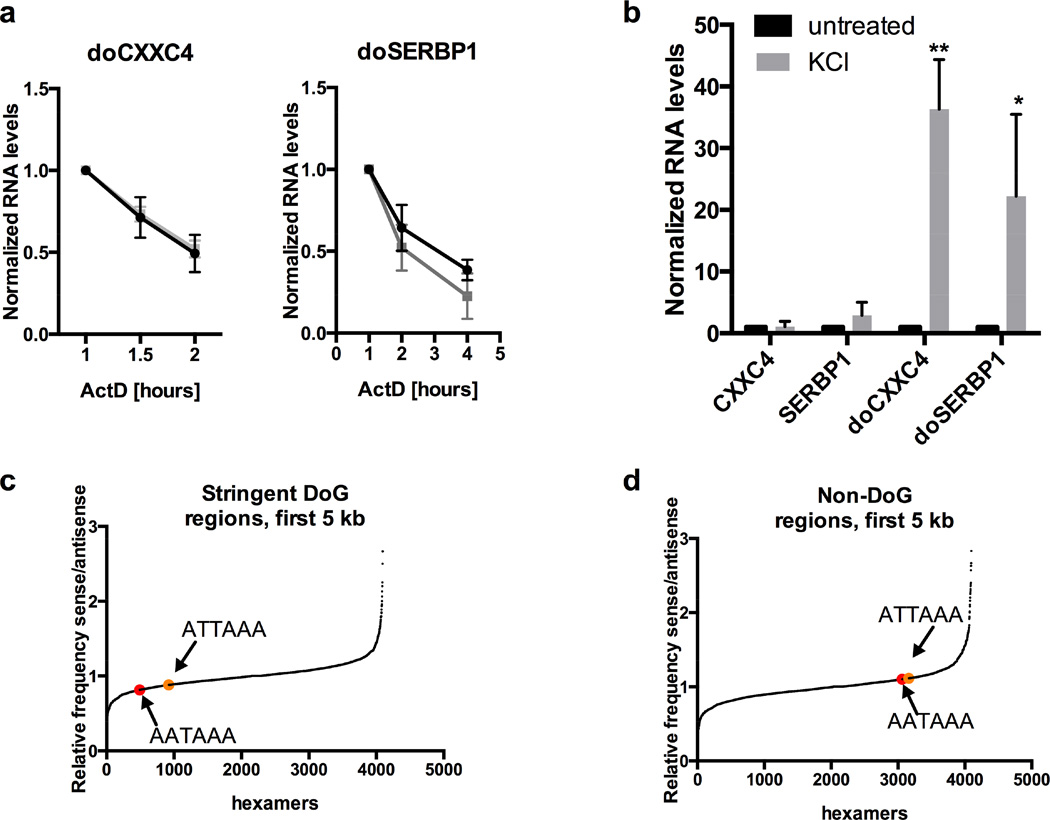
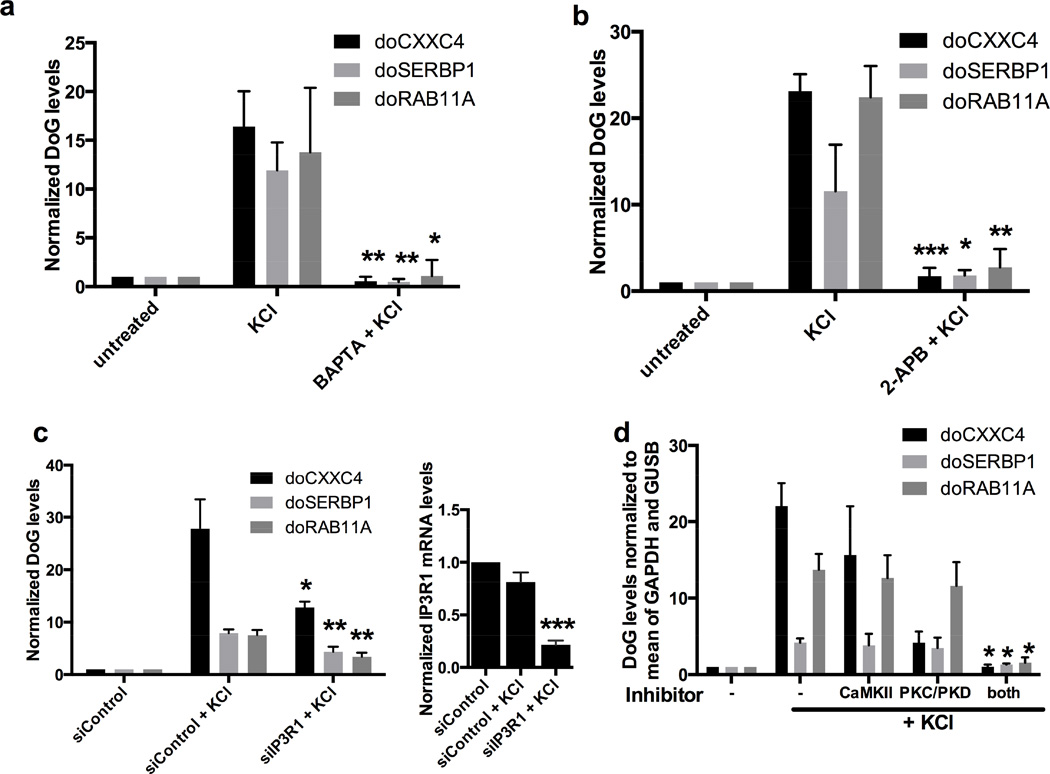
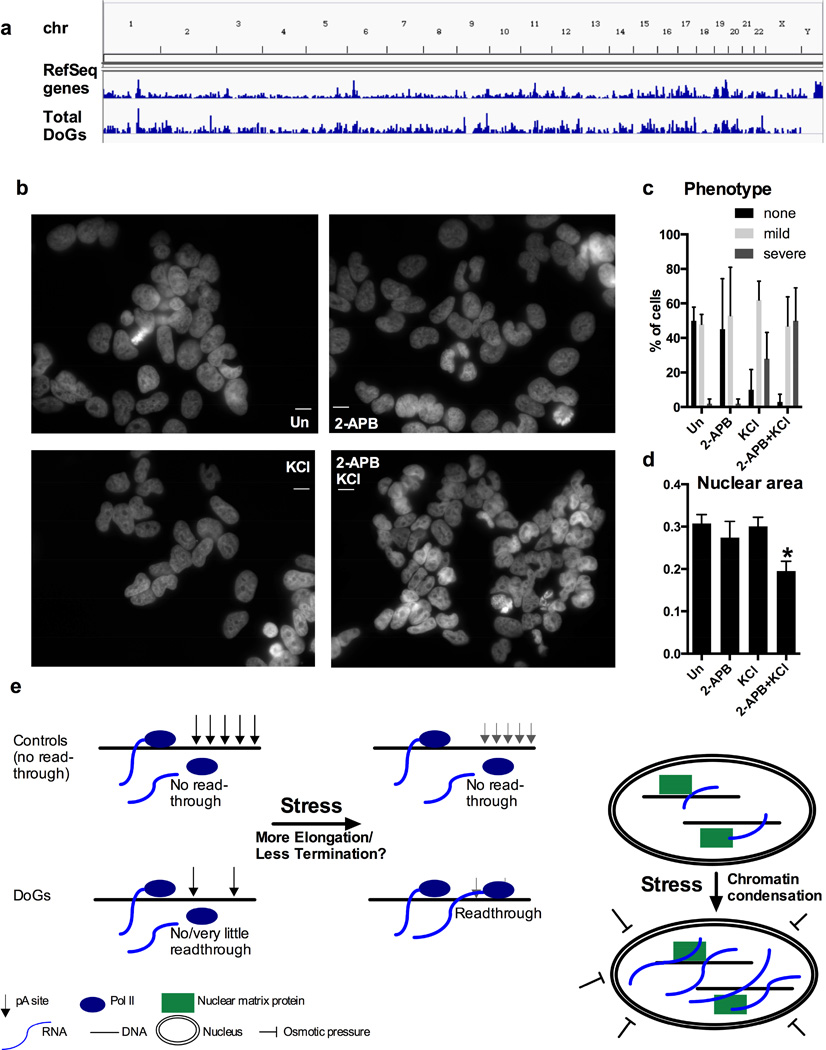
Pervasive transcription of the human genome generates RNAs whose mode of formation and functions are largely uncharacterized. Here, we combine RNA-seq with detailed mechanistic studies to describe a transcript type derived from protein-coding genes. The resulting RNAs, which we call DoGs for downstream of gene containing transcripts, possess long non-coding regions (often >45 kb) and remain chromatin bound. DoGs are inducible by osmotic stress through an IP3 receptor signaling-dependent pathway, indicating active regulation. DoG levels are increased by decreased termination of the upstream transcript, a previously undescribed mechanism for rapid transcript induction. Relative depletion of polyA signals in DoG regions correlates with increased levels of DoGs after osmotic stress. We detect DoG transcription in several human cell lines and provide evidence for thousands of DoGs genome wide.


Figures

Figure 1
Figure 1. The uc.145 transcript is contained within a DoG induced by osmotic stress
a) qRT-PCR quantitation of KCl-mediated induction (80 mM, 1h) of uc.145 in SK-N-BE(2)C cells, n=4. Figures of pooled data show mean and SD. p-values of 0.05-0.01 are denoted by *, 0.01-0.001 by **, and ≤0.001 by ***. uc.145 levels are normalized to average of GAPDH and GUSB mRNAs in a, and to GAPDH mRNA in b. b) uc.145 is induced by treatment with osmotic stress agents NaCl (80 mM, 1 h) or sucrose (200 mM, 1 h), n=3. A higher dose of sucrose is required because it produces 1 solute while KCl and NaCl produce 2. c) Outline of RNA-Seq experiment. d) Mapped reads and splice junctions surrounding uc.145 from a representative replicate of the RNA-Seq experiment. Top panel (“overview”) shows genomic coordinates and the red arrow indicates the location of the 248 nt uc.145. Second panel (“mapped reads”) shows reads mapping to the forward (_F) and reverse (_R) strands separately. “Un” stands for untreated. Third panel shows splice junctions (“junctions”) from the reverse strand depicted below the indicator line. The bottom panel shows RefSeq genes. See also Figure S1.
Figure 2
Figure 2. Genome-wide KCl-mediated upregulation of DoGs
a) Increase in intergenic reads within 45 kb downstream of RefSeq genes in KCl-treated relative to untreated samples, n=3; figures of pooled data show mean and SD, p-values are denoted as in Figure 1. b) Fraction of intergenic splice junctions present within 15 kb downstream of RefSeq genes either in both KCl-treated and untreated, in untreated only, or in KCl-treated only samples, with a statistically significant upregulation for splice junctions found in KCl-treated only samples, n=3. c) Outline of the analysis used to identify DoGs. All annotated DoGs are listed in Table S1. See also Figure S2.
Figure 3
Figure 3. Characterization of DoGs
a) Validation of DoG induction by KCl (80 mM, 1 h), n=3, except for doTPCN1, where n=4. doCXXC4 from Figure 1a is included for comparison. Figures of pooled data show mean and SD, p-values are denoted as in Figure 1. RNA levels are normalized to GAPDH mRNA in a and b. b) mRNA transcribed from DoG-associated genes are not induced by KCl with the exception of RIN2, which is induced 2-fold, while doRIN2 is induced 10-fold (Figure 3a), n=3, except for RIN2, where n=4. c) qRT-PCR quantitation of DoGs in RNA purified from cytoplasmic, soluble nuclear, or the chromatin fraction. KCNQ1OT1 lncRNA, U2 snRNA and 18S rRNA served as markers for the chromatin (chr), nuclear (nuc), and cytoplasmic (cyt) fraction, respectively, n=3. The enriched fraction is set to 1. All DoGs are significantly enriched in chromatin. d) As in c for DoG-associated mRNAs and control mRNAs, none of which are enriched in chromatin. Due to lack of material, 5 biological replicates were used to reach an n=3 for each target. Fractionation controls were significantly enriched in their respective fractions in both triplicate combinations used, but for simplicity, controls are shown as the mean and SD of all 5 replicates. doCXXC4 is an additional control to verify DoG localization to chromatin. doCXXC4, fractionation controls, RAB11A, RIN2, RPL3, and TPCN1 are significantly enriched in the fraction set to 1 compared to either of the other fractions. Other targets that showed no statistically significant enrichment in any fraction are shown normalized to the cytoplasmic fraction. e) Representative images of FISH using Stellaris probes (Biosearch) for doSERBP1 in untreated and KCl-treated SK-N-BE(2)C cells, confirming KCl-mediated induction and nuclear localization of doSERBP1. Images are at 40x magnification and scale bars indicate 10 µM. f) Representative images of co-staining with FISH Stellaris probes (Biosearch) for intron 1 and 5 of SERBP1 in KCl-treated cells demonstrating that doSERBP1 remains at the site of transcription. Images are at 100x magnification and scale bars indicate 5 µM. See Extended Experimental Procedures for details on FISH probes. See also Figures S3 and S4.
Figure 4
Figure 4. DoGs are part of the same transcript as the associated mRNA
a) CapSeq identifies the annotated TSS for CXXC4 but no downstream TSSs. Genomic coordinates are shown on top, CapSeq data is shown in the upper panel. The two following panels show mapped reads from Figure 1d and RefSeq genes annotated as in Figure 1d. Un stands for untreated. b) Inhibiting transcription through CXXC4 by targeting dCas9 to its first exon with two sgRNAs in 293T cells reduces the levels of both CXXC4 and doCXXC4, n=3. Figures of pooled data show mean and SD, p-values are denoted as in Figure 1. RNA levels are normalized to the average of GAPDH and GUSB mRNAs in b, c and e. Top panel shows the location of sgRNAs (short grey bars) relative to TSS of CXXC4. Diagram is not to scale. c) An ASO (CXXC4_1) effective in knocking down CXXC4 mRNA also reduces the levels of doCXXC4 in SK-N-BE(2)C cells, while ASO CXXC4_2 designed to target CXXC4 alters neither CXXC4 nor doCXXC4 levels, n=4. Top panel shows CXXC4 and part of doCXXC4 (different exons are depicted in different shades of gray). ASOs are shown as bars and qRT-PCR primers as arrows. Diagram is not to scale. d) Agarose gel showing comparable amounts of products from RT-PCR analysis of nuclear RNA with a reverse primer (R) located ~1.5 kb downstream of the CXXC4 polyA site combined with a forward primer (F) located just downstream (ds) or just upstream (us) of the CXXC4 polyA site as schematized in the top panel. Diagram is not to scale. M indicates 1 kb+ molecular marker (NEB). Asterisks indicate an unspecific band. e) Naked RNA pulldown using a mixture of biotinylated oligonucleotides (shown as grey bars in the top panel) targeting exon 2 and 3 of CXXC4 followed by qRT-PCR. Included primer pairs (shown as arrows) either target CXXC4, or span the CXXC4 polyA site (pA_span, this pair should not generate product if there were cleavage), are located 1.5 kb downstream of the polyA site (1.5_ds_pA), or span the first splice junction in doCXXC4 (doCXXC4). Diagram is not to scale. Figure shows the relative RNA levels in the bound versus unbound fraction after pulldown with the CXXC4 probe normalized to control (EBER2) probe, n=3.
Figure 5
Figure 5. DoGs are induced at the level of transcription, not RNA stability
a) There is no difference in the half-lives of doSERBP1 or doCXXC4 in untreated versus KCl-treated samples. ActD was used to inhibit transcription; 1 h (when ActD is fully effective) was set to 1. doCXXC4 could be monitored for only 1 additional h because of low signal. N=3. RNA levels are normalized to the average of GAPDH and GUSB mRNAs in a and b. b) KCl regulates transcription through DoG regions, but not of associated mRNAs. Newly synthesized RNA was selected after 5-EU incorporation as described in the main text and analyzed by qRT-PCR, demonstrating a 20- to 40-fold increase in newly synthesized doSERBP1 and doCXXC4 from cells treated with KCl compared to untreated cells with no effect on associated mRNAs. Due to lack of material, a total of 4 replicates was used to give n=3 for each target. c) Representation of the frequency on the sense versus antisense strand of all hexamers found in regions 5 kb downstream of 279 stringent DoG-associated genes (Table S1) compared to the counts of all other possible hexamers (4096 in total). PASs AATAAA is shown in red and ATTAAA in orange. d) As in c but for regions 5 kb downstream of 209 non-DoG genes with no sign of DoG transcription. See also Figure S6 and Table S4.
Figure 6
Figure 6. DoG levels are regulated by Ca2+ signalling
a) qRT-PCR quantitation showing loss of DoG induction if KCl treatment (80 mM, 1 h) follows a 30-min treatment with 50 mM BAPTA, a membrane permeable Ca2+ chelator, n=3; statistical significance indicated compares KCl and BAPTA+KCl. All figures show mean and SD, p-values are denoted as in Figure 1. RNA levels are normalized to GAPDH mRNA in a and to the average of GAPDH and GUSB mRNAs in b-d. b) As in a but KCl treatment followed a 30-min treatment with 100 µM 2-APB, an IP3R inhibitor, n=3. c) qRT-PCR quantitation showing reduced KCl-mediated DoG induction in cells transfected with siRNA targeting IP3R1, compared to KCl treatment of control siRNA-transfected cells, n=3. Significant knockdown of IPR3R1 mRNA is shown by the graph to the right. d) KCl treatment (80 mM, 1 h) followed a 30-min treatment with either 10 µM Gö6976, a PKC/PKD inhibitor; 10µM KN-93, a CaMKII inhibitor; or both. N=3, statistical significance indicated compares KCl alone with KCl + both inhibitors. See also Figure S7.
Figure 7
Figure 7. Inhibiting stress-induced DoG induction correlates with aggravated nuclear response to osmotic stress
a) DoG regions are distributed over all euchromatin except for the Y chromosome, demonstrated by a comparison of total DoGs and RefSeq genes. b) DAPI nuclear staining of SK-N-BE(2)C cells either treated with 100 µM 2-APB for 30 min prior to treatment with 80 mM KCl for 1 h, or treated with 2-APB or KCl separately, or left untreated. Images are taken at 63x magnification and scale bars indicate 20 µM. c) Unbiased quantification of the phenotype in b based on 20 cells each from 5 images per treatment (100 cells/treatment). The mild phenotype is significantly more prominent than severe phenotype in all samples except of 2-ABP + KCl, where both phenotypes are detected at similar frequencies. d) Measurement of nuclear area of 20 cells each from 5 images per treatment (100 cells/treatment). Statistical significance indicate a difference between 2-ABP + KCl and all other samples. e) Models for the regulation of DoG induction (left panel) and for DoG function (right panel).

Comment in

References

    1. Almada AE, Wu X, Kriz AJ, Burge CB, Sharp PA. Promoter directionality is controlled by U1 snRNP and polyadenylation signals. Nature. 2013;499:360–363. - PMC - PubMed
    1. Bading H, Ginty DD, Greenberg ME. Regulation of gene expression in hippocampal neurons by distinct calcium signaling pathways. Science. 1993;260:181–186. - PubMed
    1. Beaudoing E, Freier S, Wyatt JR, Claverie JM, Gautheret D. Patterns of variant polyadenylation signal usage in human genes. Genome Res. 2000;10:1001–1010. - PMC - PubMed
    1. Berg MG, Singh LN, Younis I, Liu Q, Pinto AM, Kaida D, Zhang Z, Cho S, Sherrill-Mix S, Wan L, et al. U1 snRNP determines mRNA length and regulates isoform expression. Cell. 2012;150:53–64. - PMC - PubMed
    1. Berridge MJ. Inositol trisphosphate and calcium signalling mechanisms. Biochim Biophys Acta. 2009;1793:933–940. - PubMed

Publication types

Associated data

LinkOut - more resources