Observational Study
. 2015 Nov;78(5):801-13.
doi: 10.1002/ana.24487. Epub 2015 Oct 1.

Optical coherence tomography reflects brain atrophy in multiple sclerosis: A four-year study

Affiliations
Observational Study

Optical coherence tomography reflects brain atrophy in multiple sclerosis: A four-year study

Shiv Saidha et al. Ann Neurol. 2015 Nov.

Abstract

Objective: The aim of this work was to determine whether atrophy of specific retinal layers and brain substructures are associated over time, in order to further validate the utility of optical coherence tomography (OCT) as an indicator of neuronal tissue damage in patients with multiple sclerosis (MS).

Methods: Cirrus high-definition OCT (including automated macular segmentation) was performed in 107 MS patients biannually (median follow-up: 46 months). Three-Tesla magnetic resonance imaging brain scans (including brain-substructure volumetrics) were performed annually. Individual-specific rates of change in retinal and brain measures (estimated with linear regression) were correlated, adjusting for age, sex, disease duration, and optic neuritis (ON) history.

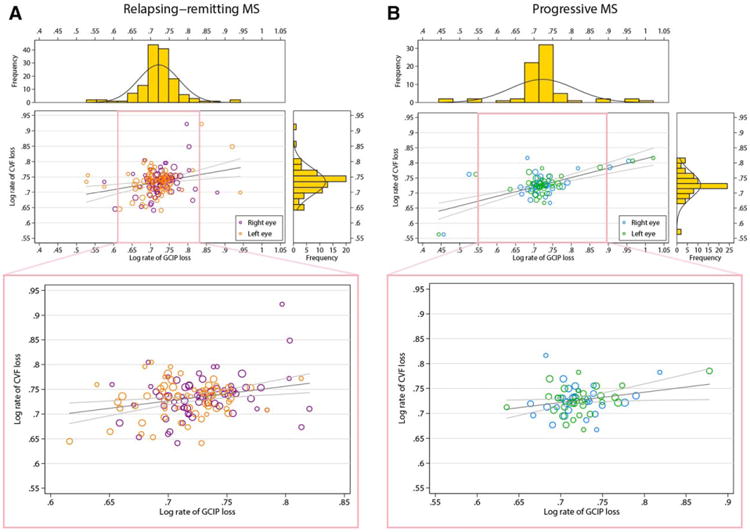
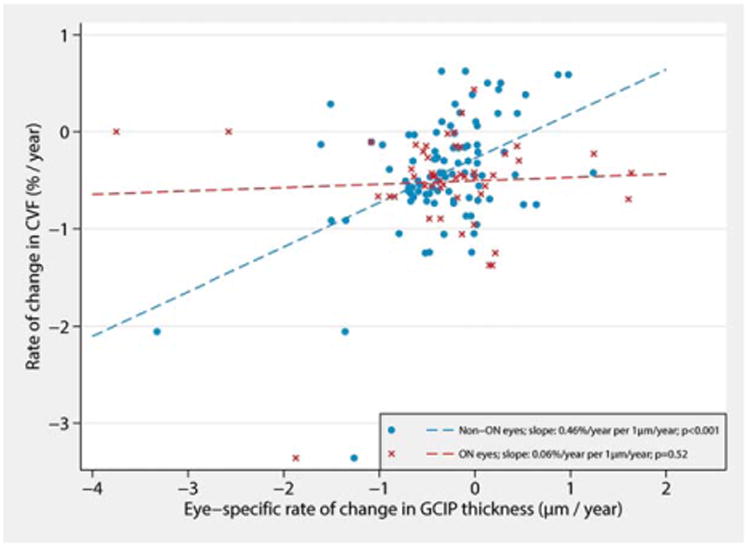
Results: Rates of ganglion cell + inner plexiform layer (GCIP) and whole-brain (r = 0.45; p < 0.001), gray matter (GM; r = 0.37; p < 0.001), white matter (WM; r = 0.28; p = 0.007), and thalamic (r = 0.38; p < 0.001) atrophy were associated. GCIP and whole-brain (as well as GM and WM) atrophy rates were more strongly associated in progressive MS (r = 0.67; p < 0.001) than relapsing-remitting MS (RRMS; r = 0.33; p = 0.007). However, correlation between rates of GCIP and whole-brain (and additionally GM and WM) atrophy in RRMS increased incrementally with step-wise refinement to exclude ON effects; excluding eyes and then patients (to account for a phenotype effect), the correlation increased to 0.45 and 0.60, respectively, consistent with effect modification. In RRMS, lesion accumulation rate was associated with GCIP (r = -0.30; p = 0.02) and inner nuclear layer (r = -0.25; p = 0.04) atrophy rates.

Interpretation: Over time GCIP atrophy appears to mirror whole-brain, and particularly GM, atrophy, especially in progressive MS, thereby reflecting underlying disease progression. Our findings support OCT for clinical monitoring and as an outcome in investigative trials.


Conflict of interest statement

Potential Conflicts of Interest: S.S. has served on a scientific advisory board for Biogen Idec and Genzyme. J.N.R. was a consultant for Genzyme and received research support from Biogen Idec, Novartis, and Sun Pharmaceuticals. Since the completion of this work, he has now become an employee of MedImmune. J.O. has received personal compensation for consulting or speaking from EMD-Serono, Genzyme, Biogen Idec, and Novartis and has received research funding from Genzyme. S.D.N. has received personal compensation for consulting from Biogen Idec, Novartis, and Genzyme and has received research funding from Biogen Idec and Novartis. J.L.P. has received consulting fees from and holds stock in Diagnosoft, Inc. P.V.Z. has received grant funding from, has technology licensed to, and is a paid lecturer for Philips Healthcare. L.J.B. has received speaking and consulting honoraria from Biogen Idec, Bayer, and Novartis. E.M.F. has received speaker and consulting fees from Novartis, Genzyme, Acorda, and TEVA. P.A.C. has received personal compensation for consulting and serving on scientific advisory boards from Vertex, Vaccinex, Merck, and AbbVie and has received research funding from Biogen IDEC, MedImmune, and Novartis.

Figures

Figure 1
Figure 1
This figure illustrates an en face optical coherence tomography (OCT) fundus image (A) and a corresponding high-definition OCT section of the same retina in the area of the interposed line (panel B), acquired from the right eye of a multiple sclerosis patient. Insets represent magnified areas of the OCT scan illustrating differences in the reflectivity patterns of different retinal layers. [Color figure can be viewed in the online issue, which is available at wileyonlinelibrary.com.]
Figure 2
Figure 2
Our study protocol. Study participants underwent brain MRI annually for a median duration of 39 months. Illustrated are longitudinal three-dimensional MPRAGE (row A) and FLAIR (row B) brain MRI images of a study participant. Row C shows corresponding automated Lesion-TOADS brain segmentation masks used to compute brain substructure volumes. In addition, study participants also underwent OCT imaging every 6 months for a median duration of 46 months. Longitudinal OCT images of the right eye of the same study participant are shown, including ganglion cell layer plus inner plexiform layer (GCIP) thickness maps overlaid on OCT fundus photos (row D), and GCIP and retinal nerve fiber layer deviation maps (rows E and F, respectively; yellow areas represent thicknesses <5% percentile and red areas represent thicknesses <1% percentile relative to healthy controls). FLAIR = fluid-attenuated inversion recovery; MPRAGE = magnetization-prepared rapid acquisition of gradient echoes; MRI = magnetic resonance imaging; OCT = optical coherence tomography; TOADS = topology-preserving anatomy-driven segmentation.
Figure 3
Figure 3
Relationship between rates of GCIP (x-axis) and cerebral volume fraction loss (CVF; y-axis) for the RRMS patients followed in the study (A). (B) Same relationship between rates of GCIP and CVF loss for the PMS patients followed in the study. The observations reported are log transformations of the original data (=log10[−x +5], where x is the respective annualized rate of change in % for CVF and mm for GCIP, i.e., increasing log values being associated with faster rates of GCIP and brain parenchymal fraction loss). The dimension of each circle is proportional to the duration of MRI follow-up. Gray lines represent regression lines and 95% confidence limits indicating the utility of GCIP thinning for predicting simultaneous brain atrophy. Pink insets illustrate the association after limiting the regression analysis to ±2 standard deviations from the mean of the log rate of GCIP change in order to visually demonstrate that the relationships observed are not simply the derivative of outlier effects. Side histograms illustrate the distribution of observations for the corresponding axis. CVF = cerebral volume fraction; GCIP = ganglion cell+inner plexiform layer; MRI = magnetic resonance imaging; RRMS = relapsing-remitting multiple sclerosis; PMS = progressive multiple sclerosis.
Figure 4
Figure 4
Effect modification of the relationship between the rates of change in GCIP thickness and whole brain volume in the RRMS group by history of ON. Faster rates of GCIP thinning in eyes without a history of ON were associated with faster rates of whole brain atrophy over the study duration (blue). In contrast, changes in GCIP thickness of eyes with a past history of ON (red) were not significantly related to rates of whole brain atrophy. *Results account for within-subject, intereye correlation and are adjusted for age, sex, and disease duration. CVF=cerebral volume fraction; GCIP=ganglion cell+inner plexiform layer; ON=optic neuritis; RRMS=relapsing-remitting multiple sclerosis.
Figure 5
Figure 5
Effect of GCIP thickness at baseline on the rate of GCIP atrophy over time in MS. In general, the lower the GCIP thickness is at baseline, the lower the rate of GCIP atrophy is over time. GCIP=ganglion cell + inner plexiform layer; MS = multiple sclerosis. [Color figure can be viewed in the online issue, which is available at wileyonlinelibrary.com.]

References

    1. Kappos L, Moeri D, Radue EW, et al. Predictive value of gadolinium-enhanced magnetic resonance imaging for relapse rate and changes in disability or impairment in multiple sclerosis: A meta-analysis. Gadolinium MRI Meta-analysis Group. Lancet. 1999;353:964–969. - PubMed
    1. Fisher E, Rudick RA, Simon JH, et al. Eight-year follow-up study of brain atrophy in patients with MS. Neurology. 2002;59:1412–1420. - PubMed
    1. Sormani MP, Arnold DL, De Stefano N. Treatment effect on brain atrophy correlates with treatment effect on disability in multiple sclerosis. Ann Neurol. 2014;75:43–49. - PubMed
    1. van Waesberghe JH, Kamphorst W, De Groot CJ, et al. Axonal loss in multiple sclerosis lesions: magnetic resonance imaging insights into substrates of disability. Ann Neurol. 1999;46:747–754. - PubMed
    1. De Stefano N, Narayanan S, Francis GS, et al. Evidence of axonal damage in the early stages of multiple sclerosis and its relevance to disability. Arch Neurol. 2001;58:65–70. - PubMed

Publication types