Review
. 2015 Jul 2:6:636.
doi: 10.3389/fmicb.2015.00636. eCollection 2015.

The spatial biology of transcription and translation in rapidly growing Escherichia coli

Affiliations
Review

The spatial biology of transcription and translation in rapidly growing Escherichia coli

Somenath Bakshi et al. Front Microbiol. .

Abstract

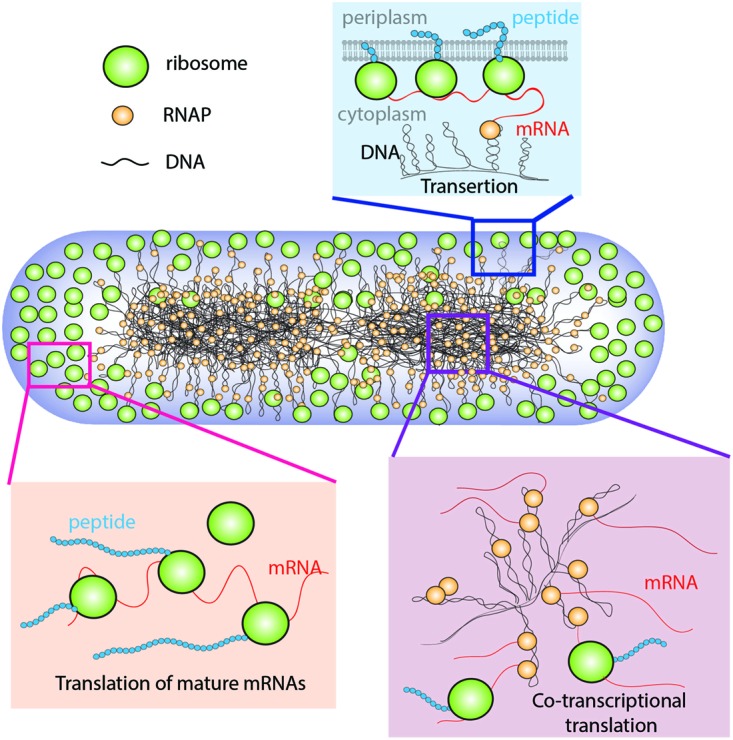
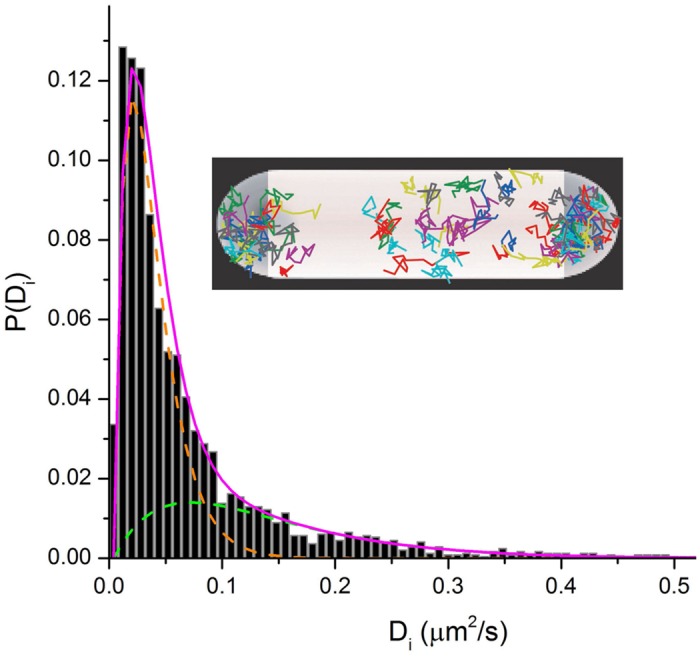
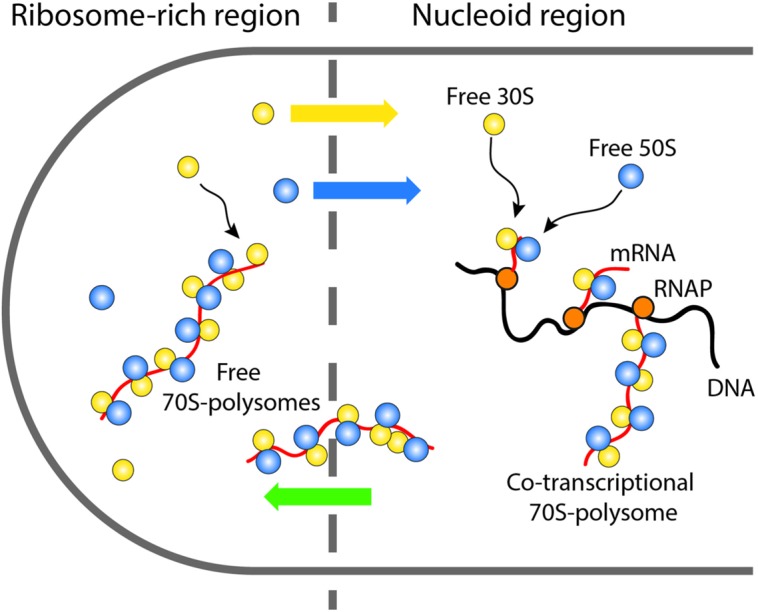
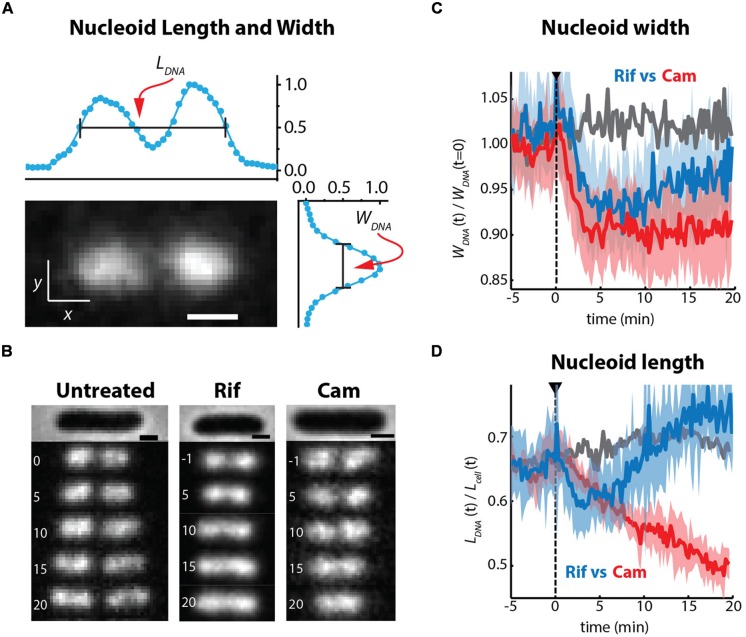
Single-molecule fluorescence provides high resolution spatial distributions of ribosomes and RNA polymerase (RNAP) in live, rapidly growing Escherichia coli. Ribosomes are more strongly segregated from the nucleoids (chromosomal DNA) than previous widefield fluorescence studies suggested. While most transcription may be co-translational, the evidence indicates that most translation occurs on free mRNA copies that have diffused from the nucleoids to a ribosome-rich region. Analysis of time-resolved images of the nucleoid spatial distribution after treatment with the transcription-halting drug rifampicin and the translation-halting drug chloramphenicol shows that both drugs cause nucleoid contraction on the 0-3 min timescale. This is consistent with the transertion hypothesis. We suggest that the longer-term (20-30 min) nucleoid expansion after Rif treatment arises from conversion of 70S-polysomes to 30S and 50S subunits, which readily penetrate the nucleoids. Monte Carlo simulations of a polymer bead model built to mimic the chromosomal DNA and ribosomes (either 70S-polysomes or 30S and 50S subunits) explain spatial segregation or mixing of ribosomes and nucleoids in terms of excluded volume and entropic effects alone. A comprehensive model of the transcription-translation-transertion system incorporates this new information about the spatial organization of the E. coli cytoplasm. We propose that transertion, which radially expands the nucleoids, is essential for recycling of 30S and 50S subunits from ribosome-rich regions back into the nucleoids. There they initiate co-transcriptional translation, which is an important mechanism for maintaining RNAP forward progress and protecting the nascent mRNA chain. Segregation of 70S-polysomes from the nucleoid may facilitate rapid growth by shortening the search time for ribosomes to find free mRNA concentrated outside the nucleoid and the search time for RNAP concentrated within the nucleoid to find transcription initiation sites.

Keywords: DNA-ribosome spatial segregation; E. coli; RNA polymerase; nucleoid structure; ribosomes; single-molecule tracking live cell.


Figures

FIGURE 1
FIGURE 1
Schematic of the coupled transcription–translation–transertion system in rapidly growing Escherichia coli. Adapted from Bakshi et al. (2014a).
FIGURE 2
FIGURE 2
Schematic of the super-resolution imaging method. (A) Each fluorescent molecule makes a diffraction-limited, essentially Gaussian image on the camera. A dense set of normal labels (blue images) makes overlapping images. In each imaging cycle, a sparse set of labels is photoactivated (red image) and localized from the well-isolated, single-molecule images. (B) An image of the spatial distribution is built up one molecule at a time over 100s or 1000s of optical cycles (upper “half-cells”). Successive images of the same molecule form a diffusive trajectory (lower “half-cells”).
FIGURE 3
FIGURE 3
(A) Widefield images of ribosomes (S2-YFP labeling) and DNA (DRAQ5 staining) in single E. coli cells. (B) Axial linescans of ribosome and DNA intensity vs. the long-axis coordinate x. Anti-correlation is evident. Adapted from Bakshi et al. (2012).
FIGURE 4
FIGURE 4
(A–C) Super-resolution imaging of the spatial distributions of RNA polymerase (β′-YFP labeling) in live E. coli. (C) Shows a histogram of locations projected onto the long axis of the cell in (B). (D–G) Super-resolution imaging of the spatial distributions of ribosomes (30S-YFP labeling) in live E. coli. (E) Shows two single copies imaged in one camera frame. (G) Shows an axial histogram of locations for the cell shown in (F). The gray regions in (C,G) are simulated histograms for a uniformly filled spherocylinder matching the length and radius of the single cell. Adapted from Bakshi et al. (2012).
FIGURE 5
FIGURE 5
(A) Single-RNAP diffusive trajectories in live E. coli growing in EZRDM at 37°C. Labeling was β′-mEos2. Note two types of trajectory. (B) Distribution of estimated diffusion coefficients Di from single-RNAP trajectories. Fast and slow sub-populations are evident. Red and green curves are model distributions for the two components. Adapted from Bakshi et al. (2013).
FIGURE 6
FIGURE 6
Inset: Single-ribosome diffusive trajectories from a live E. coli cell growing in EZRDM at 30°C. Labeling is S2-YFP. Main figure: Distribution of estimated single-ribosome diffusion coefficients Di. S2-mEos2 labeling. Two sub-populations are evident. Model sub-distributions are shown as green and orange dashed lines. Magenta line is their sum.
FIGURE 7
FIGURE 7
Schematic showing the suggested circulation of ribosomal subunits into and out of the nucleoids and the ribosome-rich regions.
FIGURE 8
FIGURE 8
(A) SYTOX orange-stained image of chromosomal DNA in a live E. coli cell growing in EZRDM at 30°C. The nucleoid spatial extent is characterized by length LDNA and width WDNA measured as the full width at half-maximum height (FWHM) of intensity distributions projected onto the x and y axes. (B) Time-lapse sequences of images of nucleoids stained by SYTOX Orange. Times in minutes, scale bars are 1 mm. Untreated cells, Rif-treated cells, and Cam-treated cells as indicated. (C) Quantitative nucleoid width WDNA vs. time. Gray: mean behavior of a set of untreated cells. Blue: behavior of Rif-treated cells. Red: behavior of Cam-treated cells. For blue and red, heavy lines are averages of traces from many cells; shaded regions show the envelope of single-cell results that were averaged. Dashed line shows time of initiation of flow of drug. (D) Same as (C), but with relative nucleoid length plotted as LDNA/Lcell. Adapted from Bakshi et al. (2014a).
FIGURE 9
FIGURE 9
Schematic of ribosome-nucleoid mixing hypothesis. 70S-polysomes and DNA strongly avoid each other, while free 30S and 50S subunits readily penetrate into the nucleoids. Adapted from Bakshi et al. (2014a).
FIGURE 10
FIGURE 10
(A) Hyper-branched polymer bead model of plectonemic DNA and 70S-polysomes. The red DNA beads exclude each other; the gray beads are invisible to the DNA beads but act as volume appropriately excluded to the polysomes. Polysomes are represented as freely jointed chains of spheres of appropriate size. (B) In Monte Carlo simulations, 70S-polysomes and DNA strongly avoid each other. (C) When the 70S-polysomes are dissociated into 50S and 30S monomers, the simulations show strong mixing and nucleoid expansion. Adapted from Bakshi et al. (2014a).

References

    1. Azam T. A., Hiraga S., Ishihama A. (2000). Two types of localization of the DNA-binding proteins within the Escherichia coli nucleoid. Genes Cells 5 613–626. 10.1046/j.1365-2443.2000.00350.x - DOI - PubMed
    1. Bakshi S., Bratton B. P., Weisshaar J. C. (2011). Subdiffraction-limit study of Kaede diffusion and spatial distribution in live Escherichia coli. Biophys. J. 101 2535–2544. 10.1016/j.bpj.2011.10.013 - DOI - PMC - PubMed
    1. Bakshi S., Choi H., Mondal J., Weisshaar J. C. (2014a). Time-dependent effects of transcription- and translation-halting drugs on the spatial distributions of the E. coli, chromosome and ribosomes. Mol. Microbiol. 94 871–887. 10.1111/mmi.12805 - DOI - PMC - PubMed
    1. Bakshi S., Choi H., Rangarajan N., Barns K. J., Bratton B. P., Weisshaar J. C. (2014b). Nonperturbative imaging of nucleoid morphology in live bacterial cells during an antimicrobial peptide attack. Appl. Environ. Microbiol. 80 4977–4986. 10.1128/AEM.00989-14 - DOI - PMC - PubMed
    1. Bakshi S., Dalrymple R. M., Li W., Choi H., Weisshaar J. C. (2013). Partitioning of RNA polymerase activity in live Escherichia coli from analysis of single-molecule diffusive trajectories. Biophys. J. 105 2676–2686. 10.1016/j.bpj.2013.10.024 - DOI - PMC - PubMed

LinkOut - more resources