

Value of counting positive PHH3 cells in the diagnosis of uterine smooth muscle tumors
- PMID: 26191133
- PMCID: PMC4503005
Value of counting positive PHH3 cells in the diagnosis of uterine smooth muscle tumors
Abstract
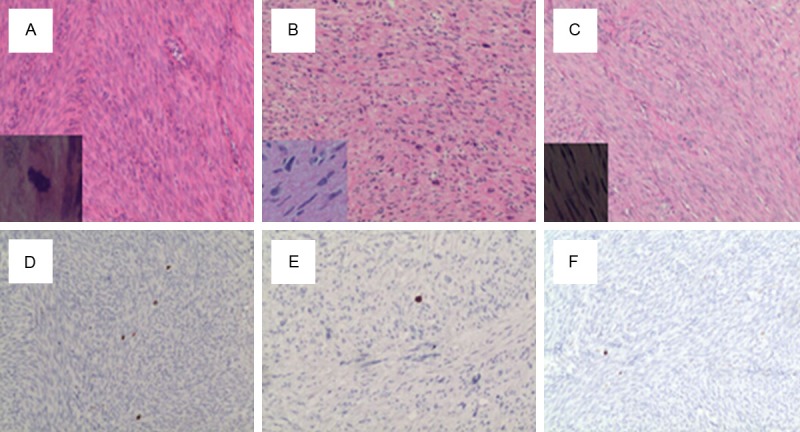
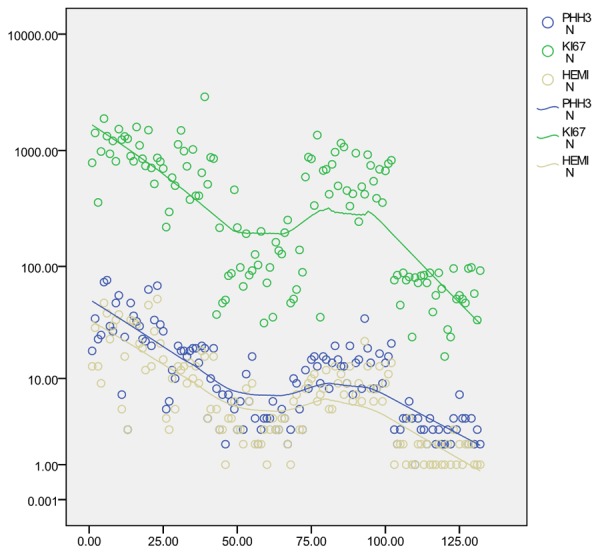
The diagnosis of uterine smooth muscle tumors including leiomyosarcomas (LMS), smooth muscle tumors of uncertain malignant potential (STUMP), bizarre (atypical) leiomyoma (BLM), mitotically active leiomyoma (MAL) and leiomyoma (LM) depends on a combination of microscopic features, such as mitoses, cytologic atypia, and coagulative tumor cell necrosis. However, a small number of these tumors still pose difficult diagnostic challenges. The assessment of accurate mitotic figures (MF) is one of the major parameters in the proper classification of uterine smooth muscle tumors. This assessment can be hampered by the presence of increased number of apoptotic bodies or pyknotic nuclei, which frequently mimic mitoses. Phospho-histone H3 (PHH3) is a recently described immunomarker specific for cells undergoing mitoses. In our study, we collected 132 cases of uterine smooth muscle tumors, including 26 LMSs, 16 STUMPs, 30 BLMs, 30 MALs and 30 LMs. We used mitosis specific marker PHH3 to count mitotic indexes (MI) of uterine smooth muscle tumors and compared with the mitotic indexes of hematoxylin and eosin (H&E). There is a positive correlation with the number of mitotic figures in H&E-stained sections and PHH3-stained sections (r=0.944, P<0.05). The ratio of PHH3-MI to H&E-MI has no statistically significant difference in each group except for LMs (P>0.05). The counting value of PHH3 in LMSs have significantly higher than STUMPs, BLMs, MALs and LMs (P<0.001) and the counting value of PHH3 is 1.5±0.5 times of the number of mitotic indexes in H&E. To conclude, our results show that counting PHH3 is a useful index in the diagnosis of uterine smooth muscle tumors and it can provide a more accurate index instead of the time-honored mitotic figure counts at a certain ratio.
Keywords: PHH3; Uterine smooth muscle tumors; immunohistochemical; mitotic index.
Figures


References
-
- Zaloudek CJ, Hendrickson MR, Robert A. Mesenchymal tumors of the uterus. In: Kurman RJ, editor. Blaustein’s pathology of the female genital tract. sixth edition. New York: Springer; 2011. pp. 471–476.
-
- Mittal K, Demopoulos RI. MIB-1 (KI-67), p53, estrogen receptor, and progesterone receptor expression in uterine smooth muscle tumors. Human Pathol. 2001;32:984–7. - PubMed
-
- Hendzel MJ, Wei Y, Mancini MA. Mitosis-specific phosphorilation of histone H3 initiates primarily within pericentromeric heterochromatin during G2 and spreads in an ordered fashion coincident with mitotic chromosome condensation. Chromosoma. 1997;106:348–60. - PubMed
MeSH terms
Substances
LinkOut - more resources
Full Text Sources
Medical
Research Materials