. 2015 Sep;29(9):1320-33.
doi: 10.1210/me.2015-1084. Epub 2015 Jul 20.

Ubc9 Impairs Activation of the Brown Fat Energy Metabolism Program in Human White Adipocytes

Affiliations

Ubc9 Impairs Activation of the Brown Fat Energy Metabolism Program in Human White Adipocytes

Sean M Hartig et al. Mol Endocrinol. 2015 Sep.

Abstract

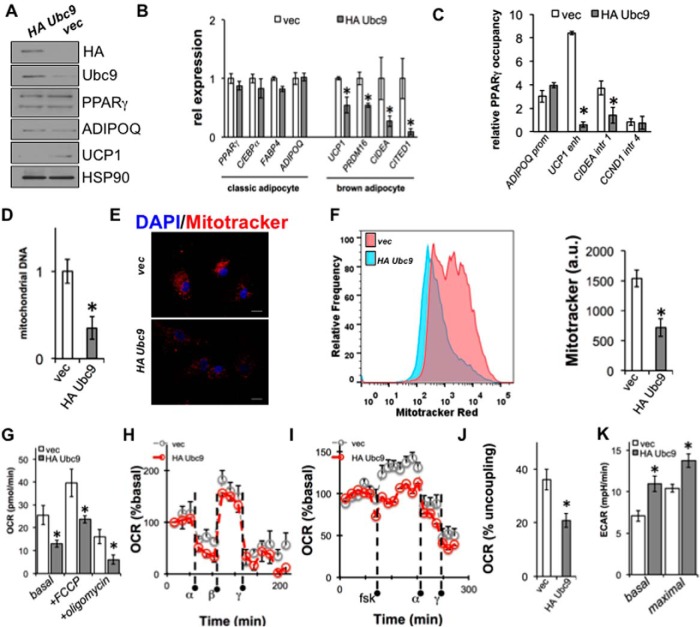
Insulin resistance and type 2 diabetes mellitus (T2DM) result from an inability to efficiently store and catabolize surplus energy in adipose tissue. Subcutaneous adipocytes protect against insulin resistance and T2DM by coupling differentiation with the induction of brown fat gene programs for efficient energy metabolism. Mechanisms that disrupt these programs in adipocytes are currently poorly defined, but represent therapeutic targets for the treatment of T2DM. To gain insight into these mechanisms, we performed a high-throughput microscopy screen that identified ubiquitin carrier protein 9 (Ubc9) as a negative regulator of energy storage in human sc adipocytes. Ubc9 depletion enhanced energy storage and induced the brown fat gene program in human sc adipocytes. Induction of adipocyte differentiation resulted in decreased Ubc9 expression commensurate with increased brown fat gene expression. Thiazolidinedione treatment reduced the interaction between Ubc9 and peroxisome proliferator-activated receptor (PPAR)γ, suggesting a mechanism by which Ubc9 represses PPARγ activity. In support of this hypothesis, Ubc9 overexpression remodeled energy metabolism in human sc adipocytes by selectively inhibiting brown adipocyte-specific function. Further, Ubc9 overexpression decreased uncoupling protein 1 expression by disrupting PPARγ binding at a critical uncoupling protein 1 enhancer region. Last, Ubc9 is significantly elevated in sc adipose tissue isolated from mouse models of insulin resistance as well as diabetic and insulin-resistant humans. Taken together, our findings demonstrate a critical role for Ubc9 in the regulation of sc adipocyte energy homeostasis.


Figures

Figure 1.
Figure 1.
Unbiased, image-based screening identified Ubc9 as a novel regulator of energy storage. A, Human preadipocytes were transfected with siRNA to 303 coregulators and all human nuclear receptors (n = 48). After siRNA and differentiation, microscopy and image analysis were used to identify effectors of fat storage. Each quadruplicate lipid measurement was normalized to the plate median and SD to calculate the z-score, shown as a dot plot for all genes screened. B, Representative images from scrambled siRNA control, Ubc9 siRNA, and PPARγ siRNA treatments are shown. Scale bar, 50 μm. C, Secondary screening of several siRNA was performed using PPARγ, ADIPOQ, and FABP4 mRNA as independent validation of potential hits. D, To validate effects on PPARγ-mediated transcription, human preadipocytes were transfected with Ubc9 siRNA followed by differentiation of cells for 4 days. Transcriptional activity was determined by measuring PPRE-luc normalized to β-galactosidase (n ≥ 2 independent experiments ± SEM; *, P < .05 relative to scrambled control).
Figure 2.
Figure 2.
Regulation of Ubc9 during human adipocyte differentiation. mRNA levels for (A) Ubc9, (B) PPARγ, (C) ADIPOQ, (D) CITED1, (E) CIDEA, and (F) UCP1 were measured by qPCR after differentiation with full (rosi) or partial (nTZDpa) agonists for the indicated days. G, Immunoblotting was used to analyze protein expression of Ubc9, PPARγ, CD36, UCP1, and ADIPOQ in preadipocytes (DMSO) or adipocytes differentiated with rosi or nTZDpa for 14 days (n ≥ 2 independent experiments ± SEM; *, P < .05 relative to DMSO treatment). H, FRET was used to evaluate the interactions between CFP-PPARγ2 and YFP Ubc9 coexpressed in HeLa cells treated as in A. Representative images are shown from 1 experiment for single channel (CFP or YFP) with the calculated FRET image. FRET was measured within nucleoplasmic regions of interest (bar graphs, n ≥ 10 cells/treatment). FRET signals were scaled between minimum and maximum signals (0–4000 pixels) and intensity colored as shown. Data are expressed as mean ± SEM; *, P < .05 compared with DMSO treatment.
Figure 3.
Figure 3.
Browning of human adipocytes is negatively regulated by Ubc9. mRNA levels of (A) Ubc9 and (B) adipocyte markers were measured by qPCR in human adipocytes transfected with Ubc9 siRNA differentiated for 8 days (n ≥ 10 independent experiments; *, P < .05 relative to scRNA-transfected cells differentiated for 8 days). C, mRNA levels for UCP1 were normalized to FABP4 to establish selectivity of BAT gene stimulation. D, Ubc9, PPARγ, CD36, FABP4, and UCP1 protein levels were determined by immunoblotting for human adipocytes transfected with Ubc9 siRNA. E, Mitochondrial DNA (ND6) was analyzed by qPCR from samples in A; *, P < .05 relative to scRNA-transfected cells treated with differentiation cocktail. F, Mitochondria (MitoTracker) and nuclei (DAPI) were labeled in human adipocytes transfected with Ubc9 siRNA followed by differentiation as in A–D. G, Flow cytometry was used to determine changes in MitoTracker staining (*, P < .05, n = 3 experiments). H, Respiration (as OCR) was measured in human adipocytes transfected with Ubc9 siRNA and differentiated for 8 days (n = 15 in each group; *, P < .05 relative to scRNA). The OCR was measured over time with the addition of oligomycin (α), FCCP (β), and antimycin-A/rotenone (γ). I, Percent change in OCR was normalized to baseline rates for experiments performed in H. J, OCR in human adipocytes transfected with Ubc9 siRNA, differentiated for 8 days, followed by treatment with forskolin (fsk). Oligomycin (α) was injected 1 hour after fsk. Rotenone (γ) was added approximately 20 minutes after oligomycin. OCR was normalized to baseline rates. K, Percent uncoupling was calculated by subtracting the difference between oligomycin (α) and rotenone (γ). In this case, OCR before oligomycin injection was set as 100%. Data presented as J and K are expressed as mean ± SEM, n = 5 independent experiments; *, P < .05 relative to scRNA.
Figure 4.
Figure 4.
Ubc9 expression is associated with acquisition of insulin resistance in mice and man. A, C57BL6/J mice were fed normal chow (lean) or high-fat diet (DIO) for 10 weeks. Lysates were prepared from inguinal WAT. Immunoblotting was used to determine the expression of Ubc9 and HSP90. Densitometry analysis of Ubc9/Hsp90 levels indicated significant (*, P < .05) increases in Ubc9 protein expression. B, Insulin sensitivity, inflammation, and Ubc9 gene expression was measured in WAT from lean or DIO mice (n ≥ 5 mice/group; *, P < .05 relative to lean mice). C, Cohort 1: relative Ubc9 and TNF mRNA expression was measured in sc adipose tissue isolated from obese (n = 8), and obese type 2 diabetic (n = 5) subjects at Baylor College of Medicine. Cohort 2: relative Ubc9 and TNF mRNA expression was measured in sc adipose tissue isolated from obese (n = 3) and obese insulin-resistant (IR) subjects (n = 12). #, P < .12; *, P < .05 relative to obese samples. D, A linear relationship was observed between TNF and relative Ubc9 expression across all sc adipose tissue samples profiled. The inset represents all data points with the exception of data points colored as solid red triangles.
Figure 5.
Figure 5.
Ubc9 selectively potentiates TZD activation of the brown fat gene program in human adipocytes. A, HA Ubc9 or vector control (vec) lentiviral particles were prepared and introduced into human preadipocytes for 48 hours before chemical induction of differentiation for 8 days. Immunoblotting was used to analyze protein expression levels of HA-Ubc9, PPARγ, ADIPOQ, and UCP1 when Ubc9 was overexpressed in human adipocytes. The effects of Ubc9 overexpression were verified by (B) qPCR analysis of PPARγ, CEBPα, CD36, FABP4, ADIPOQ, UCP1, PRDM16, CIDEA, and CITED1 mRNA levels (n ≥ 3 independent experiments; *, P < .05 relative to vector control). C, After 8 days treatment, PPARγ ChIP was performed in human adipocytes overexpressing HA-Ubc9 or vector control. qPCR was used to analyze genomic occupancy using primers flanking PPARγ binding sites in the ADIPOQ promoter (prom), UCP1 enhancer (enh), and CIDEA intron (intr)1 regions. An intronic region of cyclin D1 served as a negative control (n = 2 independent experiments; *, P < .05 relative to vector control). D, Mitochondrial DNA (ND6) was analyzed by qPCR from samples in A (*, P < .05 relative to vector control). E, Mitochondria (MitoTracker) and nuclei (DAPI) were labeled in human adipocytes infected with HA Ubc9 or control lentivirus followed by differentiation for 8 days. F, Flow cytometry was used to determine changes in MitoTracker staining (*, P < .05, n = 3 experiments). G, OCR was measured under basal conditions before addition of oligomycin and FCCP in human adipocytes expressing HA-Ubc9 or vector control (n ≥ 6/group; *, P < .05 relative to vector control). H, The percent change in OCR, normalized to baseline rates, was measured over time with the addition of oligomycin (α), FCCP (β), and antimycin-A/rotenone (γ) for experiments performed in G. I, OCR in human adipocytes expressing HA-Ubc9 or vector control differentiated for 8 days, followed by treatment with forskolin (fsk). Oligomycin (α) was injected 1 hour after fsk. Rotenone (γ) was added approximately 20 minutes after oligomycin. OCR was normalized to baseline rates. J, Percent uncoupling was calculated by subtracting the difference between oligomycin (α) and rotenone (γ). In this case, OCR before oligomycin injection was set as 100%. Data presented as I and J are expressed as mean ± SEM; n = 5 independent experiments; *, P < .05 relative to vector control. K, Relative glycolytic rate (as ECAR) was measured in human adipocytes expressing HA-Ubc9 or vector control. Maximal ECAR was measured after the addition of oligomycin (n ≥ 6/group; *, P < .05 relative to vector control). All data are expressed as mean ± SEM.

Similar articles

Cited by

References

    1. Kim JY, van de Wall E, Laplante M, et al. Obesity-associated improvements in metabolic profile through expansion of adipose tissue. J Clin Invest. 2007;117(9):2621–2637. - PMC - PubMed
    1. Seale P, Conroe HM, Estall J, et al. Prdm16 determines the thermogenic program of subcutaneous white adipose tissue in mice. J Clin Invest. 2011;121(1):96–105. - PMC - PubMed
    1. Tran TT, Yamamoto Y, Gesta S, Kahn CR. Beneficial effects of subcutaneous fat transplantation on metabolism. Cell Metab. 2008;7(5):410–420. - PMC - PubMed
    1. Cusi K. The role of adipose tissue and lipotoxicity in the pathogenesis of type 2 diabetes. Curr Diab Rep. 2010;10(4):306–315. - PubMed
    1. Wu J, Cohen P, Spiegelman BM. Adaptive thermogenesis in adipocytes: is beige the new brown? Genes Dev. 2013;27(3):234–250. - PMC - PubMed

Publication types

MeSH terms