. 2015 Aug;17(8):971-983.
doi: 10.1038/ncb3203. Epub 2015 Jul 20.

Hepatic progenitor cells of biliary origin with liver repopulation capacity

Affiliations

Hepatic progenitor cells of biliary origin with liver repopulation capacity

Wei-Yu Lu et al. Nat Cell Biol. 2015 Aug.

Abstract

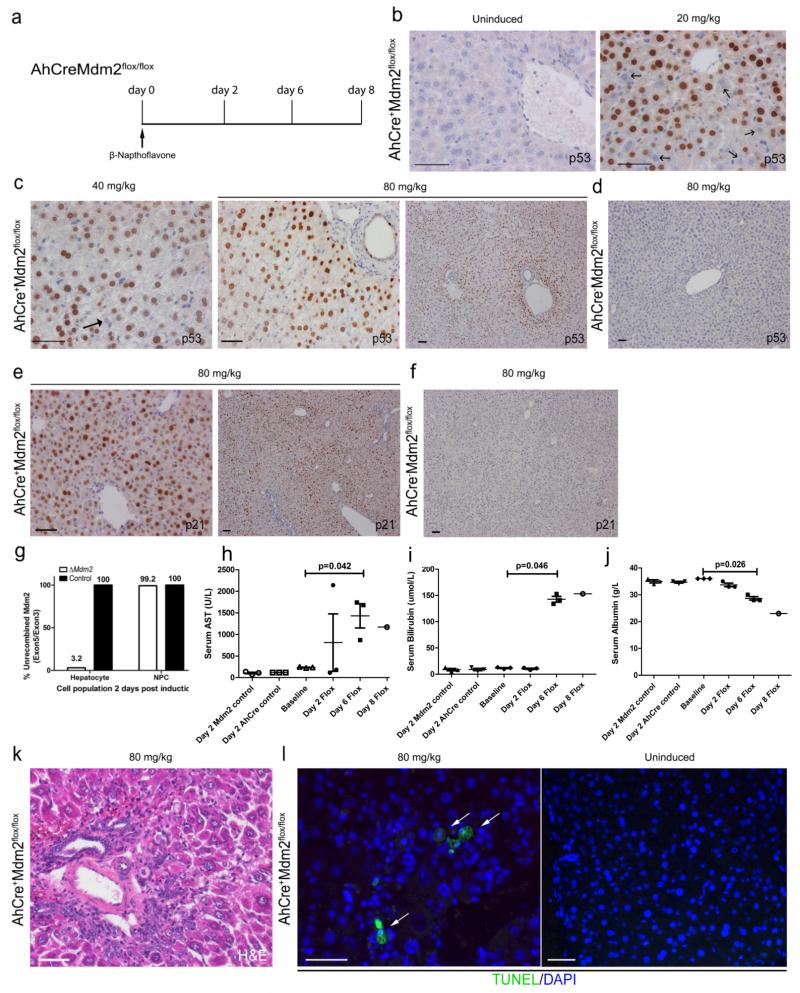
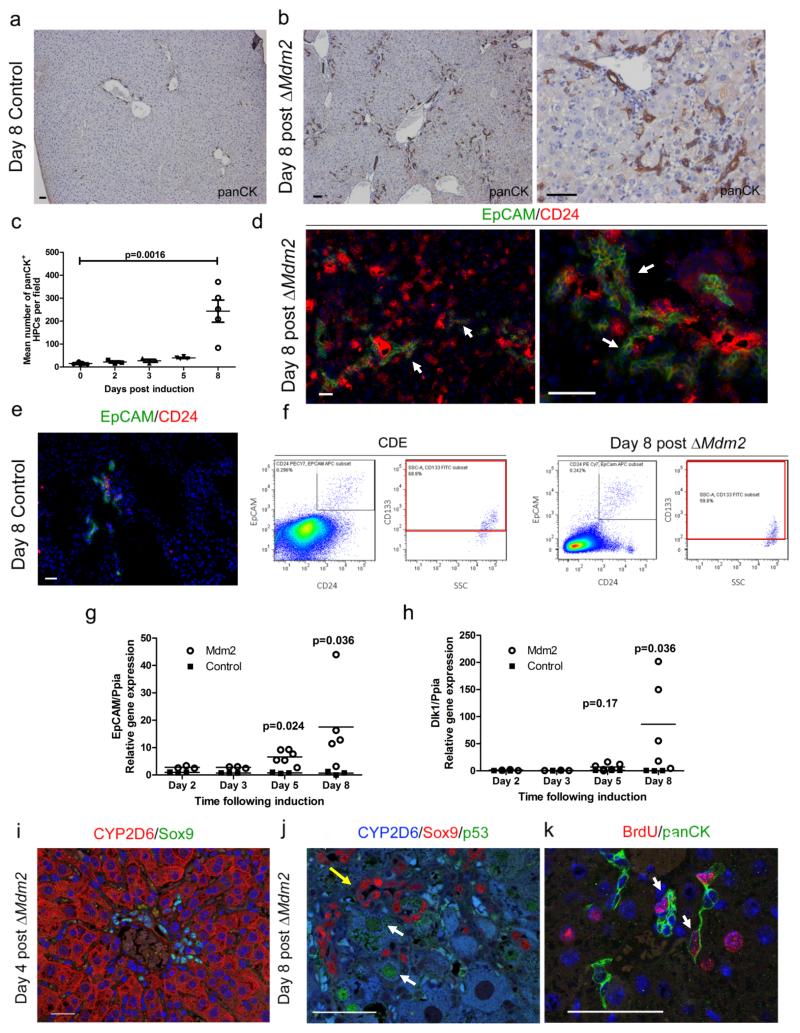
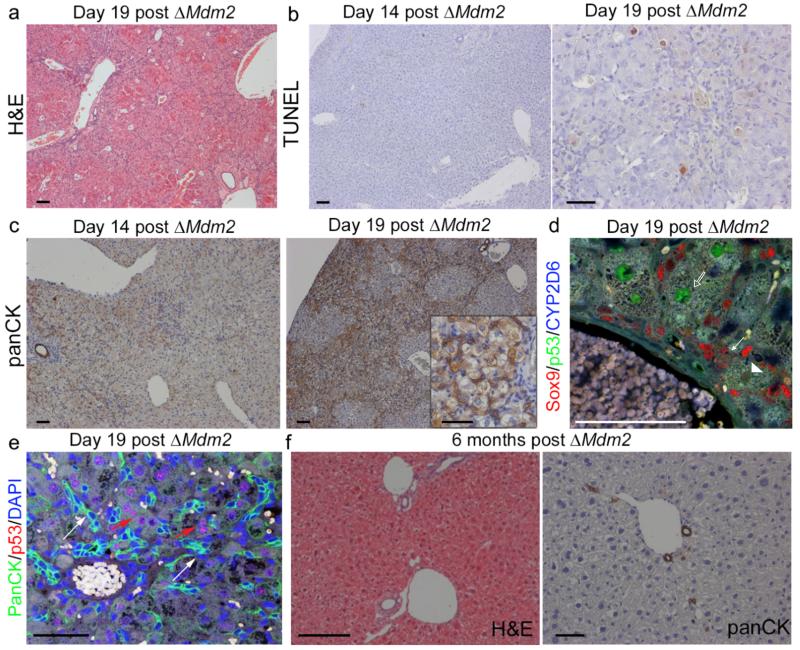
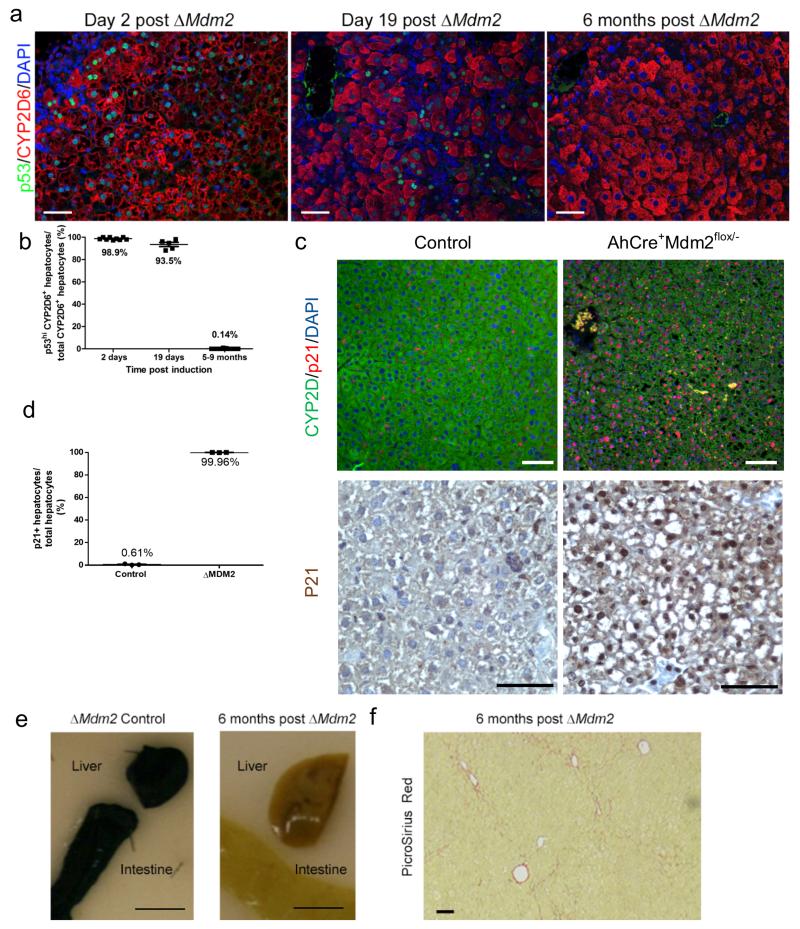
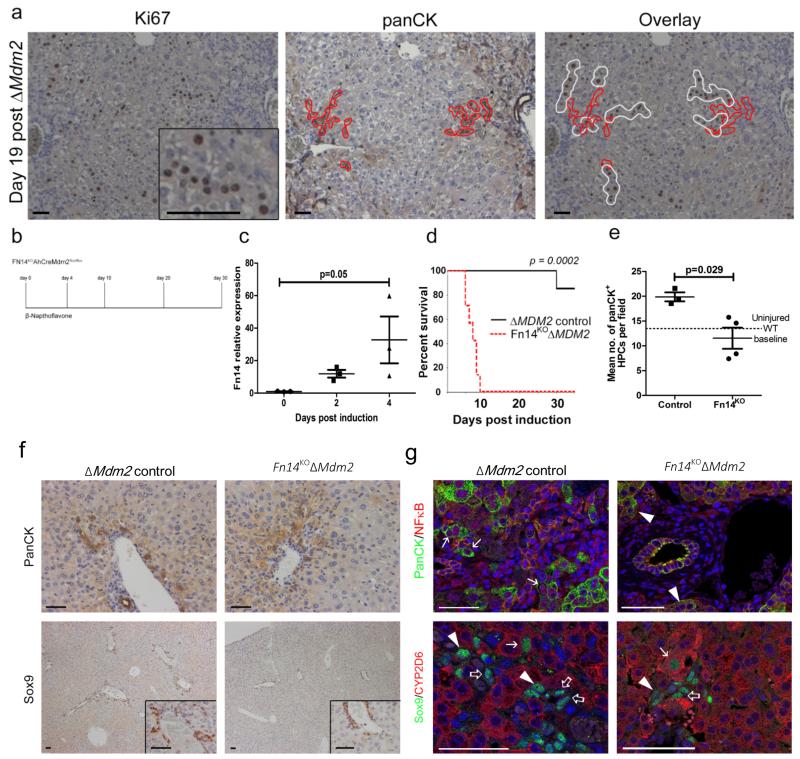
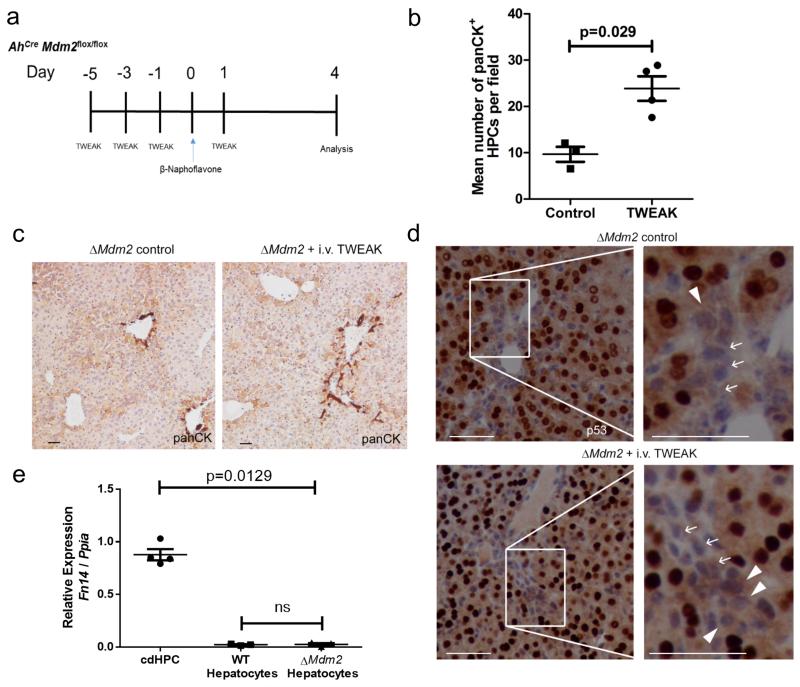
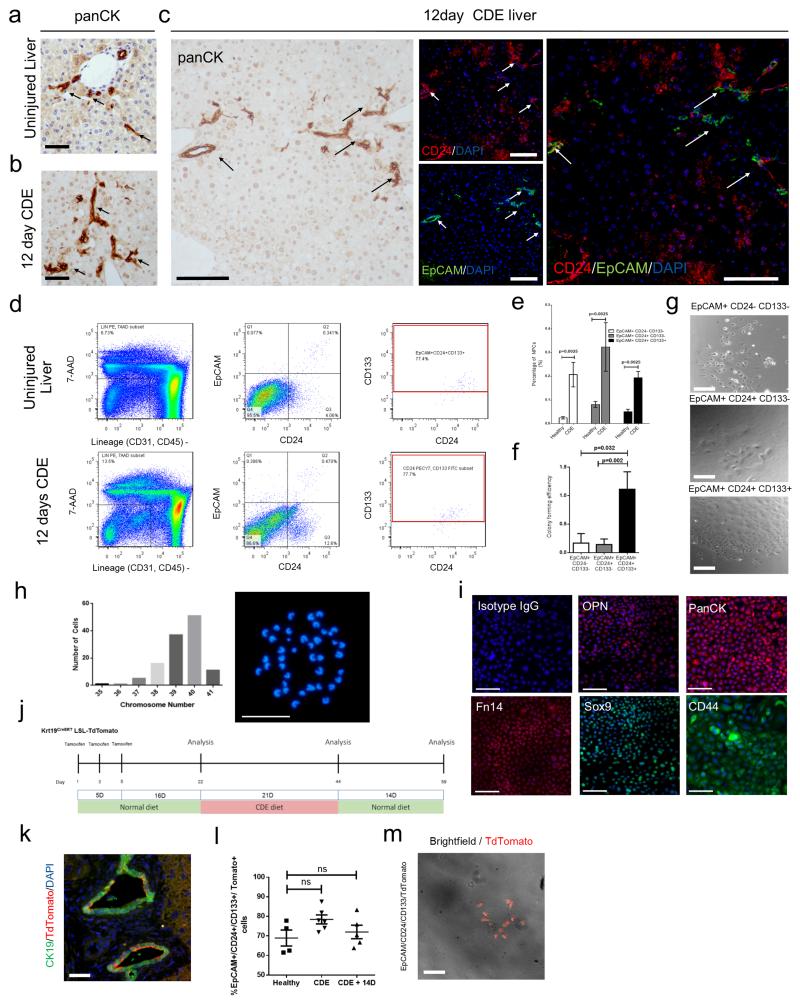
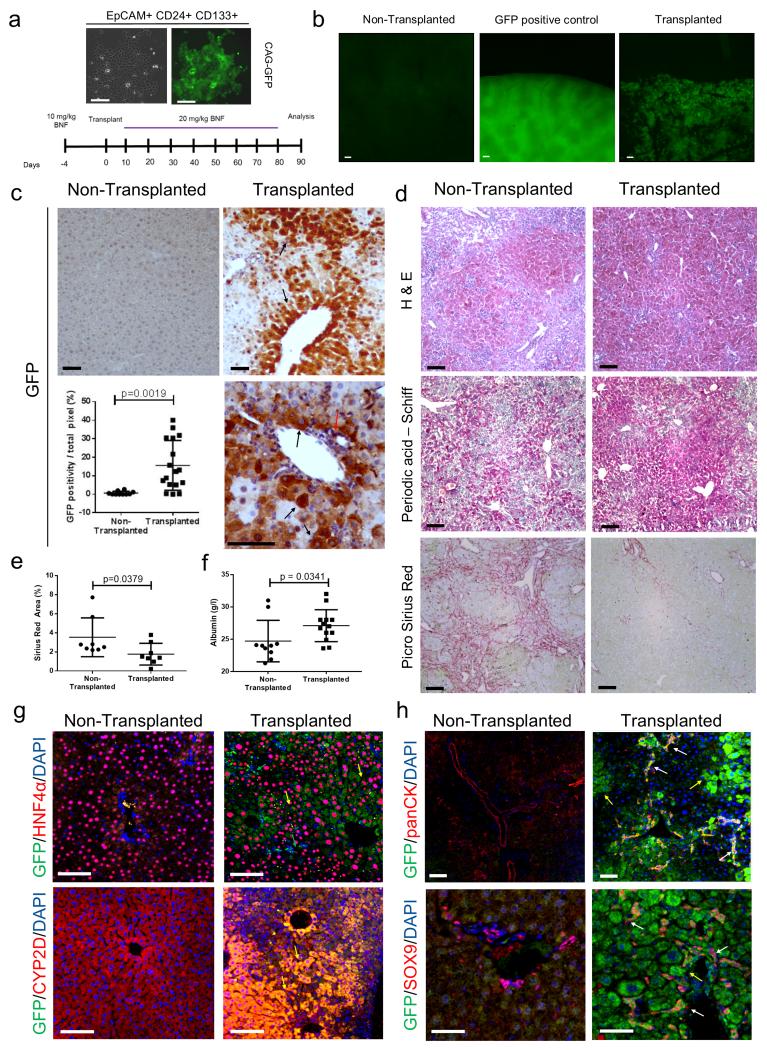
Hepatocytes and cholangiocytes self-renew following liver injury. Following severe injury hepatocytes are increasingly senescent, but whether hepatic progenitor cells (HPCs) then contribute to liver regeneration is unclear. Here, we describe a mouse model where the E3 ubiquitin ligase Mdm2 is inducibly deleted in more than 98% of hepatocytes, causing apoptosis, necrosis and senescence with nearly all hepatocytes expressing p21. This results in florid HPC activation, which is necessary for survival, followed by complete, functional liver reconstitution. HPCs isolated from genetically normal mice, using cell surface markers, were highly expandable and phenotypically stable in vitro. These HPCs were transplanted into adult mouse livers where hepatocyte Mdm2 was repeatedly deleted, creating a non-competitive repopulation assay. Transplanted HPCs contributed significantly to restoration of liver parenchyma, regenerating hepatocytes and biliary epithelia, highlighting their in vivo lineage potency. HPCs are therefore a potential future alternative to hepatocyte or liver transplantation for liver disease.


Figures

Figure 1
Figure 1. Induction of hepatocyte damage following AhCre mediated loss of Mdm2
(a) Schematic representation of the AhCreMdm2flox/flox time course used in this study. (b) Immunohistochemistry for p53 mice not induced with βNF (b-c) Immunohistochemistry for p53 in induced AhCre+Mdm2flox/flox mice with a 20, 40 and 80mg/Kg dose of βNF, Black arrows denote p53 negative cells. (d) low power photomicrograph of p53 staining in the AhCreMdm2flox/flox control. (e) Immunohistochemistry for p21 in induced AhCre+Mdm2flox/flox mice with 80mg/Kg dose of βNF. (f) low power photomicrograph of p21 staining in the AhCreMdm2flox/flox control. (g) Genomic PCR of Mdm2 exon 5/ exon 3 in hepatocytes and Non-parenchymal cells (NPCs) from ΔMdm2 versus control; n = 3 biological replicates. (h-j) Serum AST, bilirubin and albumin levels over the time course in ΔMdm2 mice compared to AhCre, Mdm2WT/WT and uninduced controls (mean ± s.e.m , (h) P = 0.042 (i) P = 0.046 (j) P = 0.026 one-way ANOVA; n = 3 mice each group, except day 8 in which n = 1 due to mortality). (k) H&E staining for ΔMdm2 following induction with 80mg/Kg βNF. (l) Apoptosis identified by TUNEL staining in ΔMdm2 mice following induction with 80mg/Kg βNF. White arrows show TUNEL positive hepatocytes. The representative images shown here are representative for 3 experiments with 3-5 mice each group per experiments. Data are represented as mean ± s.e.m. Scale bars = 50μm.
Figure 2
Figure 2. Hepatocyte Mdm2 loss results in rapid activation of HPCs
(a) Immunohistochemistry for HPCs (panCK, brown) in un-induced AhCre+Mdm2flox/flox mice. (b) Immunohistochemistry for HPCs (panCK, brown) in ΔMdm2 mice 8 days following induction with βNF. (c) Quantification of mean number of panCK+ cells per field over the 8 day time course following induction with βNF. (mean ± s.e.m, Kruskal Wallis test. P = 0.0016; n = 7,3,3,4,5 mice for days 0,2,3,5,8 respectively). (d) Immunohistochemistry for EpCAM+ CD24+ HPCs (EpCAM, green; CD24, red) in ΔMdm2 mice 8 days following induction with βNF. White arrows show EpCAM+ CD24+ HPCs (e) Immunohistochemistry for EpCAM+ CD24+ HPCs (EpCAM, green; CD24, red) in un-induced AhCre+Mdm2flox/flox mice. (f) FACS analysis of EPCAM+ CD24+ CD133+ HPCs in both 12 days CDE treated mice and βNF induced AhCre+Mdm2flox/flox mice. (g - h) mRNA expression of EpCAM and Dlk1 over the experimental time course following induction with βNF. (mean ± s.e.m, (g) P = 0.024 on day 6, P = 0.036 on day 8 (h) P = 0.036 on day 8, One-way ANOVA with Bonferroni correction; n = 3,3,6,5 and 3,3,3,3 mice for days 2,3,5,8 for experimental and controls respectively). (i) Immunohistochemistry of 4 days post ΔMdm2 showing hepatocytes, CYP2D6 (red) and HPCs, Sox9 (green). (j) Immunohistochemistry of day 8 ΔMdm2 showing hepatocytes (CYP2D6, blue), HPCs (Sox9, red) and p53 (green). White arrows CYP2D6+, p53+ hepatocytes. Yellow arrow Sox9+ HPCs adjacent to hepatocytes. (k) Immunohistochemistry of HPC proliferation, HPCs (panCK, green) and proliferation (BrdU, red). Arrows mark BrdU labelled HPCs. BrdU labelled hepatocytes are associated with HPCs. The representative images shown here are representative for 2 experiments with 3-5 mice each group per experiments. Scale bars = 50μm
Figure 3
Figure 3. Mdm2 deletion in Mdm2flox/− model leads to HPC expansion and subsequent recovery
(a) H&E staining of AhCre+Mdm2flox/− 19 days following βNF administration. (b) Apoptosis stained for by TUNEL in AhCre+Mdm2flox/− 14 and 19 days following βNF administration. (c) HPCs (panCK) in AhCre+Mdm2flox/− 14 and 19 days following βNF administration (inset, higher magnification). (d) Immunohistochemistry for HPCs (Sox9, red), hepatocytes (CYP2D6, blue) and p53 (green). White arrows denote HPCs, open arrows p53 high hepatocytes and arrowheads p53 low hepatocytes. (e) Immunohistochemistry of HPCs (PanCK, green), p53 (red) and DNA (DAPI, blue). White arrows show p53 low PanCK+ HPCs. Red arrows denote p53 high hepatocytes. (f) H&E and immunohistochemistry for HPCs (panCK) 6 months following ΔMdm2 in the AhCre+Mdm2flox/−. The representative images shown here are representative for 2 experiments with 3-5 mice each group per experiment. Scale bars = 50μm.
Figure 4
Figure 4. Loss of recombined ΔMdm2 hepatocytes over time during recovery
(a) Immunohistochemistry for hepatocytes (CYP2D6, red), p53 (green) and DNA (DAPI, blue) in AhCre+Mdm2flox/−mice 2 days, 19 days and 6 months following βNF induction. White arrow denotes p53 low hepatocyte. (b) Quantification of p53 high, CYP2D6 positive hepatocytes 2 days, 19 days and 6 months following βNF induction (mean ± s.e.m, n = 9,5 and 11 mice for day 2, 19 and 5-9 months respectively). (c) p21 (red), CYP2D6 (green), DAPI (blue) immunohistochemistry (top panel), p21 iummunohistochemistry on AhCre+Mdm2flox/− mice 2 days following βNF induction compared to control (bottom panel). (d) Quantification of p21 expressing hepatocytes (bottom panel) on AhCre+Mdm2flox/− mice 2 days following βNF induction compared to control (mean ± s.e.m. n = 20 fields at ×200 magnification for each biological sample quantified, n = 3 mice per group). (e) Whole mount X-gal staining of intestine and liver from AhCre+Mdm2flox/−mice 2 days following ΔMdM2 mice and 6 months following ΔMdm2. Scale bars = 1cm (f) PicroSirius red (fibrillar collagen) staining in ΔMdm2 livers 6 months following induction. The representative images shown here are representative for 3-5 mice each group per experiment. Scale bars = 50μm.
Figure 5
Figure 5. Fn14/TWEAK regulated HPCs are necessary for liver regeneration following hepatocyte Mdm2 deletion
(a) Immunohistochemistry for proliferation (Ki67) demarcated in white and HPCs (panCK) demarcated in red 19 days following ΔMdm2 in AhCreMdm2flox/−. (b) Schematic representing the experimental time course using the Fn14KO AhCreMdM2flox/flox. (c) mRNA expression of Fn14 following ΔMdm2 induction in AhCre+Mdm2flox/flox (mean ± s.e.m, One-way ANOVA with Bonferroni correction. P = 0.05; n = 3 mice). (d) Kaplan–Meier survival curve of ΔMdm2 control versus Fn14KOΔMdm2 (Mantel-Cox test P = 0.0002, n = 7 mice each group). (e) Quantification of number of panCK+ HPCs in ΔMdm2 control versus Fn14KO ΔMdm2, dotted line denotes baseline HPC number in a WT uninjured liver (mean ± s.e.m, Mann Whitney test. P = 0.029; n = 3 vs. 4 mice). (f) Representative images of panCK+ and Sox9+ HPCs (insets high power) in the Fn14KO AhCre+ Mdm2flox/flox model with Fn14+ AhCre+ Mdm2flox/flox controls 4 days following 80 mg/kg βNF administration. (g) Active form nuclear NFκB p65 expressing panCK+ HPCs observed in Fn14+ mice (arrows) but not in HPCs from Fn14KO mice (arrowheads). Sox9+/CYP2D6+ co-staining association of Sox9+/CYP2D6low HPCs (open-arrows) with Sox9+/CYP2D6intermediate cells with intermediate morphology (arrowheads) and Sox9+/CYP2D6+ hepatocytes (arrows) in each experimental group. The representative images shown here are representative for 3-7 mice each group per experiment. Scale bars = 50 μm.
Figure 6
Figure 6. TWEAK enhances ductular reaction through activation of HPCs
(a) Schematic representing the experimental time course using the AhCreMdm2flox/flox mice that receive intravenous injection of TWEAK. (b) Quantification of number of panCK+ HPCs in ΔMdm2 control versus ΔMdm2 given recombinant TWEAK (mean ± s.e.m, Mann Whitney test. P = 0.029; n = 3-4 mice per group). (c) panCK staining in ΔMdm2 control mice versus ΔMdm2 mice given recombinant TWEAK. (d) p53 immunohistochemistry and analysis of portal tracts of both ΔMdm2 controls and mice treated with repeated injection of i.v. TWEAK, shows p53- cells with hepatocyte like morphology adjacent to portal tracts and areas of ductular expansion 4 days following induction (80mg/kg βNF). Arrows show p53- HPCs and arrowheads show p53- hepatocytes. (e) mRNA expression of Fn14 from isolated HPCs and, hepatocytes isolated from wild type mice, and hepatocytes isolated from ΔMdm2 mice (mean ± s.e.m, One-way ANOVA. P = 0.0129; n = 3 mice). The representative images shown here are representative for 3-4 mice. Scale bars = 50μm.
Figure 7
Figure 7. In vitro expanded HPCs are genetically and phenotypically stable
(a) Immunohistochemistry for HPCs (panCK) in uninjured liver and (b) mice treated with 12 days CDE diet. (c) Immunohistochemistry on serial sections for HPCs (panCK) and EpCAM (green), CD24 (red) and DAPI (blue). Arrows show EpCAM+ CD24+ HPCs. (d) FACS gating strategy to isolate 7AAD−/CD31−/CD45−/Ter119−/EpCAM+/CD24+/CD133+ HPCs from uninjured and CDE injured liver. The data shown here are representative images for 10 mice (e) Histogram representing the percentage representation of EpCAM+ CD24− CDE133−, EpCAM+ CD24+ CD133− and EpCAM+ CD24+ CD133+ in the NPC fraction of healthy or CDE treated livers (mean ± s.e.m, Mann-Whitney test. P = 0.0025; n = 4 mice each group). (f) Colony forming efficiency of EpCAM+ CD24− CDE133−, EpCAM+ CD24+ CD133− and EpCAM+ CD24+ CD133+ populations in vitro (mean ± s.e.m, One-way ANOVA. P = 0.032, and 0.002 respectively; n = 5 biological replicates per group).These data are representative of 3 individual experiments (g) Phase contrast images of the colonies formed by the EpCAM+ CD24− CD133−, EpCAM+ CD24+ CD133− and EpCAM+ CD24+ CD133+ populations. (h) Frequency of chromosome number in metaphase spreads from in vitro expanded HPCs, inset, a representative example of a normal karyotype from in vitro expanded cdHPCs. (i) Immunocytochemistry of HPC markers in in vitro expanded HPCs. (j) Schematic representation of the experiment to determine the origin of cdHPC. (k) Immunohistochemistry on healthy, tamoxifen induced Krt19CreERTLSLTdTomato mice for recombined HPC, CK19 (green), TdTomato (red), and DAPI (blue). (l) Percentage of EpCAM+ CD24+ CD133+ population expressing TdTomato in uninjured Krt19CreERTLSLTdTomato mice, Krt19CreERTLSLTdTomato mice treated with CDE diet, Krt19CreERTLSLTdTomato mice treated with CDE diet followed by 14 days of normal diet (mean ± s.e.m, One-way ANOVA. P >0.05; n = 5 mice). (m) Merged phase contrast and fluorescent image of isolated EpCAM+CD24+CD133+TdTomato+ cells from Krt19CreERTLSLTdTomato mice receiving CDE diet. Data are represented as mean ± s.e.m. n = ≥3 each group. in vitro data represents three independent experiments. Scale bars = 50μm.
Figure 8
Figure 8. Relationship between activated HPCs and hepatocytes
(a) A schematic representation of the AhCre+Mdm2flox/flox as a transplant recipient model of GFP expressing HPCs. Expanded HPCs stably transfected with a CAG-GFP expressing vector, left photomicrograph phase contrast, right GFP. (b) Low power epifluorescence of sham transplanted liver, ubiquitous CAG-GFP expressing liver and ΔMdm2 liver with CAG-GFP expressing transplanted in vitro expanded HPCs. (c) Immunohistochemistry for GFP in non-transplanted ΔMdm2 controls versus ΔMdm2 transplanted with CAG-GFP expressing HPCs. Black arrows denote GFP expressing hepatocytes and red arrow GFP expressing duct. Dot-plot shows quantification of GFP in transplanted versus non-transplanted liver (mean ± s.d, Student’s t-Test. P = 0,0019; n = 17 fields at ×200 magnification). (d) Histochemical analysis of non-transplanted AhCre+Mdm2flox/flox mice and cdHPC transplanted AhCre+Mdm2flox/flox mice. Hematoxylin and eosin (top panel), Periodic acid – Schiff (middle panel), PicroSirius Red (bottom panel). (e) PicroSirius Red area of non-transplanted AhCre+Mdm2flox/flox mice and cdHPC transplanted AhCre+Mdm2flox/flox mice (mean ± s.d, Mann-Whitney test. P = 0.0379; n = 8 mice each group). (f) Serum Albumin level of non-transplanted AhCre+Mdm2flox/flox mice and cdHPC transplanted AhCre+Mdm2flox/flox mice (mean ± s.d, Mann-Whitney test. P = 0.0341; n = 10 and 13 mice for non-transplanted group and transplanted group respectively). (g) Immunohistochemistry for GFP (green), hepatocytes (HNF4α or CYP2D6, red) and DNA (blue) in CAG-GFP HPC transplanted livers versus non-transplanted controls. (h) Immunohistochemistry for GFP (green), HPCs (panCK or Sox9, red) and DNA (blue) in non-transplanted controls versus CAG-GFP HPC transplanted animals. Data are represented as mean ± s.d. The data shown are representative of 3 different experiments with 8-10 mice each group. Scale bars = 50μm.

Comment in

References

    1. Horslen SP, Fox IJ. Hepatocyte transplantation. Transplantation. 2004;77:1481–1486. - PubMed
    1. Horslen SP, et al. Isolated hepatocyte transplantation in an infant with a severe urea cycle disorder. Pediatrics. 2003;111:1262–1267. - PubMed
    1. Malato Y, et al. Fate tracing of mature hepatocytes in mouse liver homeostasis and regeneration. The Journal of clinical investigation. 2011;121:4850–4860. - PMC - PubMed
    1. Erker L, et al. Therapeutic liver reconstitution with murine cells isolated long after death. Gastroenterology. 2010;139:1019–1029. - PMC - PubMed
    1. Hay DC. Cadaveric hepatocytes repopulate diseased livers: life after death. Gastroenterology. 2010;139:729–731. - PubMed

Publication types

MeSH terms